Discovery of Diffuse X-ray Emission in One of the Nearest Massive Star-Forming Regions NGC 2024
Abstract
A deep 75 ks Chandra ACIS–I data of NGC 2024 was analyzed, aiming at a search for diffuse X-ray emission in this one of the most nearby (415 pc) massive star-forming regions. After removing point sources, an extended emission was detected in the central circular region with a radius of 0.5 pc. It is spatially associated with the young massive stellar cluster. Its X-ray spectrum exhibits a very hard continuum ( keV) and a sign of He-like Fe Kα line with the 0.5–7 keV absorption corrected luminosity of 2 ergs s-1 . Undetected faint point sources, estimated from the luminosity function of the detected sources, contribute less than 10% to this emission. Hence the emission is truly diffuse in nature. Because of the proximity of NGC 2024 and the long exposure, this discovery is one of the most strong supports for the existence of the diffuse X-ray emission in massive star-forming regions.
1 Introduction
Increasing evidences of diffuse X-ray emission has been found in massive star-forming regions (MSFRs) with the Chandra X-ray Observatory; the Rosette Nebula (at a distance of kpc; Townsley et al. 2003), M17 ( kpc; Townsley et al. 2003), RCW 38 ( kpc; Wolk et al. 2002), NGC 6334 ( kpc; Ezoe et al. 2006), RCW 49 (1.9-7.9 kpc; Townsley et al. 2004), W51A (5.5-7.5 kpc; Townsley et al. 2004), NGC 3603 ( kpc; Moffat et al. 2002), the Arches Cluster ( kpc; Yusef-Zadeh et al. 2002), and the Quintuplet Cluster ( kpc; ; Wang et al. 2002). Townsley et al. (2003) explained the diffuse soft X-ray emission found in M17 in the context of strong shocks by fast stellar winds from young massive stars (Dyson and de Vries, 1972; Castor et al., 1975; Weaver et al., 1977). Recent results on NGC 6334 by Ezoe et al. (2006) indicate that the spectra of the diffuse emission varies from place to place; those in tenuous molecular cloud regions are soft and thermal with temperatures of several keV, while those in dense cores exhibit harder continua with a photon index of 1. They also have shown that these thermal and non-thermal spectra of the diffuse X-ray emission in MSFRs, found as a mixture in the NGC 6334 case, may be generally explained by the stellar-wind shock model. In spite of these observational progresses, even with Chandra, there remains an uncertainty how much undetected faint point sources contribute to the emission, because these MSFRs are relatively distant (kpc).
In order to unambiguously examine the diffuse X-ray emission in MSFRs as possible as we can, we analyzed archival Chandra data of NGC 2024. This region, known as the Flame nebula, is one of the nearest MSFRs ( pc; Anthony-Twarog 1982), located in the Orion Nebula. It is an HII region considered to be illuminated by an O8V-B2V star IRS 2b (Bik et al., 2003). In the vicinity of IRS 2b, there are one early B star candidate associated with an ultra compact HII region G206.543-16.347 and an infrared source IRS 2 (Lenorzer et al., 2004), and seven compact dust condensations named FIR 1-7, possibly massive protostars (Mezger et al., 1988). In addition, low-mass (M⊙ ) young stars have been found by near infrared observations (Lada, 1991). The estimated age of NGC 2024 ranges from 0.3 (Meyer, 1996) to several Myr (Comeron et al., 1996). A previous analysis of the same Chandra data on point sources has been published by Skinner et al. (2003). In this paper, we focus on a search for the diffuse X-ray emission in this representative MSFR.
2 Observation
Chandra observed NGC 2024 on 2001 August 8-9 using the ACIS–I for 21.9 hr. We started with the level 1 event files in the same way as Skinner et al. (2003). Utilized analysis software versions for the standard data reduction are different; we used the CIAO (Chandra Interactive Analysis of Observations) software version 2.3 and the calibration data base version 2.18. These new softwares allowed us to correct the data for the effect of the charge transfer inefficiency, while it was not possible in Skinner et al. (2003). No background flares were seen during the observation with the average count rate of the six ACIS chips of 9.1 ct s-1. We then excluded times of the average rate. This procedure excluded 2% of the exposure time. After these data screenings, the nominal exposure has become 75.3 ksec.
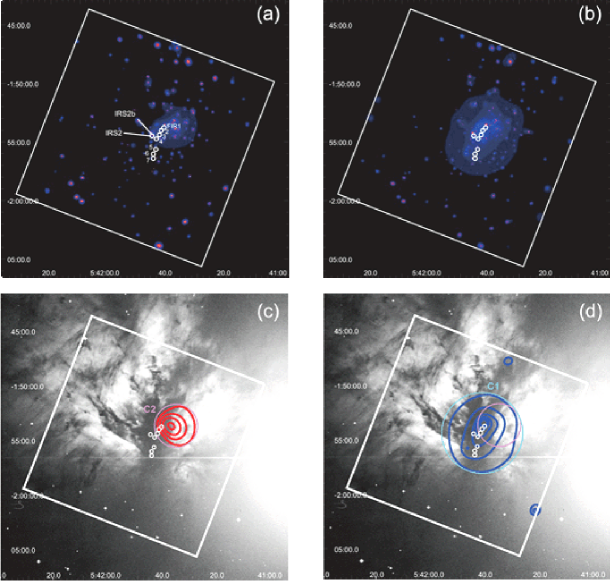
We searched the data for diffuse X-ray emission, following to the analysis method of Ezoe et al. (2006). We first created adaptively smoothed X-ray images in two energy bands, as shown in figures 1 (a) and (b). We see a sign of an extended emission associated with the massive star IRS 2b and its vicinity. The extended emission in 0.5–2 keV is strong in the north-west direction of IRS 2b, while that in 2–7 keV is elongated in the north-west to the south-east direction. We then used the wavedetect program to identify sources using images in three energy bands (0.5–2, 2–8 and 0.5–8 keV) independently, in order not to miss very soft or strongly absorbed sources. The significance criterion and wavelet scales were set at and 1-16 pixels in multiples of . In the ACIS–I field of view, 301 sources were detected. Among them, 28 sources are newly identified ones, not listed in Skinner et al. (2003), due to our three-band searching method.
We excluded all the detected point sources by creating a point source mask using the “Chandra Ray Tracer”111http://cxc.harvard.edu/chart/threads/index.html. For each source, we defined a radius to include % of photons at the Al K-line energy (1.497 keV). Then we excluded all these regions by applying the mask to the raw ACIS–I image, and created images of the residual emission using the CIAO tools dmfilth and csmooth. Figures 1 (c) and (d) show thus obtained images of the extended emission. In order to evaluate the significance of this emission, we defined a circular region named C1 (the large circle in the panel d of figure 1) with a radius of 40.5 pc. The total area of the C1 is 43/39 arcmin2 or 0.62/0.52 pc2 before/after excluding the area around point sources. The 0.5–7 keV count rate of the C1 is cts s-1, while that of the same region in blank-sky data is cts s-1. Errors are 1 statistical ones. Hence, its residual count rate is cts s-1 or 4270110 cts. It is thus clear that a highly significant extended emission is present in the central region of NGC 2024.
3 Extended X-ray Emission
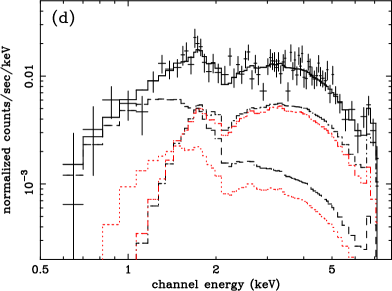
In the presence of the significant excess emission, we immediately considered a possibility of the diffuse emission. To know its basic properties, we compared its background subtracted spectrum in figure 2 (a) with that summed over 176 point sources detected within the C1. The weighted ARF (ancillary response function) and RMF (response matrix function) were calculated using the CIAO programs mkwarf and mkwrmf, respectively. The apply_acisabs script was utilized when creating ARF files, to correct them for the decrease in the ACIS quantum efficiency. The background spectra are extracted from the same regions in the blank-sky data for individual regions. From figure 2 (a), we can see important features of the extended emission. First, it is about one order of magnitude fainter than the summed point sources. Second, the extended emission show a harder continuum in the 1–7 keV range. Third, a hint of an emission line is seen in 6–7 keV.
To know basic parameters of the extended emission, we then conducted spectral fitting. We employed a simple power-law model with an interstellar absorption and a narrow Gaussian. Here and hereafter all quoted errors in the spectral fitting refer to 90% confidence levels unless otherwise noted. The result is shown in figure 2 (b), where table 1 lists the obtained parameters. The fit was not acceptable with because of the excess around 0.5–1 keV. The line center energy indicates a He-like Fe Kα line from thermal plasma. Then, we consider an alternative “leaky absorber” condition; a single thermal emission component reaches us via two (or more) paths with different absorptions. This situation is possible in the MSFR like NGC 2024 where the density of the molecular cloud varies from place to place. We hence fitted the spectrum by a sum of two thermal components with independent absorptions, but with their temperatures and abundances together. The result is shown in figure 2 (c) and table 1. As a thin thermal plasma model, we utilized the APEC (astrophysical plasma emission code)222http://hea-www.harvard.edu/APEC/ model. Then, the fitting result is improved from to 1.3, which is significant with 99.7% confidence according to an F-test. The soft excess is represented by the mildly absorbed high temperature emission. The best fit temperature is high 11 keV, consistent with the small photon index of in the power-law model fit. The 0.5–7 keV flux obtained from the leaky absorption model is 1.1 ergs s-1 cm s-2 .
For comparison, we quantified the summed point-source spectrum. In the same manner of the extended emission, the source spectrum, the background, ARF, and RMF files were obtained. The fit for a single thermal emission model with one absorption was not acceptable with because this model cannot represent both soft excess below keV, similar to that in the extended emission case, and also various emission lines. Hence, we used the leaky absorption model with free Ne, Mg, Si, S, Ar, Ca, and Fe abundances, in order to represent the data better. We obtained results as shown in table 2 and figure 3. The best-fit temperature of 4.4 keV is consistent with typical values of young low-mass stars (e.g., Imanishi et al. 2001) and significantly lower than that of the extended emission.
In spite of these spectral analysis, We here must evaluate an effect of photons escaping from the summed point sources because the point sources are far brighter than the extended emission. In the same way as Ezoe et al. (2006), we took into account the summed point source spectrum by multiplying the best-fit model for the summed point sources by the energy-dependent escaping-fraction curve, estimated by the “Chandra Ray Tracer” (ChaRT). We have found that this contributes % to the extended emission. we remove their 98% photons at 2 keV. After correcting the escaping photon effect, the 0.5–7 keV flux of the extended emission becomes 6.3 ergs s-1 cm s-2 , yielding an absorption-uncorrected luminosity of 1.3 ergs s-1 or the surface brightness of 2 ergs s-1 pc-2 at an assumed distance of 415 pc.
We refitted the C1 spectrum including the escaping photon effect. The result is shown in figure 2 (d) and table 1. The fitting result was again acceptable. Also, the escaping photon effect has a relatively little effect on the fitting parameters except the normalizations. All the parameters are consistent with the previous ones before including this effect within 90% errors. The absorption-corrected X-ray luminosity is 2 ergs s-1 .
In addition, we also conducted the same spectral analysis to a C2 region, the soft X-ray clump seen in figure 1 (c). The obtained photon index and temperature are similar to those of the C1 region within errors, except a lower absorption column density ( cm2 when fitted with the leaky absorption model including the escaping photon effect). No sign of emission lines was seen. Hence, the spectral hardness of the extended emission is considered to be common within the whole region, and the offset peak in the soft band map is simply a consequence of a slight reduced absorption.
4 Luminosity Function
Based on the surface brightness of the extended emission, we estimated contribution from unresolved faint point sources to this emission, in order to know whether it can be explained by faint sources that are individually undetectable. We followed the same way of Ezoe et al. (2006) in which we utilized the luminosity function of the detected point sources. We below utilize the X-ray surface brightness of the extended emission after subtracting the escape photons from the point sources, obtained in the last section.
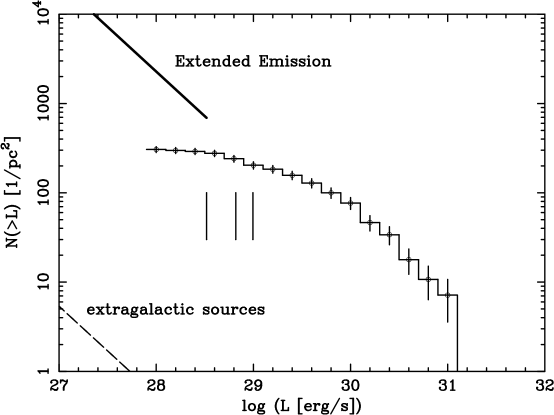
Figure 4 shows the luminosity function of the 176 point sources in the C1. We derived the absorption-uncorrected 0.5–7 keV luminosity . The X-ray flux of each point source is obtained by spectral fitting for a bright source ( net counts or counts after subtracting the background), while by using a count-to-flux conversion factor derived from the summed point sources 1.6 ergs s-1 cm s-2 (net counts/s)-1 for a fainter source.
The source number density increases toward lower luminosities and saturates below 10 net counts, corresponding to the completeness limit of this observation. We here estimated the limit from source number histograms as a function of the logarithm of net counts, and regarded the maximum of the histogram as the completeness limit. When utilizing the above conversion factor, 10 net counts correspond to 41028 ergs s-1 , in terms of the absorption-uncorrected 0.5–7 keV luminosity. This limit is one of the most lowest ones among those in the past Chandra observations of MSFRs.
The solid line in figure 4 indicates the necessary point source number, in order to explain the extended emission by point sources. The point number is clearly short, which supports that the extended emission is truly diffuse. Furthermore, even when we extrapolate the luminosity function toward a lower limit of 0 ergs s-1 , using a linear function fitted in log-log space from the completeness limit to ergs s-1 , the estimated contribution of unresolved sources is at most % of the extended emission. Based on these results, the extended emission of NGC 2024 can be considered as diffuse in nature.
5 Discussion
We have found the diffuse X-ray emission in NGC 2024. Because of the proximity of NGC 2024 and the long exposure time, this discovery itself is one of the strongest supports for the existence of the diffuse emission in MSFRs, among the previous Chandra results. Also, this result provides us with a new observational evidence that, even in a MSFR where only late O to early B stars exist, the diffuse X-ray emission can be observed if the sensitivity is enough high. The spectral analysis suggests that the diffuse emission is dominated by the thermal emission. At the same time, since the continuum ( keV) of the diffuse emission is harder than typical spectra of young stars, a part of the emission may come from non-thermal origin. In NGC 6334, the soft-thermal and hard possibly non-thermal regions can be spatially distinguished (Ezoe et al., 2006). In NGC 2024, the soft and hard regions may be co-spatial and hence be observed as a mixture of both thermal and non-thermal emission.
We then discuss whether the thermal or non-thermal interpretation is feasible in terms of energetics. First, if we assume that the whole diffuse emission is thermal, the total plasma energy will be ergs s-1 where is a filling factor, from the equation (3) in Ezoe et al. (2006). Using the X-ray luminosity and , the plasma cooling time is estimated as yr, which is far longer than the age of NGC 2024, from 0.3 (Meyer, 1996) to several Myr (Comeron et al., 1996). Although the sound crossing time in a 10 keV plasma across the region of 0.5 pc in size is yr and hence short, the plasma with the estimated pressure of K cm-3, calculated from the equation (5) in Ezoe et al. (2006), may be confined by the dense HII region known to exist around the molecular cloud dark lane (figure 1 c) (Subrahmanyan et al., 1997) and also the strong magnetic field within the molecular cloud (Crutcher et al., 1999). Then, by dividing the total energy by the assumed age of NGC 2024 of 0.3 Myr, the average energy input is estimated as ergs s-1
Second, we consider the non-thermal possibility. The flat continuum ( or keV) of the emission strongly suggests the bremsstrahlung emission by 10 keV to several MeV electrons, rather than the synchrotron or inverse Compton emission (Ezoe et al., 2006). Since the Coulomb loss overwhelms the bremsstrahlung emission, if we assume that the diffuse emission is totally non-thermal, the necessary kinematic energy to be supplied is at least 105 times larger than the observed X-ray luminosity, 21036 ergs s-1 .
One of the most plausible energy sources for the diffuse emission is the shocks generated by fast stellar winds ( km s-1) from young massive stars. Its huge kinematic energy of the stellar winds can be easily converted via the strong shocks, among dense molecular clouds and HII regions, into the thermal (and non-thermal) energy of particles in the surrounding gases. This explanation has been proposed in M17 (Townsley et al., 2003) and NGC 6334 (Ezoe et al., 2006). In NGC 2024, there are at least one late O to early B star IRS 2b (O8V-B2V), one early B star candidate IRS 2, and 7 possibly massive protostars. As shown in figure 1, these massive stars are spatially associated with the diffuse emission. A typical kinematic luminosity of the stellar wind is ergs s-1 per one B2V-O8V star (Howarth et al., 1989; Prinja, 1990; Panagia, 1973). Therefore, the necessary energy supply of the thermal interpretation is explained if there is at least one massive star with a strong wind, comparable or stronger than those of a typical B0.5V star. The non-thermal interpretation is also possible if we consider all the 9 sources are massive stars and have strong winds. Wind-wind collisions may effectively increase the energy of a shock. Hence, the stellar wind scenario is possible from the viewpoint of the energetics.
YE is financially supported by the Japan Society for the Promotion of Science.
References
- Anthony-Twarog (1982) Anthony-Twarog, B. J.: 1982, AJ 87, 1213
- Bik et al. (2003) Bik, A., Lenorzer, A., Kaper, L., Comerón, F., Waters, L. B. F. M., de Koter, A., and Hanson, M. M.: 2003, A&A 404, 249
- Castor et al. (1975) Castor, J., McCray, R., and Weaver, R.: 1975, ApJ 200, L107
- Comeron et al. (1996) Comeron, F., Rieke, G. H., and Rieke, M. J.: 1996, ApJ 473, 294
- Crutcher et al. (1999) Crutcher, R. M. and Roberts, D. A. and Troland, T. H. and Goss, W. M.: 1999, ApJ 515, 275
- Dyson and de Vries (1972) Dyson, J. E. and de Vries, J.: 1972, A&A 20, 223
- Ezoe et al. (2006) Ezoe, Y., Kokubun, M., Makishima, K., Sekimoto, Y., and Matsuzaki, K.: 2006, ApJ 638, 860
- Giacconi et al. (2001) Giacconi, R., Rosati, P., Tozzi, P., Nonino, M., Hasinger, G., Norman, C., Bergeron, J., Borgani, S., Gilli, R., Gilmozzi, R., and Zheng, W.: 2001, ApJ 551, 624
- Howarth et al. (1989) Howarth, I. D. and Prinja, R. K.: 1989, ApJS 69, 527
- Imanishi et al. (2001) Imanishi, K., Koyama, K., and Tsuboi, Y.: 2001, ApJ 557, 747
- Lada (1991) Lada, C.: 1991, The Physics of Star Formation and Early Evolution, Advanced Sci. Ser., ed. CJ Lada & ND Kylafis, 1991. 329 p.
- Lenorzer et al. (2004) Lenorzer, A., Bik, A., de Koter, A., Kurtz, S. E., Waters, L. B. F. M., Kaper, L., Jones, C. E., and Geballe, T. R.: 2004, A&A 414, 245
- Meyer (1996) Meyer, M. R.: 1996, PASP 108, 380
- Mezger et al. (1988) Mezger, P. G., Chini, R., Kreysa, E., Wink, J. E., and Salter, C. J.: 1988, A&A 191, 44
- Moffat et al. (2002) Moffat, A. F. J., Corcoran, M. F., Stevens, I. R., Skalkowski, G., Marchenko, S. V., Mücke, A., Ptak, A., Koribalski, B. S., Brenneman, L., Mushotzky, R., Pittard, J. M., Pollock, A. M. T., and Brandner, W.: 2002, ApJ 573, 191
- Panagia (1973) Panagia, N.: 1973, AJ 78, 929
- Prinja (1990) Prinja, R. K. and Barlow, M. J. and Howarth, I. D.: 1990, ApJ 361, 607
- Skinner et al. (2003) Skinner, S., Gagne, M., and Belzer, E.: 2003, ApJ 598, 375
- Subrahmanyan et al. (1997) Subrahmanyan, R. and Goss, W. M. and Megeath, S. T. and Barnes, P. J.: 1997, ApJ 290, 431
- Townsley et al. (2003) Townsley, L. K., Feigelson, E. D., Montmerle, T., Broos, P. S., Chu, Y., and Garmire, G. P.: 2003, ApJ 593, 874
- Townsley et al. (2004) Townsley, L. K., Feigelson, E. D., Montmerle, T., Broos, P. S., Chu, Y., and Garmire, G. P.: 2004, astro-ph/0406349
- Wang et al. (2002) Wang, Q. D., Gotthelf, E. V., and Lang, C. C.: 2002, Nature 415, 148
- Weaver et al. (1977) Weaver, R., McCray, R., Castor, J., Shapiro, P., and Moore, R.: 1977, ApJ 218, 377
- Wolk et al. (2002) Wolk, S. J., Bourke, T. L., Smith, R. K., Spitzbart, B., and Alves, J.: 2002, ApJ 580, L161
- Yusef-Zadeh et al. (2002) Yusef-Zadeh, F., Law, C., Wardle, M., Wang, Q. D., Fruscione, A., Lang, C. C., and Cotera, A.: 2002, ApJ 570, 665


| Modela | b | b | or | Norm.1e | Norm.2e | Norm. | /d.o.f. | ||||
|---|---|---|---|---|---|---|---|---|---|---|---|
| po+ga | 1.3 | 0.94 | 1.2 | 6.7 | 6.3 | 1.1 | 2.9 | 99.2/65 | |||
| leaky abs.1 | 0.62 | 4.0 | 11 | 1.3 | 2.2 | 9.2 | 1.1 | 4.0 | 85.9/64 | ||
| leaky abs.2 | 0.21 | 3.3 | 11(7.6) | 2.5(1.0) | 0.73 | 4.4 | 0.63 | 2.2 | 84.2/64 |
a Fitting models. The po+ga, leaky abs.1 and leaky abs.2 indicate
the power-law plus a narrow Gaussian model, the leaky absorption model
without and with the escaping photon effect from the point sources, respectively.
b Interstellar absorption, with being the hydrogen column density in 1022 cm-2.
In the case of the leaky absorption model, two column densities are given.
c is the photon index in the power-law model, while is a plasma temperature in keV.
d Metal abundance in solar, used in the leaky absorption model.
e Normalization is photon flux at 1 keV in 10-4 photons cm-2 s-1 in the power-law model,
and 10-18/4 in the leaky absorption model, where is a distance to NGC 2024 and
is an emission measure in cm-3.
f A line center energy in keV.
g Line intensity in 10-6 photons cm-2 s-1.
h The 0.5–7 keV flux in 10-12 ergs s-1 cm s-2 .
i The absorption-corrected 0.5–7 keV luminosity in 1031 ergs s-1 .
| param | leaky abs. model |
|---|---|
| 0.55 | |
| 2.7 | |
| 4.4 | |
| b | 2.9 |
| b | 1.1 |
| b | 0.06 |
| b | 0.93 |
| b | 1.2 |
| b | 0.59 |
| b | 0.23 |
| Norm.1 | 17 |
| Norm.2 | 130 |
| 9.5 | |
| 43 | |
| /d.o.f. | 292.1/157 |
a Notations and symbols are the same as the leaky absorption model in table 1
except abundances.
b Metal abundances of individual elements in solar, while those of other elements
are fixed at 1 solar.