The Spitzer c2d Survey of Nearby Dense Cores: II: Discovery of a Low Luminosity Object in the “Evolved Starless Core” L1521F
Abstract
We present Spitzer Space Telescope observations of the “evolved starless core” L1521F which reveal the presence of a very low luminosity object (0.07 ). The object, L1521F-IRS, is directly detected at mid-infrared wavelengths (5 µm) but only in scattered light at shorter infrared wavelengths, showing a bipolar nebula oriented east-west which is probably tracing an outflow cavity. The nebula strongly suggests that L1521F-IRS is embedded in the L1521F core. Thus L1521F-IRS is similar to the recently discovered L1014-IRS and the previously known IRAM 04191 in its substellar luminosity and dense core environment. However these objects differ significantly in their core density, core chemistry, and outflow properties, and some may be destined to be brown dwarfs rather than stars.
1 Introduction
Studies of starless dense cores just before they form a protostar are important as they provide the initial conditions for star formation. However, identifying this stage of evolution is not easy. The majority of cores are starless in the sense that they do not harbor an IRAS point source to a sensitivity of 0.1(/140 pc)2 (Myers et al. 1987; Lee & Myers 1999), but which starless cores are close to forming a star? Recently attempts have been made to identify a group of “evolved” starless cores with physical, chemical and kinematic properties (e.g., high central densities, molecular depletion, infall asymmetry) that suggest they are close to star formation (Crapsi et al. 2005a; Kirk et al. 2005). It is possible that some of these cores have already begun star formation, containing central sources whose luminosity is too low to have been detected by IRAS. They are prime targets for sensitive mid-infrared searches for very low luminosity objects with the Spitzer Space Telescope (hereafter Spitzer).
Surprisingly, the first “starless” core observed by the Spitzer Legacy program “From Molecular Cores to Planet Forming Disks”, or c2d (Evans et al. 2003), L1014, was found to contain an embedded source, L1014-IRS with a very low luminosity 0.1 (Young et al. 2004; Bourke et al. 2005; Huard et al. 2006). Interestingly, L1014 shows very little evidence of being an “evolved” core (Crapsi et al. 2005b). If L1014-IRS and similar objects have accretion rates which are significantly lower than that expected of low mass protostars, then some are likely to be proto-brown-dwarfs. Thus, L1014-IRS and similar discoveries may pose a significant challenge to our understanding of star formation.
In this letter we report on our Spitzer observations of the object L1521F-IRS which confirm that it is embedded within the dense core L1521F in Taurus (140 pc) and has a very low luminosity. L1521F-IRS is of particular interest, as L1521F (a.k.a. MC27, Mizuno et al. 1994; Codella et al. 1997; Lee, Myers & Tafalla 2001) is one of the two best examples of an evolved “starless” core, along with L1544 (Crapsi et al. 2004, 2005a). L1521F shows a high central density ( cm-3), infall asymmetry, molecular depletion, and enhanced deuterium fractionation (Onishi, Mizuno & Fukui 1999; Shinnaga et al. 2004; Crapsi et al. 2004). Observations of CO 2-1 show no clear evidence for structured (i.e., bipolar) outflow emission, but line wings are seen in HCO+ 3-2 (Onishi et al. 1999), which are spatially compact () and may be due to outflow emission similar to that seen from L1014-IRS.
2 Observations
L1521F was observed by the Spitzer Space Telescope on 2004 September 7 and 9 with the Infrared Array Camera (IRAC; AORKEYs 5075712 (catalog ADS/Sa.Spitzer#0005075712) and 5076224), and September 24 and 25 with the Multiband Imaging Photometer (MIPS; AORKEYs 9419776 and 9431040) as part of the c2d Legacy program (Evans et al. 2003). The observations at two closely separated epochs allow for asteroid identification. The field-of-view covered by the IRAC observations was at P.A. . At each position four dithers of 12 s each were taken, resulting in a 48 s exposure time for most of the area mapped. With MIPS at 24 m a field of at P.A. was observed with a total exposure time of 48 s, and at 70 m a field of at P.A. with a total exposure time of 126 s was observed. The map center for the two epochs of MIPS observations was shifted to allow for uniform map coverage at 70 m as half of the array is not usable. The data were processed by the Spitzer Science Center using their standard pipeline (version S11) to produce Basic Calibrated Data images. The c2d team further processed the images to improve their quality (correcting “bad” pixels and other array artifacts), and performed photometry on extracted sources. Details of the processing, source extraction and photometry by the c2d team can be found elsewhere (Young et al. 2005; Harvey et al. 2006).
3 Results
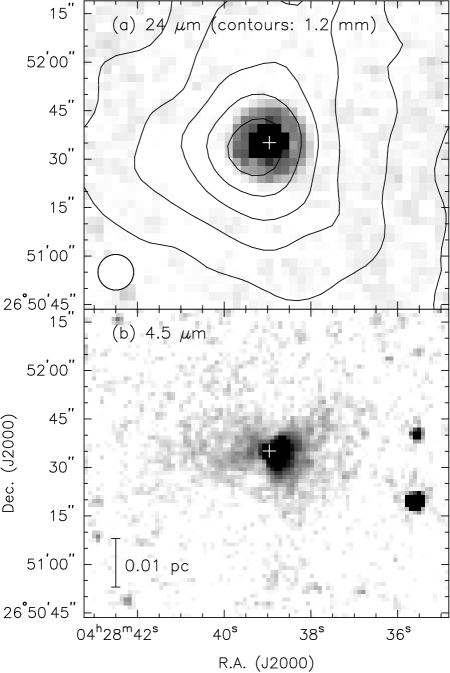
The Spitzer images of L1521F are presented in Figs. 1 and 2. Figure 1 shows the 24 µm and 4.5 µm images of the central region of L1521F. At 24 µm (and 70 µm) a point source is seen located at the dust emission peak, but it is not clearly detected above the nebular emission at shorter wavelengths ( 5 µm). The cross in Fig. 1 locates the mean position of this source, SSTc2d J042838.95+265135.1 (J2000 HHMMSS.ss+DDMMSS.s), from PSF fitting at the wavelengths at which it was detected. Hereafter we call this source L1521F-IRS. At 4.5 µm L1521F-IRS lies at the apex of a bright but compact conical shaped nebula, which opens to the west. A similar but fainter nebula is also seen opening to the east with L1521-IRS at its apex. This nebula is similar in appearance to bipolar scattered light nebulae seen around young low mass stars and also the low luminosity protostar L1014-IRS (Huard et al. 2006).
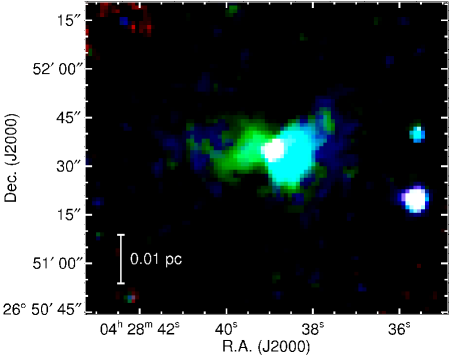
Figure 2 shows a three color image with the 3.6 µm, 4.5 µm, and 8.0 µm bands represented by blue, green and red channels, respectively. Emission from all three bands is evident near the position of L1521F-IRS (as indicated by the white emission), but the extended emission is most evident at the shorter wavelengths (3.6-4.5 µm). To the west of L1521F-IRS the emission is due to both 3.6 and 4.5 µm emission (blue-green), while in the east is it mostly due to 4.5 µm emission (green).
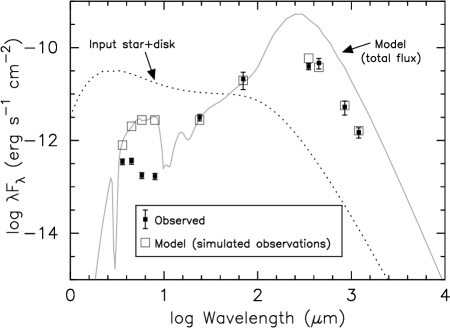
The spectral energy distribution (SED) of L1521F is shown in Figure 3, and the flux densities are given in Table 1. The measured data points are shown as filled squares with error bars. The 3.6 and 4.5 µm points are mostly due to scattered light and so do not accurately represent the true source flux. The data points at 5.8 and 8.0 µm also have a contribution due to scattered light, but the point-like emission from L1521F-IRS is clearly seen on the images and its flux dominates the emission. The spectral index between 2 and 24 µm is estimated to be 1.6, from a linear fit to the available data points. Although this fit is poor (), the SED is clearly rising to 24 µm and L1521F-IRS is embedded, and is consistent with a Class 0/I object.
4 Modeling
The internal luminosity is a crucial property of the central source, but cannot be obtained by simply integrating the spectrum because the substantial contribution from the interstellar radiation field (ISRF) must be separated out. For this purpose a 1-D radiative transfer model is sufficient because the envelope can be modeled as spherically symmetric even though the disk and outflow cannot. A detailed comparison of 1-D and 2-D models for this purpose has been undertaken by Dunham et al (2006), indicating that only small differences in the derived values of are expected. Consequently, we have modeled the data with the 1-D radiative transfer code DUSTY (Ivezić, Nenkova & Elitzur 1999), in order to attempt to place contraints on the luminosity of the central source (star+disk), and to serve as a guide for more detailed 2-D modeling in the future. A full explanation of the model parameters is given by Young & Evans (2005), and here we briefly describe the specifics of the model used for L1521F-IRS. A similar analysis was performed previously for L1014-IRS (Young et al. 2004) and more recently for IRAM 04191+1522 (Dunham et al. 2006).
The envelope is modeled using the analytic form of the density profile given by Tafalla et al. (2002), , where is the density, is the distance (radius) from the center, and , and are free parameters. Crapsi et al. (2004) fitted the 1.2 mm profile with cm-3, AU, and . The envelope is heated from the outside by the ISRF (adopting the Black-Draine model; see Evans et al. 2001), and internally by a protostar with a disk. Because the L1521F dense core is embedded within the Taurus molecular cloud, we attenuate the ISRF with . We assume “OH5” dust opacities which are appropriate for cold, dense cores (Ossenkopf & Henning 1994; Shirley et al. 2005). We use envelope inner and outer radii of 10 AU (= the disk outer radius) and 14,000 AU respectively. In order to fit the observed long wavelength (submillimeter) data points, a value of lower than that used by Crapsi et al. (2004) is needed, with cm-3. With this value we obtain an envelope mass of 4.8 (cf., 5.5 in Crapsi et al. (2004), who used a different value for the dust opacity).
The disk model follows the formula of Butner, Natta & Evans (1994), with surface density and temperature (Beckwith et al. 1990). The disk emission is integrated over all possible viewing angles (i.e., a “spherical” disk) to compute the emergent spectrum. It is difficult to separate the star+disk luminosities () in this model, so we treat them as a single entity, and we consider only the luminosity of the central source (). For the temperature of the star, , we tried values of 1500 and 3000 K, i.e., similar to values found for L and T dwarfs, and late M dwarfs. Our model does not included scattering, but the short wavelength emission, particular at 3.6 and 4.5 µm, is due mostly to scattered light. It is possible that L1521F-IRS is an almost edge-on disk, in which case the observed short wavelength fluxes would be lower limits. Our model is 1-D and is an average over all inclinations, so to allow for the edge-on possibility and obtain a strong upper limit to the luminosity, we simply require that the model fluxes are greater than the measured values in that wavelength range. This requirement rules out models with significantly lower or higher values of , as they bring the model fluxes uncomfortably close to the observed values.
Our best fit models for both 1500 K and 3000 K have . The best fit model for 1500 K is shown in Figure 3. These models provide reasonable matches to all wavelengths µm, within the constraint required for the short wavelength emission. At 1500 K the maximum allowed value for is , which matches the 70 µm flux within its uncertainty. The best fit for 3000 K is already close to the maximum allowed, due to the IRAC constraints – the maximum is . In summary, we find that a central source with a luminosity provides a reasonable fit to the data, with an upper limit of . Note that the bolometric luminosity is , so that most of the luminosity is modeled as being due to the ISRF heating the envelope (Evans et al. 2001). The short wavelength emission is not well fitted by this simple 1-D model, which is not surprising as it is due mainly to scattered light in the outflow cavity. A 2-D model is required to explain the scattered light images. However, the main result that the luminosity of L1521F-IRS is very low should remain unchanged in such a model (e.g., Dunham et al. 2006).
5 Discussion
With its low luminosity L1521F-IRS belongs to the newly identified group of very low luminosity objects, dubbed VeLLOs, i.e., objects with associated with dense cores (Kauffmann et al. 2005; Dunham et al. 2006). The prototype of this group is L1014-IRS with (Young et al. 2004). The previously known object IRAM 04191+1522 (hereafter, IRAM 04191; André, Motte & Bacmann 1999) has recently been shown to have a similar low luminosity, with (Dunham et al. 2006). Although all three sources have similar luminosities, there are a number of differences, such as their outflow properties, which may hint at differences in their current evolutionary status, their possible future evolution, or both. Although current evolutionary models of low mass objects at ages yr suggest that all three objects are proto-brown dwarfs, the models are uncertain and do not fully account for on-going accretion (e.g., Baraffe et al. 2002). Given that all three objects possess substantial envelopes of masses a few , their final mass could be either sub-stellar or stellar, depending on their future accretion.
The outflow properties of these three objects deserve comparison. IRAM 04191 has an extended molecular outflow which appears to be similar to outflows from more luminous protostars (André et al. 1999; Dunham et al. 2006), while the very compact L1014-IRS outflow is less massive and energetic than expected for its protostellar luminosity (Bourke et al. 2005). These results imply that the time-averaged accretion rate of IRAM 04191 ( yr-1; André et al. 1999) is about two orders of magnitude greater than that of L1014-IRS ( yr-1). For IRAM 04191 the inferred accretion luminosity is much greater than its internal luminosity, which may indicate the current accretion rate is much lower (Dunham et al. 2006).
Although no clear bipolar molecular outflow has been detected from L1521F-IRS, it shows a scattered light nebula which is similar in appearance to those seen around low mass stars with outflows, and strongly suggests that an outflow is present. The lack of a clear outflow detection implies that like L1014-IRS the outflow is likely to be weak and compact, and that the accretion rate is low. As discussed by Dunham et al. (2006), the low accretion rate for L1014-IRS may hint that it is near to the end of its main accretion phase and will remain substellar. This could also be the case for L1521F-IRS. Alternatively, the present low accretion rate of all three objects might instead indicate that they are in a quiescent phase between episodic outbursts.
L1521F-IRS seems to be intermediate between IRAM 04191 and L1014-IRS. The L1521F core is bright in molecular lines and submillimeter dust emission, and shows infall, depletion, and deuteration, (Crapsi et al. 2004), all properties seen in IRAM 04191. However, its outflow is likely to be more similar to the L1014-IRS outflow, and although the submillimeter core is bright, it is not as centrally peaked as other protostellar cores, and has been well fitted with a Bonner-Ebert-like sphere typical of starless cores rather than a power-law typical of protostellar cores (Crapsi et al. 2004).
As noted in §1, prior to Spitzer L1521F was one of the two best examples of an evolved starless core, the other being the well studied core L1544 (Tafalla et al. 1998; Caselli et al. 2002; Crapsi et al. 2005a). Inspection of the Spitzer data for L1544 does not reveal any protostellar candidate, i.e., L1544 is still a prestellar core. A similar result is found for the other evolved starless cores identified by Crapsi et al. (2005). The similarity between the L1521F and L1544 cores suggest that L1521F-IRS has not yet had a strong influence on its parental core, and that L1544 is indeed close to forming a protostar.
6 Summary & Conclusions
With the Spitzer Space Telescope we have discovered a low luminosity object L1521F-IRS (, with an upper limit of ) within the “evolved starless core” L1521F in Taurus. At short wavelengths ( 5 µm) a well defined bipolar scattered light nebula is seen, suggesting the presence of a molecular outflow like those observed from low mass protostars. L1521F-IRS is located at the density peak of the core, and its luminosity is similar to other low luminosity objects IRAM 04191+1522 and L1014-IRS. It is unclear at present whether L1521F-IRS will evolve to form a low mass star or a brown dwarf.
These results do not support the idea that core properties correlate with features of early stellar evolution. Some cores, including L1544, have hallmarks of high density, including freeze-out chemistry, but harbor no embedded sources, while similar cores do have internal sources, such as L1521F. Other cores, including L1014, have modest densities yet harbor VeLLOs. Still other cores, such as L1521F and IRAM 04191, have similar gas properties and objects of similar luminosity, but their embedded sources have very different mass outflow rates. It is not clear where VeLLOs fit within the current paradigm of low mass star formation, and it is difficult to imagine a single evolutionary scenario which can explain them all. The picture may become clearer once a large enough sample of these objects has been studied.
References
- André et al. (1999) André, P., Motte, F., & Bacmann, A. 1999, ApJ, 513, L57
- Baraffe et al. (2002) Baraffe, I., Chabrier, G., Allard, F., & Hauschildt, P. H. 2002, A&A, 382, 563
- Beckwith et al. (1990) Beckwith, S. V. W., Sargent, A. I., Chini, R. S., & Guesten, R. 1990, AJ, 99, 924
- Bourke et al. (2005) Bourke, T. L., Crapsi, A., Myers, P. C., Evans, N. J., Wilner, D. J., Huard, T. L., Jorgensen, J. K., & Young, C. H. 2005, ApJ, 633, L129
- Butner et al. (1994) Butner, H. M., Natta, A., & Evans, N. J. 1994, ApJ, 420, 326
- Caselli et al. (2002) Caselli, P., Walmsley, C. M., Zucconi, A., Tafalla, M., Dore, L., & Myers, P. C. 2002, ApJ, 565, 331
- Codella et al. (1997) Codella, C., Welser, R., Henkel, C., Benson, P. J., & Myers, P. C. 1997, A&A, 324, 203
- Crapsi et al. (2004) Crapsi, A., Caselli, P., Walmsley, C. M., Tafalla, M., Lee, C. W., Bourke, T. L., & Myers, P. C. 2004, A&A, 420, 957
- Crapsi et al. (2005) Crapsi, A., Caselli, P., Walmsley, C. M., Myers, P. C., Tafalla, M., Lee, C. W., & Bourke, T. L. 2005a, ApJ, 619, 379
- Crapsi et al. (2005) Crapsi, A., et al. 2005b, A&A, 439, 1023
- Dunham et al. (2006) Dunham, M. M., et al., 2006, submitted to ApJ
- Evans et al. (2001) Evans, N. J., II, Rawlings, J. M. C., Shirley, Y. L., & Mundy, L. G. 2001, ApJ, 557, 193
- Evans et al. (2003) Evans, N. J., II, et al. 2003, PASP, 115, 965
- Harvey et al. (2006) Harvey, P. M., et al. 2006, ApJ, 644, 307
- Huard et al. (2006) Huard, T. L., et al. 2006, ApJ, 640, 391
- Ivezić et al. (1999) Ivezić, Z., Nenkova, M. & Elitzur, M., 1999, User Manual for DUSTY, accessible at http://www.pa.uky.edu/moshe/dusty
- Kauffmann et al. (2005) Kauffmann, J., Bertoldi, F., Evans, N. J., & the c2d Collaboration 2005, Astron. Nachr., 326, 878
- Kirk et al. (2005) Kirk, J. M., Ward-Thompson, D., & André, P. 2005, MNRAS, 360, 1506
- Lee & Myers (1999) Lee, C. W., & Myers, P. C. 1999, ApJS, 123, 233
- Lee et al. (2001) Lee, C. W., Myers, P. C., & Tafalla, M. 2001, ApJS, 136, 703
- Mizuno et al. (1994) Mizuno, A., Onishi, T., Hayashi, M., Ohashi, N., Sunada, K., Hasegawa, T., & Fukui, Y. 1994, Nature, 368, 719
- Myers et al. (1987) Myers, P. C., Fuller, G. A., Mathieu, R. D., Beichman, C. A., Benson, P. J., Schild, R. E., & Emerson, J. P. 1987, ApJ, 319, 340
- Onishi et al. (1999) Onishi, T., Mizuno, A., & Fukui, Y. 1999, PASJ, 51, 257
- Ossenkopf & Henning (1994) Ossenkopf, V., & Henning, T. 1994, A&A, 291, 943
- Shinnaga et al. (2004) Shinnaga, H., Ohashi, N., Lee, S.-W., & Moriarty-Schieven, G. H. 2004, ApJ, 601, 962
- Shirley et al. (2005) Shirley, Y. L., Nordhaus, M. K., Grcevich, J. M., Evans, N. J., Rawlings, J. M. C., & Tatematsu, K. 2005, ApJ, 632, 982
- Tafalla et al. (1998) Tafalla, M., Mardones, D., Myers, P. C., Caselli, P., Bachiller, R., & Benson, P. J. 1998, ApJ, 504, 900
- Tafalla et al. (2002) Tafalla, M., Myers, P. C., Caselli, P., Walmsley, C. M., & Comito, C. 2002, ApJ, 569, 815
- Young et al. (2004) Young, C. H., et al. 2004, ApJS, 154, 396
- Young & Evans (2005) Young, C. H., & Evans, N. J. 2005, ApJ, 627, 293
- Young et al. (2005) Young, K. E., et al. 2005, ApJ, 628, 283
| Wavelength | Flux Density | Aperture | |
|---|---|---|---|
| (µm) | (mJy) | (mJy) | (arcsec) |
| 3.6 | 0.42 | 0.06 | 1.7aaFWHM of the Spitzer point spread profile. |
| 4.5 | 0.54 | 0.08 | 1.7aaFWHM of the Spitzer point spread profile. |
| 5.8 | 0.34 | 0.05 | 1.9aaFWHM of the Spitzer point spread profile. |
| 8.0 | 0.45 | 0.07 | 2.0aaFWHM of the Spitzer point spread profile. |
| 24 | 25.0 | 4 | 5.7aaFWHM of the Spitzer point spread profile. |
| 70 | 490 | 200 | 17aaFWHM of the Spitzer point spread profile. |
| 350 | 4600 | 700 | 40 |
| 450 | 7000 | 1800 | 40 |
| 850 | 1500 | 500 | 40 |
| 1200 | 600 | 150 | 40 |
Note. — (1) The listed uncertainties include the statistical measurement errors and uncertainties in the absolute calibration. (2) The (sub)mm points were obtained with the bolometer array cameras SHARCII (350 µm – J. Wu et al. in prep.), SCUBA (850 µm – C. Young et al. in prep.; 450 µm– Kirk, Ward-Thompson & André 2005; J. Kirk, private communication) and MAMBO (1200 µm – Crapsi et al. 2004; J. Kauffmann et al. in prep.).