Dwarf galaxies in Hickson Compact Groups
Abstract
We observed 5 Hickson Compact Groups with the ESO/MPI 2.2m telescope and WFI to investigate the dwarf galaxy content and distribution in these galaxy groups. Our deep imaging and careful selection of the candidate galaxies revealed a rich population of mainly passively evolving dwarf galaxies, which is spatially much more extended than the originally defined Hickson Compact groups. The composite luminosity function of the 5 groups shows a bimodal structure with a very steep rise in the low luminosity regime. The faint end slope is close to the predictions of CDM theory for the slope of the Dark Matter halo mass function.
1 Dwarf galaxies in compact groups
Hickson Compact Groups (HGCs) are tight groups of galaxies selected by Hickson on POSS-I plates based galaxy density and isolation criteria as described e.g. in Hickson1997 . Analysing the environments of HGCs it soon becomes clear, that the cores Hickson classified are often not isolated, but embedded into larger structures. As an example we found in HGC 16 an spiral galaxy with the same redshift, which is located just outside the radius defined in Hickson’s isolation criterium.
Searches for dwarf galaxies in HGCs which were conducted up to now were either deep, but limited to the area of the compact group itself (e.g. Hunsberger1996 ) or wide field, but rather shallow (e.g. Ribeiro1994 ; Zabludoff2000 . We used this as a starting point to investigate the dwarf galaxy content of HGCs and to map out the structure of HGCs and their envelopes.
2 Observations and sample selection
We observed nearby HGCs (distance Mpc) using the ESO/MPI 2.2m telescope at La Silla with its wide field of view (0.57 by 0.54 deg), high sensitivity, good spatial sampling (0.24 arcsec per pixel), and generally good seeing conditions. Especially important is the good sampling and resolution, which allows us to select dwarf galaxy candidates belonging to the HGCs against the background of more distant large galaxies. We observed HGC 16, 19, 30, 31, and 42 in B and R band, under seeing conditions between 0.8 and 1 arcsec.
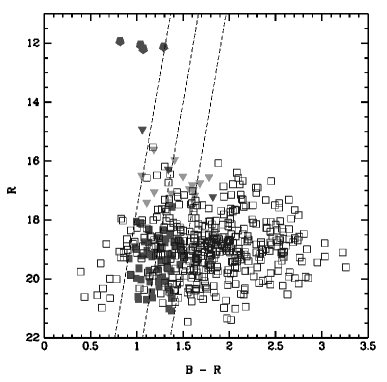
The data were reduced using IRAF/mscred and some routines developed at Bochum. The final images allowed us to search for galaxies as faint as M in all observed compact groups. Object detection was done using SExtractor, and we set a lower size limit consistent with the size of the smalles Local Group dwarf galaxy shifted to the distances of the observed HGCs. This first selection gave 200-500 dwarf galaxy candidates per field. We constructed color-magnitude diagrams (CMDs) for our fields and used all available sources for spectroscopic redshifts. An example of the resulting CMDs is given in Fig.1. We find very few blue dwarf galaxy candidates, while the region of the red sequence Secker1997 is very well populated. These galaxies are therefore candidate dE/dSph galaxies belonging to the HGCs. With the good seeing and well sampled images, we can further test this assumption similar to Conselice2002 by classifying all galaxy by eye (select for low surface brightness, irregular shape, no spiral arms, and no bulge/disk structure). We also analysed the light profiles with surface photometry package in IRAF/STSDAS for exponential profiles.
3 Dwarf galaxies in compact groups
The galaxies which passed the selection process described above showed a clear concentration towards the HGCs centers, which reassured, that we generated samples of high probability dwarf galaxy members of the HGCs. The spatial extend of these dwarf galaxy population varied from group to group, but did not reach the typical background level at a radius of 200 kpc (limited by the size of our WFI fields) for at least HGC 16, 30, and 42.
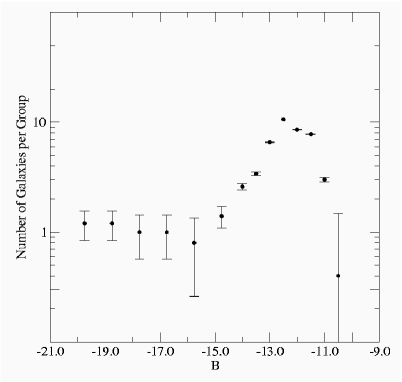
With the assumption of membership for all our final selection dwarf galaxy candidates, we generate a composite luminosity function (LF) by converting all measurements to a common distance. Given the relatively small differences in the distance of our target groups this will not induce a large spread in observed properties. The resulting LF is plotted in Fig.2.
The small number statistics at the bright end precludes an analysis of this part and also a formal fit to the whole LF. What is still obvious from the diagram is the steep rise in the dwarf galaxy regime (M mag) and that the whole LF is not consistent with a single Schechter function Schechter1976 , but implies a bimodal LF. The observed decline at luminosities fainter than M mag is most probably due to the completeness limit of our data.
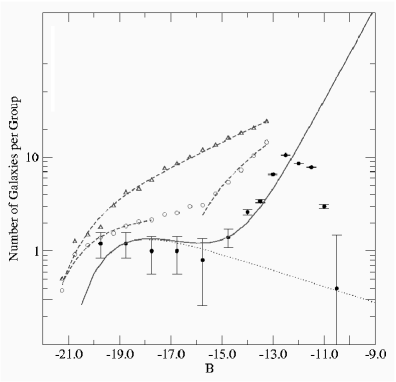
Similar bimodal LFs were recently presented by Miles2004 for X-ray dim groups and are present in the LF of passively evolving field galaxies from the 2dFRS Madgwick2002 . Especially the LF derived by Madgwick2002 provides a good agreement for the luminosity of the break in our observed LF of HGCs and the extrapolated faint end slope a decent description of our data, as shown in Fig.3.
Our data therefore imply a large population of passively evolving dwarf galaxies in HGCs. Such a steep faint end slope dominated by dE/dSph galaxies was up to now only found in galaxy clusters, e.g. Trentham2005 . In galaxy groups, dE/dSph are generally only found orbiting massive galaxies. Actually, the numbers in the Local Group dwarf galaxies seems to be very low compared to the predictions from CDM theory (the substructure crisis Klypin1999 ; Moore1999 ). In the general field, dSph are exceedingly rare or even absent. Just recently one object was detected which may be the best case yet for a field dSph Pasquali2005 . The steep faint end of the LF we observe in HCGs is hard to understand, since the conditions in HGCs are cluster-like only in the very dense cores of HGCs, and not in the outer envelopes where we find most of the dwarf galaxies. Here the galaxy densities resemble more those of loose groups.
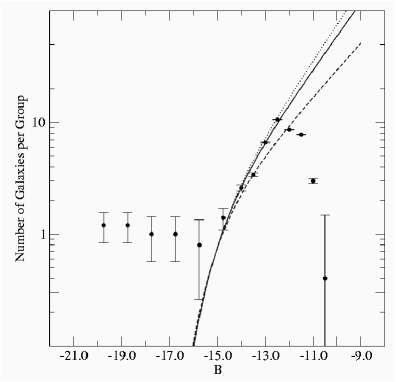
The faint end slope of our observed LF is very steep and may add a new aspect to the ongoing discussion on the formation, evolution, and survival of dwarf galaxies. The measured LF slope of our HGCs () is strikingly similar to the slope of the mass function of dark matter halos, see Fig.4. This would imply that in compact galaxy groups most DM halos would have been populated with baryons, in contradiction the results for the Local Group, where an overabundance of DM halos without baryons seems to be present.
We recently got the first VIMOS spectroscopy of the dwarf candidates in two of our HCGs, providing redshifts of a large number of the dwarfs. This will also allow us to study the dynamics of the dwarf galaxy population and the internal properties of the confirmed dwarf members.
References
- (1) Conselice, C. J. (2002). ApJL, 573, L5–L8.
- (2) Hickson, P. (1997). ARA&A, 35, 357–388.
- (3) Hunsberger, S. D., Charlton, J. C., and Zaritsky, D. (1996). ApJ, 462, 50
- (4) Klypin, A. et al., (1999). ApJ, 522, 82–92.
- (5) Madgwick, D. S. et 26 alii, (2002). MNRAS, 333, 133–144.
- (6) Miles, T. A. et al., MNRAS, 355, 785–793.
- (7) Moore, B. et al., (1999). ApJL, 524, L19–L22.
- (8) Pasquali, A. et al., (2005). AJ, 129, 148–159.
- (9) Ribeiro, A. L. B., de Carvalho, R. R., and Zepf, S. E. (1994). MNRAS, 267, L13–L16.
- (10) Schechter, P. (1976). ApJ, 203, 297–306.
- (11) Secker, J. and Harris, W. E. (1997). PASP, 109, 1364–1376.
- (12) Trentham, N., Sampson, L., and Banerji, M. (2005). MNRAS, 357, 783–792.
- (13) Zabludoff, A. I. and Mulchaey, J. S. (2000). ApJ, 539, 136–148.