COSMIC RAYS AT THE HIGHEST ENERGIES
– FIRST DATA FROM THE PIERRE AUGER OBSERVATORY –
Abstract
The southern Pierre Auger Observatory, presently under construction in Malargüe, Argentina, is nearing completion. The instrument is designed to measure extensive air-showers with energies ranging from - eV and beyond. It combines two complementary observation techniques; the detection of particles at ground and the coincident observation of associated fluorescence light generated in the atmosphere above the ground. This is being realized by employing an array of 1600 water Cherenkov detectors, distributed over an area of 3000 km2, and operating 24 wide-angle Schmidt telescopes, positioned at four sites at the border of the ground array. The Observatory will reach its full size only in 2007 but data are routinely recorded already and have started to provide relevant science results. This talk will focus on the detector characterizations and presents first results on the arrival direction of extremely-high energy cosmic rays, their energy spectrum, and on the upper limit of the photon fraction.
1 Introduction
Over the past decade, interest in the nature and origin of extremely high energy cosmic rays (EHECR) has grown enormously. Of particular interest are cosmic rays (CR) with energies eV. There is a twofold motivation for studying this energy regime, one coming from particle physics because CRs give access to elementary interactions at energies much higher than man-made accelerators can reach, and another coming from astrophysics, because we do not know what kind of particles they are and where and how they acquire such enormous energies. An excellent review, published by Michael Hillas 20 years ago, presented the basic requirements for particle acceleration to energies eV by astrophysical objects.[1] The requirements are not easily met, which has stimulated the production of a large number of creative papers.
The problem is aggravated even more by the fact that at these energies protons and nuclei should interact with the Cosmic Microwave Background (CMB). Above a threshold energy of eV protons lose their energy over relatively short cosmological distances via photo-pion production or . Accidentally, nuclei (He, …Fe) lose their energy at similar threshold energies and on even shorter length scales. This is because of photodissociation (e.g. ) taking place mostly via giant nuclear resonances. Finally, photons interact even more rapidly in the CMB by producing -pairs. Thus, particles that have traveled over distances of 50 or 100 Mpc are unlikely to retain an energy of eV or more when they reach us. This was already recognized in the 1960’s shortly after the discovery of the CMB and is called the Greisen-Zatsepin-Kuzmin (GZK) cutoff.[2] Thus, not only do we not know how particles could obtain such extreme energies even in the most powerful astrophysical accelerators, these accelerators have to be located nearby on cosmological scales!
To solve this most pressing puzzle of high energy astroparticle physics, one either needs to invent nearby exotic EHECR sources or find ways of evading the GZK effect. Top-Down models with decaying topological defects or decaying superheavy relic particles are typical representatives of the former group, as EHECRs would be produced nearby. Typical representatives of the latter kind are violation of the Lorentz invariance, propagation of heavy supersymmetric particles, or the -burst model. A comprehensive review, with emphasis placed on top-down models, is given by Ref. [3]. Generally, the top-down models predict a dominance of photons and neutrinos over protons or nuclei, so that measurements of the chemical composition become important also at the highest energies. Furthermore, the -burst model cannot avoid producing a strong background of GeV energy photons leading to severe constrains due to the measured EGRET fluxes.[4] Such complications have recently given more emphasis again to astrophysical sources.
While the large magnetic rigidity of eV protons gives rise to the problems of particle acceleration in astrophysical sources, it opens at the same time a new window for astronomy with CRs. Since such particles cannot deviate much in the magnetic fields of the Galaxy and extragalactic space, they should point to their sources within a few degrees deviation only. For example, using nominal guesses of 1 nG for the magnetic field strength of extragalactic space and 1 Mpc for the coherence length, deviations for protons on the order of are expected after travelling 50 Mpc.[5]
Two types of experiments based on very different techniques have undoubtedly detected particles well exceeding the GZK cut-off.[6, 7, 8] Unfortunately, despite 40 years of data taking the number of events is still small. Also, the largest experiments so far disagree at an approx. level on the flux and on arrival direction correlations. The HiRes collaboration, employing the fluorescence technique, reported a suppression of the flux above the GZK-threshold, with no evidence for clustering in the arrival directions.[8, 9] On the other hand, ground arrays have detected no GZK-cutoff.[6, 7] Furthermore, the the AGASA collaboration published results about seeing a clustering of the highest energy events [7] which, however, is not free of dispute.[10] Clearly, the situation is very puzzling, and a larger sample of high quality data is needed for the field to advance.
2 The Pierre Auger Observatory
Already years before the present controversy between different experiments started, it was clear that not only a much larger experiment was needed to improve the statistics of EHECRs on reasonable time scales but also that two or more complementary experimental approaches had to be combined on a shower-by-shower basis within one experiment. Such redundancy allows cross-correlations between experimental techniques, thereby controlling the systematic uncertainties. Furthermore, one expects to improve the resolution of the energy, mass, and direction of reconstructed primary particles. In the Pierre Auger Observatory, this so-called ‘hybrid’ aspect is realized by combining a ground array of water Cherenkov detectors with a set of fluorescence telescopes. Another important objective was to obtain a uniform exposure over the full sky. This will be achieved by constructing two instruments, each located at mid-latitudes in the southern and northern hemispheres. Each site is conceived to cover an area of 3000 km2 in order to collect about one event per week and site above eV, depending on the extrapolation of the flux above the GZK threshold.
The ground array will comprise 1600 cylindrical water Cherenkov tanks of 10 m2 surface area and 1.2 m height working autonomously by solar power and communicating the fully digitized data by radio links. The tanks are arranged on a hexagonal grid with a spacing of 1.5 km yielding full efficiency for extensive air shower (EAS) detection above eV. Presently, about 1000 tanks are in operation and taking data.
Charged particles propagating through the atmosphere excite nitrogen molecules causing the emission of (mostly) ultraviolet light. The fluorescence yield is very low, approx. four photons per meter of electron track (see e.g. [11]), but can be measured with large area imaging telescopes during clear new- to half-moon nights (duty cycle of 10-15 %). The fluorescence detector of the southern site will comprise 24 telescopes arranged into four ‘eyes’ located at the perimeter of the ground array. Each eye houses six Schmidt telescopes with a field of view (f.o.v.). Thus, the 6 telescopes of an eye provide a view towards the array center and they look upwards from to above the horizon. Presently, 18 telescopes are in operation and taking data.
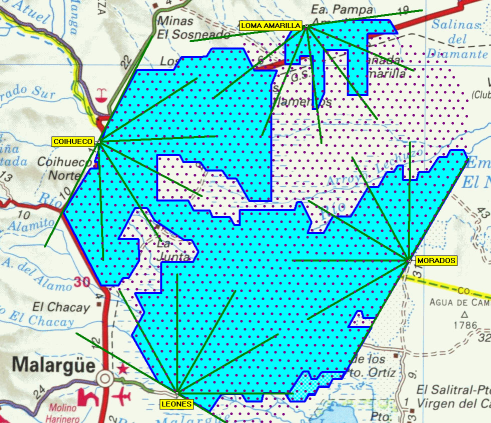
The layout of the southern site and its current status is depicted in figure 1. It shows the locations of telescopes and water tanks already in operation. Further details about the experiment and its performance can be found in Refs. [12, 13]. Nearing completion of the Southern Site, the collaboration has selected southeast Colorado to site the northern detector and started to perform related R&D work.
3 Anisotropies near the direction of the Galactic Center
The Galactic Center (GC) region constitutes an attractive target for CR anisotropy studies at EeV ( eV) energies. These may be the highest energies for which the galactic component of the cosmic rays is still dominant. Moreover, since the GC harbors a very massive black hole associated with the radio source Sagittarius A∗, as well as the expanding supernova remnant Sagittarius A East, it contains objects that might be candidates for powerful CR accelerators. The location of the Pierre Auger Observatory in the southern hemisphere makes it particularly suitable for anisotropy studies in this region since the GC, passing only from the zenith at the site, lies well within the field of view of the experiment. The number of CRs of EeV energies accumulated so far at the Pierre Auger Observatory from this part of the sky greatly exceeds that from previous experiments, allowing several interesting searches to be made.
As mentioned above, the Akeno Giant Air Shower Array (AGASA) experiment reported a 4.5 excess of CRs with energies in the range - eV in a radius region centered at right ascension and declination coordinates .[14, 15] The number of observed and expected events are , where the error quoted is the one associated with Poisson background fluctuations. Note that the GC itself, for which we will adopt hereafter the Sagittarius A∗ J2000.0 coordinates, , lies outside the AGASA field of view (). A subsequent reanalysis of SUGAR data failed to confirm these findings, but reported a 2.9 excess flux of CRs with energies in the range – eV in a region of radius centered at , for which they obtained .[16]
In order to verify these findings, the arrival directions measured by the Pierre Auger Observatory data have been analyzed. We consider the events from the surface detector array with three or more tanks triggered in a compact configuration. The events have to satisfy quality cuts, requiring that the detector with the highest signal be surrounded by a hexagon of working detectors. This ensures that the event is well reconstructed. We also restrict the events to zenith angles .
The energies are obtained using the inferred signal size at 1000 m from the reconstructed shower core, , adopting a conversion that leads to a constant flux in different sky directions above 3 EeV, where the acceptance is saturated. This is the so-called ‘Constant Intensity Cut’ criterion implemented in [17]. A calibration of the energies is performed using clean fluorescence data, i.e. hybrid events that were recorded when there were contemporaneous aerosol measurements, whose longitudinal profiles include the shower maximum in a measured range of at least 350 g cm-2 and in which there is less than 10% Cherenkov contamination. The estimated systematic uncertainty in the reconstructed shower energy with the fluorescence technique is currently 25%.[18] In this energy range 48% of the events involve just three tanks, 34% involve 4 tanks and only 18% more than 4 tanks. For three tank events the 68% quantile angular resolution is about and the resolution improves for events with 4 tanks or more.[19]
After applying all quality cuts, about 80,000 events remained to be analyzed in the energy range eV. To study the possible presence of anisotropies, background expectations for different sky directions were calculated under the assumption of an isotropic CR distribution. This was performed by applying both a semi-analytic and a shuffling technique. Both methods were found to agree within 0.5 %, i.e. within their statistical fluctuations. Figure 2 shows the resulting map of the GC region in terms of the so called Li-Ma significances [20] of overdensities in circular windows of radius and for the aforementioned energy range. This angular scale is convenient to visualize the distribution of overdensities in the windows explored by SUGAR and AGASA. The galactic plane is represented by a solid line and the location of the Galactic Center is indicated by a cross. The region in which AGASA reported an excess (in a slightly narrower energy range) is the big circle in the neighborhood of the GC, with the dashed line indicating the lower boundary of the region observed by AGASA. The smaller circle indicates the region where an excess in the SUGAR data was reported.
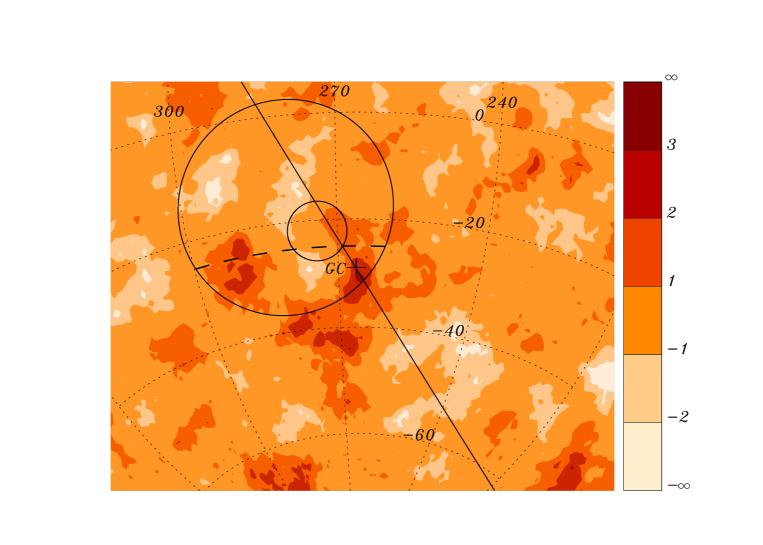
The size of the overdensities present in this map is consistent with what would be expected as a result of statistical fluctuations of an isotropic sky. Indeed, inspecting the distribution of these overdensities together with the expectations from an isotropic flux (average and bounds obtained from Monte Carlo simulations), does not show any significant departure from isotropy. For the circle centered at the AGASA location and for eV, 2116 events are observed while 2159.6 are expected using the semi-analytic technique, while 2169.7 are expected using the shuffling technique. Note that the number of events is more than four times that collected by AGASA in this region, in part due to the fact that the GC lies well within the field of view of Auger, and in part due to the fact that the total exposure of Auger is already double that achieved by AGASA. The largest source of systematic uncertainties when comparing the AGASA and Auger excess maps may be given by the uncertainties of their energy scales. To test the effect of this, the Auger energy scale was shifted by and the anisotropy analysis repeated. Independent of such shifts, the excess is always compatible with zero.
Regarding the localized excess observed in SUGAR data, we find in the same angular window and energy range. Hence, with more than an order of magnitude larger statistics no significant excess is seen in this window. Shifting the energy range to account for possible offsets again resulted in no significant excess.
To complete the analysis of the GC region, we have also searched for a point like source located in the position of Sagittarius A∗. For a Gaussian window corresponding to the angular resolution of the experiment we get . This corresponds to a ratio of , where the estimate of the uncertainty takes into account that the window is Gaussian. Assuming a CR flux of we can then calculate the 95 % confidence limits (CL) for the upper bound on the number of events from the source to be . This upper limit is more than an order of magnitude below predictions made for neutron fluxes from the GC [22, 23] and is at the level of the prediction made in Ref. [24].
4 Upper limit of the photon fraction
As mentioned above, photon primaries are expected to dominate over nucleon primaries in non-acceleration (“top-down”) models of EHECR origin.[3] Thus, the determination of the photon contribution is a crucial probe of cosmic-ray source models. Separating photon-induced showers from events initiated by nuclear primaries is experimentally much easier than distinguishing light and heavy nuclear primaries. As an example, average depths of shower maxima at 10 EeV primary energy are predicted to be about 1000 g cm-2, 800 g cm-2, and 700 g cm-2 for primary photons, protons, and iron nuclei, respectively. Moreover, analyses of nuclear composition are uncertain due to our poor knowledge of hadronic interactions at very high energies. Photon showers, being driven mostly by electromagnetic interactions, are less affected by such uncertainties and can be modelled with greater confidence.
So far limits on the UHE photon fraction in cosmic rays have been set by ground arrays only. By comparing the rates of near-vertical showers to inclined ones recorded by the Haverah Park shower detector, upper limits (95% CL) of 48% above 10 EeV and 50% above 40 EeV were deduced.[25] Based on an analysis of muons in air showers observed by AGASA, the upper limits (95% CL) to the photon fraction were estimated to be 28% above 10 EeV and 67% above 32 EeV.[26] An upper limit of 67% (95% CL) above 125 EeV was derived in a dedicated study of the highest energy AGASA events.[27]
The fluorescence telescopes of the Pierre Auger Observatory are ideal instruments for such an analysis, since they measure the position of the shower maximum as the discriminating observable directly. To achieve a high accuracy in reconstructing the shower geometry, we make use of the “hybrid” detection technique, i.e. we select events observed by both the ground array and the fluorescence telescopes.[13]
Compared to air showers initiated by nuclear primaries, photon showers at energies above 10 EeV are in general expected to have a larger depth of shower maximum and to contain fewer secondary muons. The latter is because the mean free paths for photo-nuclear interactions and direct muon pair production are more than two orders of magnitude larger than the radiation length. Consequently, only a small fraction of the primary energy in photon showers is generally transferred into secondary hadrons and muons. The large values for photon showers at 10 EeV are essentially due to the small multiplicity in electromagnetic interactions, in contrast to the large number of secondaries produced in inelastic interactions of high-energy hadrons. Secondly, because of the LPM effect[28], the development of photon showers is even further delayed above 10 EeV. Another feature of the LPM effect is an increase in shower fluctuations: fluctuations for photon showers are 80 g cm-2 at 10 EeV, compared to 60 g cm-2 and 20 g cm-2 for primary protons and iron nuclei, respectively. At higher energies, cosmic-ray photons may convert in the geomagnetic field and create a pre-shower before entering the atmosphere. The energy threshold for geomagnetic conversion is 50 EeV for the Auger southern site. Conversion probability and pre-shower features depend both on primary energy and arrival direction. In the case of a pre-shower, the subsequent air shower is initiated as a superposition of lower-energy secondary photons and electrons. For air showers from converted photons, the values and the fluctuations are considerably smaller than from single photons of same total energy. From the point of view of air shower development, the LPM effect and pre-shower formation compete with each other. The cascading of photons in the geomagnetic field is simulated with the PRESHOWER code [29] and the shower development in air, including the LPM effect [28], is calculated with CORSIKA [30]. For photo-nuclear processes, an extrapolation of the cross-section as given by the Particle Data Group has been employed.[31] QGSJET 01 has been used as a hadron event generator. [32]
The Auger data used in this analysis were taken with a total of 12 fluorescence telescopes situated a two sites and with the number of surface detector stations growing during this period from about 150 to 950. For the present analysis, we selected hybrid events, i.e. showers observed both with (one or more) surface tanks and telescopes. Even when only one tank is triggered, the reconstruction of the shower geometry and thereby of improves strongly.[13] The reconstruction of the shower profiles accounts for the time varying atmospheric density profiles, aerosol concentrations, and cloud coverage. After subtracting the Cherenkov light contribution, a Gaisser-Hillas function [33] is fitted to the profile to obtain the depth of shower maximum and the calorimetric shower energy is obtained by integration. The quality cuts applied for event selection and further details of this analysis are given in Ref.[34].
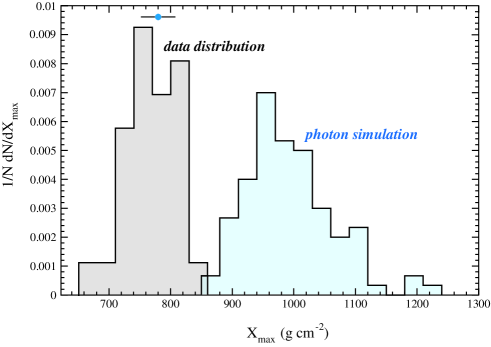
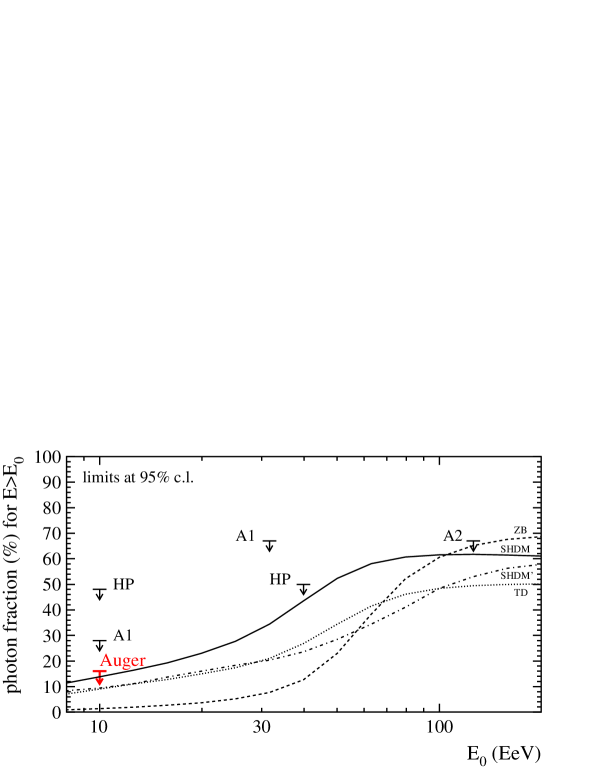
After applying the strong selection cuts to the data, 29 events with energies above 10 EeV remained for the analysis. The distribution of these events is displayed in Figure 3. The single point with error bar represents the value and its uncertainty of one typical data event. For each of such events, 100 photon induced showers were generated taking into account the arrival direction and energy of that data event. The resulting photon expectation for that single event is represented by the blue histogram. The present uncertainties are conservative estimates and are expected to decrease significantly in the future. The main contributions are the profile fit, the atmospheric conditions, and the shower geometry.[34] For all events, the observed is well below the average value expected for photons. Differences between photon predictions and data range from +2.0 to +3.8 standard deviations. Taking the available statistics, the individual differences between data and photon predictions, and the systematic uncertainties of data and simulations into account, an upper limit of the photon fraction of 16 % at 95 % CL is derived. This is plotted in Figure 4 together with previous experimental limits and some illustrative estimates for non-acceleration models. The derived limit is the first one based on observing the depth of shower maximum with the fluorescence technique. The result confirms and improves previous limits above 10 EeV that came from surface arrays. It is worth mentioning that this improved limit is achieved with only 29 events above 10 EeV, as compared to about 50 events in the Haverah Park analysis and about 120 events in the AGASA analysis. In the very near future and with increasing statistics, the limit can be reduced by at least a factor of three at 10 EeV and limits will be set also at higher energies constraining models significantly.
5 First estimate of the energy spectrum
A major goal of the Pierre Auger Observatory is to make a reliable measurement of the cosmic-ray energy spectrum above 10 EeV and to answer the question about the existence of the GZK cut-off. The large aperture of the Auger surface array will allow for the first time an observation of the CR spectrum in this energy range with good statistics. Moreover, the hybrid design will allow to resolve the discrepancy between previous spectrum measurements that were based on the different techniques.
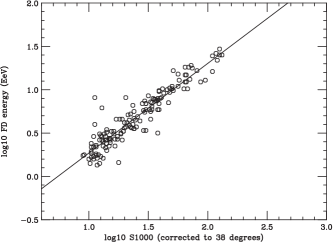
The Pierre Auger measurement profits from the hybrid technique of the ground array and fluorescence telescopes. The 100 % duty cycle of the ground array provides sufficient statistics, even though the analyzed data presented here (taken from 01/01/2004 through 06/05/2005) correspond to less than 4 months of the amount we anticipate, once the Auger South array will be completed. The exposure available for this analysis is 1750 km2 steradian years, slightly larger than that achieved by AGASA. The fluorescence information available for a subset of showers observed in hybrid mode allows to determine the absolute energy scale. The energy estimate of the ground array uses the signal size at a radius of 1000 m from the shower core ( “” ), which is determined from a fit to the lateral distribution of signal sizes from all the tanks triggered by an air shower. The “Constant Intensity Cut” method [17] is used to re-scale values from different shower inclinations. is almost linearly proportional to the energy of the primary particle. The conversion factor that relates to the energy is experimentally determined from the hybrid events by use of the very good energy reconstruction based on the fluorescence detector information. This reduces significantly the dependence on air shower models [37] and on assumptions of the UHECR composition, compared to previous surface array experiments.
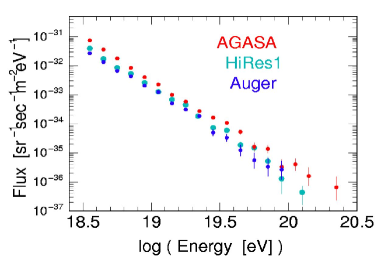
Figure 6 shows the correlation between and the energy determined from the fluorescence telescopes. Even though the data are still at a very preliminary stage and the reconstruction procedures are still to be improved, the correlation is very convincing. Figure 6 compares the obtained energy spectrum with those from AGASA and HiRes-I.[38, 39] Our data points contain around 3500 events above 3 EeV. Above this energy, the full geometrical area of the detector, defined by the layout of the water tanks, is sensitive so that determination of the flux of events is relatively straightforward. The general form is similar to the earlier experiments but, even allowing for the systematic uncertainties still present, it appears that at the highest energies significantly fewer events are seen than expected from the AGASA analysis. The claim of the HiRes team that the spectrum steepens at the highest energies can neither be confirmed nor denied with the present exposure. One event was recorded in April 2004 for which the fluorescence reconstruction gives an energy greater than 140 EeV, but the particle array was small at that date and the shower core fell outside of the fiducial area. Details of the spectrum will be greatly clarified with the data that have been accumulated since June 2005.
6 Summary and Outlook
The construction of the southern Pierre Auger Observatory is well underway. About 1000 stations of the surface array and 18 telescopes of the fluorescence detector are in operation and taking data routinely. Completion of the southern site is planned for 2007 and R&D work for the northern site to be located in south east Colorado has started.
Parallel to the completion of the observatory, first science results were already obtained on the energy spectrum, searches for localized anisotropies near the direction of the Galactic Center, and on setting upper limits on the photon fraction of the primary particles. Considering the very limited statistics from 1.5 years of data taking during construction, being equivalent of only 3 months of a full array, it is not surprising that the emergence of a clear picture about the shape of the energy spectrum above the GZK threshold needs a little more time. The 2.3 years of data used for the anisotropy searches in the Galactic Center region provides statistics much greater than those of previous experiments. No evidence for a point-like source in the direction of Sagittarius A∗ was found. This excludes several scenarios of neutron sources in the GC suggested recently. Our searches on larger angular windows in the neighborhood of the GC do not show abnormally over-dense regions. In particular, they do not support the large excesses reported in AGASA data (of 22% on scales) and SUGAR data (of 85% on scales). The upper limit to the photon fraction above 10 EeV derived from a direct observation of the shower maximum confirms and reduces previous limits from ground arrays. Again, the current analysis is limited mainly by the small number of events.
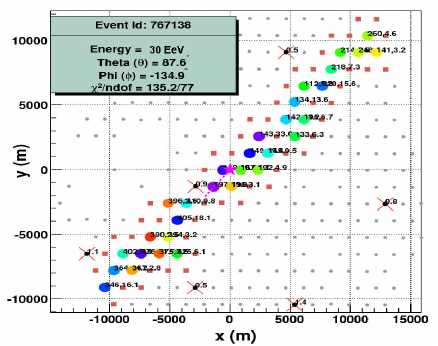
The number of hybrid events will considerably increase over the next years, allowing to set much stronger limits on the anisotropy and point source searches and on the photon limits. It will also reduce the uncertainties of the energy spectrum and will allow for further studies of EHECRs. For example, the Pierre Auger Collaboration is developing the study of inclined events, and showers with zenith angles above have been seen. This was expected as they had been detected long ago with much smaller arrays, but the richness of the new data is impressive. Figure 7 shows an event at about with 31 detectors, and even the present array is too small to contain it. A preliminary estimate of its energy is around 30 EeV. An understanding of these events will lead to additional aperture for collection of the highest-energy particles and also give additional routes to understanding the mass composition. Further, these events form the background against which a neutrino flux might be detectable. There is an exciting future ahead.
Acknowledgement: It is a pleasure to thank the organizers of the Symposium for their invitation to this Symposium. The work of the group at University Wuppertal is supported in part by the German Ministry for Research and Education (Grant 05 CU5PX1/6).
References
- [1] M. Hillas, Ann. Rev. Astron. Astrophys. 22 (1984) 425.
- [2] K. Greisen, Phys. Rev. Lett. 16 (1966) 748, and G.T. Zatsepin and V.A. Kuz’min, Sov. Phys. JETP Lett. (Engl. Transl.), 4 (1966) 78.
- [3] P. Bhattacharjee and G. Sigl Phys. Rep. 327 (2000) 109.
- [4] G. Sigl, Acta Phys. Polon. B35 (2004) 1845.
- [5] J.W. Cronin, Nucl. Phys. (Proc. Suppl.) B28 (1992) 1992.
- [6] M. Nagano and A.A. Watson, Rev. Mod. Phys. 72 (2000) 869.
- [7] M. Takeda et al. (AGASA-Collaboration), Astropart. Phys. 19 (2003) 135.
-
[8]
R.U. Abbasi et al. (HiRes-Collaboration), Phys. Rev. Lett.
92 (2004) 151101;
Astropart. Phys. 22 (2004) 139. - [9] R.U. Abbasi et al. (HiRes-Collaboration), Astrophys. J. 610 (2004) L73.
- [10] C.B. Finley and S. Westerhoff, Astropart. Phys. 21 (2004) 359.
- [11] F. Kakimoto et al., Nucl. Instr. Meth. A 372 (1996) 527.
- [12] J. Abraham et al. (Auger Collaboration), Nucl. Instr. Meth. A523 (2004) 50.
- [13] K.-H. Kampert et al. (Auger Collaboration), Nucl. Phys. B (Proc. Suppl.) 151 (2006) 393-400; astro-ph/0501074
- [14] N. Hayashida et al. (AGASA Collaboration), Astropart. Phys. 10 (1999) 303.
- [15] M. Teshima et al. (AGASA Collaboration) in Proceedings of the ICRC, Hamburg, 1 (2001) 337.
- [16] J.A. Bellido et al., Astropart. Phys. 15 (2001) 167.
- [17] The Pierre Auger Collaboration, in Proceedings of the ICRC, Pune, V7, p. 387.
- [18] The Pierre Auger Collaboration, in Proceedings of the ICRC, Pune, V7, p. 13.
- [19] The Pierre Auger Collaboration, in Proceedings of the ICRC, Pune, V7, p. 17.
- [20] T.-P. Li and Y.-Q. Ma, Astrophys. J 272 (1983) 317.
- [21] Pierre Auger Collaboration, subm. to Astropart. Phys. (2006); astro-ph/0607382
- [22] M. Bossa, S. Mollerach and E. Roulet, J. Phys. G: Nucl. Part. Phys. 29 (2003) 1409.
- [23] F. Aharonian and A. Neronov, Astrophys. J. 619 (2005) 306.
- [24] D. Grasso and L. Maccione, Astropart. Phys. 24 (2005) 273.
- [25] M. Ave et al., Phys. Rev. Lett. 85 (2000) 2244; Phys. Rev. D65 (2002) 063007.
- [26] K. Shinozaki et al., Astrophys. J. 571 (2002) L117.
- [27] M. Risse et al., Phys. Rev. Lett. 95 (2005) 171102.
- [28] L.D. Landau, I.Ya. Pomeranchuk, Dokl. Akad. Nauk SSSR 92 (1953) 535 & 735; A.B. Migdal, Phys. Rev. 103 (1956) 1811.
- [29] P. Homola et al., Comp. Phys. Comm. 173 (2005) 71.
- [30] D. Heck et al., Reports FZKA 6019 & 6097, Forschungszentrum Karlsruhe (1998).
- [31] S. Eidelmann et al., Particle Data Group, Phys. Lett. B592 (2004) 1.
- [32] N.N. Kalmykov, S.S. Ostapchenko, A.I. Pavlov, Nucl. Phys. B (Proc. Suppl.) 52B (1997) 17.
- [33] T.K. Gaisser, A.M. Hillas, Proc. 15th Intern. Cosmic Ray Conf., Plovdiv, 8, (1977) 353.
- [34] Pierre Auger Collaboration, subm. to Astropart. Phys. (2006); astro-ph/0606619
- [35] G. Gelmini, O.E. Kalashev, D.V. Semikoz, [arXiv:astro-ph/0506128].
- [36] J. Ellis, V. Mayes, D.V. Nanopoulos, [arXiv:astro-ph/0512303].
- [37] H.J. Drescher et al., Astropart. Phys. 21 (2004) 87.
- [38] M. Takeda et al. (AGASA Collab.), Astropart. Phys. 19 (2003) 447.
- [39] R.U. Abbasi et al. (HiRes Collab.), Phys. Lett. B619 (2005) 271.