Silicon Monoxide Observations Reveal a Cluster of Hidden Compact Outflows in the OMC1 South Region
Abstract
We present high angular resolution () SiO J=54; line observations of the OMC1S region in the Orion Nebula made using the Submillimeter Array (SMA). We detect for the first time a cluster of four compact bipolar and monopolar outflows that show high, moderate and low velocity gas and appear to be energized by millimeter and infrared sources associated with this region. The SiO molecular outflows are compact ( 3500 AU), and in most of the cases, they are located very close to their exciting sources. We thus propose that the SiO thermal emission is tracing the youngest and most highly excited parts of the outflows which cannot be detected by other molecules. Moreover, since the ambient cloud is weak in the SiO line emission, these observations can reveal flows that in other molecular transitions will be confused with the ambient velocity cloud emission. Analysis of their positional-velocity diagrams show that some components of these outflows may be driven by wide-angle winds very close to the exciting object. Finally, we find that some of these SiO outflows seem to be the base of powerful Herbig-Haro jets and large-scale molecular flows that emanate from a few arcseconds around this zone. In particular, we find a strongly excited SiO bipolar outflow with a P.A. of 100∘, that is likely energized by the luminous ( 3 103 L⊙) infrared protostar ”B” and could be the base of the remarkable object HH269.
1 Introduction
The OMC1S region (Orion Molecular Cloud 1 South) located about 1′ south-east of the Trapezium region, is one of the three most important zones of star formation (BN-KL, The Trapezium and OMC1S) in the Orion Nebula. This region indeed seems to be the youngest and most active zone of star formation in the nebula, showing extremely well collimated molecular outflows, and at least a half-dozen extended and powerful HH flows emanating from it (Schmid-Burgk et al. 1990, Bally, O’Dell & McCaughrean 2000, Rosado et al. 2001, O’Dell & Doi 2003, Zapata et al. 2005).
The OMC1S region was first identified as a star formation region through measurements of NH3 (J,K)= (1,1) and (2,2) lines (Ziurys et al. 1981) and through 400 m dust continuum images (Keene, Hildebrand & Whitcomb 1982). Later, NH3 line observations showed very high gas kinetic temperature ( 100 K), possibly due to the presence of strong outflows associated with the region (Batrla et al. 1983; Mauersberger et al. 1986; Ziurys, Wilson & Mauersberger 1990, Wiseman & Ho 1998). Many molecular lines have been detected toward the OMC1 South region: SiO, SO2, H13CO+, CH3OH, CH3CN, HC3N, 34CS, H2O (as maser emission), 12CO and 18CO (Batrla et al. 1983; Mundy et al. 1986; Ziurys, Wilson & Mauersberger 1990; Schmid-Burgk et al. 1990; McMullin et al. 1993, Gaume et al. 1998 and Rodríguez-Franco et al. 1999a). However, as all of the species were detected with single-dish observations of moderate angular resolution, their relation to the embedded sources was not clear.
In particular, the thermal emission of the SiO line has provided evidence for the strong outflow activity associated with this region. Ziurys, Wilson & Mauersberger (1990) found a low velocity (10 km s-1) and extended bipolar SiO(J=5-4; v=0) outflow with a length of 30′′ in the North(blueshifted)-South(redshifted) orientation, that is centered at the position R.A.[J2000]= and Dec.[J2000]= . McMullin et al. (1993) found strong thermal SiO(J=2-1; v=0) emission using the Berkeley-Illinois-Maryland Association (BIMA) interferometer. This thermal emission was more spatially confined to the west of OMC1S showing very broad ( 15 km s-1) wings, suggesting the presence of energetic outflow activity in the region.
The production of the silicon monoxide molecule (SiO) along outflows is mainly attributed to the destruction of the dust particles in strong shocks. In these violent shocks, the grain-grain collisions and thermal sputtering inject refractory elements (Si) into the gas phase, permitting a quick formation of SiO through reactions involving the OH molecule (Schilke et al. 1997; van Dishoeck and Blake 1998). Thus, the abundance of the SiO molecules can be enhanced by several orders of magnitude with respect to the quiescent ambient cloud values (e. g. Guilloteau et al. 1992).
Recent surveys of proper motions in the Orion Nebula (Bally et al. 2000; O’Dell & Doi 2003) revealed that at least six relatively large Herbig-Haro outflows (HH 202, HH 269, HH 529, HH 203/204, HH 530, and possibly HH 528) are originating from a region only a few arcseconds across in size located in OMC1S. O’Dell & Doi (2003) located this region at R.A.[J2000]=5:35:14.56, Dec.[J2000]=-5:23:54.0 with a positional error of 1.5′′, and they referred to it as the Optical Outflow Source (OOS). The relation of these half-dozen Herbig-Haro flows with the molecular outflows found toward OMC1S has remained uncertain due to the poor angular resolution of the molecular observations. Moreover, deflections of those optical flows by their parental molecular cloud can be another problem in the association of them with molecular flows or exciting objects. Some optical flows that have been reported in the literature to be deflected or bent are: HH 110 (Reipurth, Raga & Heathcote 1996), and HH34 (Eislöffel & Mundt 1997; Bally et al. 2006), as have the molecular outflows, NGC 2264G (Fich & Lada 1997), and NGC1333 IRAS 4A (Choi 2005). This mechanism has been successfully modeled by Raga and Cantó (1995) and Raga et al. (2002). Based on the HH 110 case, they modeled the collision of a supersonic, radiative jet with a dense cloud, and found that the spatial velocity difference observed between HH 270 and HH 110 agrees surprisingly well with the velocity decrease expected for a radiative jet/cloud collision at the deflected angle. Finally, the change in collimation from HH 270 to HH 110 also agrees well with the broadening of the post-collision jet predicted in the theoretical models.
In this paper, we present new sensitive and high angular resolution SiO J=54; SMA observations of the OMC1 South region that reveal a cluster of four hidden compact outflows that are present in this region, and which seem to be the base of some remarkable Herbig-Haro flows that also emanate from here. In 2 we describe our SiO observations. In 3 we report the results of the imaging in SiO thermal emission. Finally, a summary is given in 4.
2 Observations
The observations were made with the SMA111The Submillimeter Array (SMA) is a joint project between the Smithsonian Astrophysical Observatory and the Academia Sinica Institute of Astronomy and Astrophysics, and is funded by the Smithsonian Institution and the Academia Sinica. during 2004 October 29 in its ”compact” configuration with 6 antennas in the array. The phase reference center of the observations was R.A.[J2000] and Dec.[J2000]. The frequency was centered on the SiO(J=5-4 v=0) line at 217.104 GHz in the lower sideband, while the upper sideband was centered at 227.104 GHz. The SMA digital correlator was configured with a band of 128 channels over 104 MHz, which provided 0.8125 MHz (1.1 km s-1) resolution. The zenith opacity (), measured with the National Radio Astronomy Observatory (NRAO) tipping radiometer located at the Caltech Submillimeter Observatory (CSO), varied between 0.32 and 0.53. The system temperature also varied during the run between 350 and 750 K. The phase and amplitude calibrators were the quasars 0423-013 and 3C120 with measured flux densities of 1.80 0.02 Jy and 0.60 0.01 Jy, respectively. The uncertainty in the flux scale is estimated to be 20%, based on the SMA monitoring of quasars. Observations of Titan provided the absolute scale for the flux density calibration. Further technical descriptions of the SMA are found in Ho, Moran & Lo (2004).
The data were calibrated using the IDL superset MIR originally developed for the Owens Valley Radio Observatory (Scoville at al. 1993) and adapted for the SMA222The MIR cookbook by Charlie Qi can be found at http://cfa-www.harvard.edu/cqi/mircook.html. The calibrated data were imaged and analyzed in the standard manner using the MIRIAD and AIPS packages. We weighted the (u,v) data using the ROBUST parameter of INVERT set to 5, optimizing for a maximum sensitivity in each line image. This option is recommended to achieve the largest signal-to-noise ratio possible, although some angular resolution is sacrificed. The synthesized beam had dimensions of (or 1300 AU 800 AU at an adopted distance of 460 pc, see Bally, O’Dell, & McCaughrean 2000) with a P.A. = . The resulting line image rms was 70 mJy beam-1. In this paper we used LSR radial velocities, and the transformation adopted to heliocentric radial velocities is v(heliocentric) = v(LSR) + 15.2 km s-1.
3 The New SiO Outflows
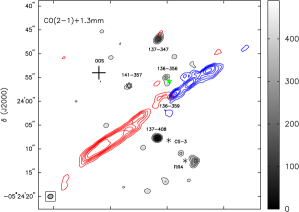
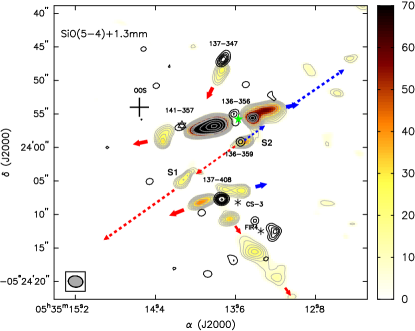
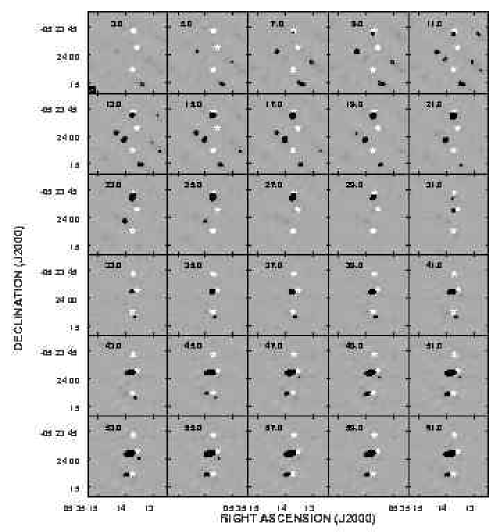
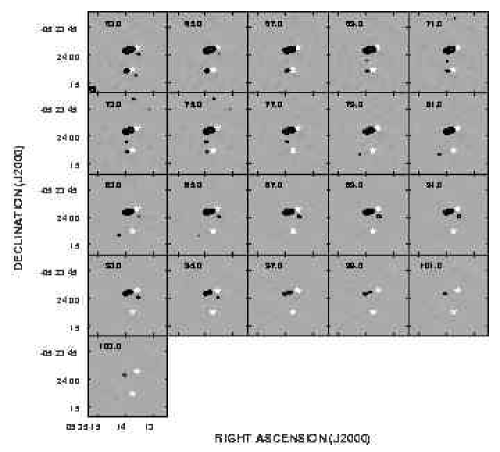
Figure 1 shows the contour and color scale images of the 12CO J=21, SiO J=54; and 1.3 mm continuum thermal emission detected toward the OMC1S region in the Orion Nebula using the Submillimeter Array. The upper panel shows the 12CO J=21 highly collimated ( ) and fast ( 80 km s-1) bipolar outflow and the 1.3 mm continuum emission imaged by Zapata et al. (2005). The exciting source of this outflow seems to be the source 136-359, or the infrared source C (Gaume et al. 1998). However, the bolometric luminosity of this source appears to be far too low to account for the powerful molecular outflow. We note that this 12CO bipolar outflow was the only outflow detected in those observations. The lower panel shows the four new compact SiO J=54; molecular outflows associated with the millimeter and infrared sources 136-356, 137-347, and 137-408 as well as the SiO molecular clumps associated with the redshifted side of the collimated 12CO J=21 flow. In Tables 1 and 2, we give their observational and physical parameters, respectively. The observed parameters were determined from a linearized least-squares fit to a Gaussian ellipsoid function using the task IMFIT of AIPS.
In what follows, we will discuss each of the four thermal SiO molecular outflows and the thermal SiO emission associated with the redshifted side of the CO flow, separately.
3.1 136-356 Bipolar Outflow: The Most Powerful SiO Outflow in the Region
In Figure 1, in the lower panel, we can see how this strong SiO outflow is emanating bipolarly with a west(blueshifted)-east(redshifted) orientation from the infrared source 136-356 or source ”B” (Gaume et al. 1998; marked with a green star), a luminous ( 3 103 L⊙) infrared protostar of spectral type B2 (Gaume et al. 1998). We therefore propose that this object is likely the exciting source of the outflow. It is interesting to note that this source appears to be a relatively evolved protostar, possibly a class I or maybe class II object (André et al. 1993). This classification is due to the fact that it shows very weak 1.3 mm continuum emission.
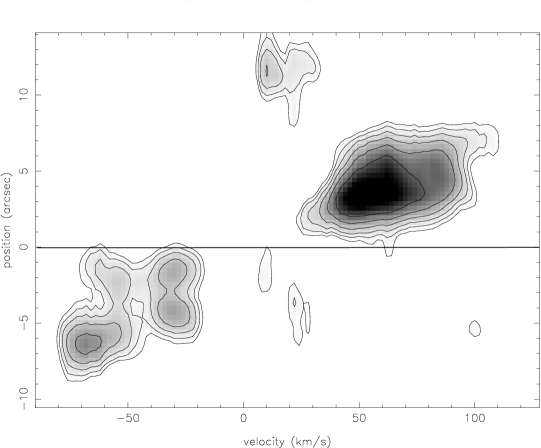
This outflow shows an extremely broad range of velocities: in its blueshifted component it displays gas velocities in the range of about -80 to -20 km s-1, while in its redshifted component the range is +105 to +25 km s-1 with respect to the ambient cloud velocity, which is taken to be 5 km s-1 (see Figure 3 and 4). The position angle of the whole outflow (redshifted and blueshifted lobes) can be determined with great accuracy: 108.4∘ 0.1∘, and its collimation angle is 13∘. This small collimation angle is consistent with an extremely young source (Arce & Sargent 2006). With our present angular resolution (), we can resolve the redshifted lobe, while the blueshifted lobe was only resolved in the east-west orientation (the major axis). We show their deconvolved parameters in Table 1.
We tried to test if the millimeter continuum source at the center of this outflow is elongated perpendicular to the outflow axis (as expected in the case of a circumstellar disk, but the continuum source is relatively weak and a reliable deconvolution of its dimensions was not possible.
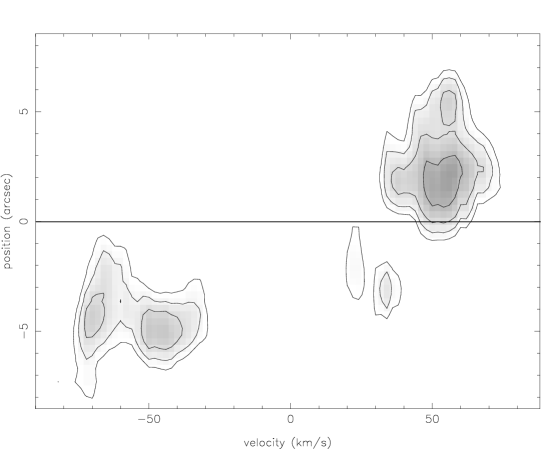
The spatial structure of the high and low velocity gas of the bipolar outflow as a function of the radial velocities (PV diagram) along the major axis is shown in Figure 4. This image shows that there is a tendency of the SiO thermal emission to be located very close to the proposed exciting object. Moreover, in its redshifted component, the line width is extremely broad, over 70 km s-1, as measured at the lowest displayed intensity contours. Similarly, the linewidth on the blueshifted side is 50 km s-1. We suggest that a wide-angle wind may be the driving mechanism of the 136-356 bipolar outflow (see, Shu et al. 1991 and Shang et al. 1998). Palau et al. (2006) found a PV structure in their observations of the HH 211 bipolar outflow which is very similar to our Figure 4 (see the spatial distribution of the SiO in their Figure 3). The observed wide range of velocities at the base of outflow is attributed to a protostellar wind with a large opening angle, thereby yielding a maximum spread of velocities. A pure, highly collimated jet model, in which the velocity vectors point only in the polar direction, cannot produce the broad line width, as explained in Palau et al. (2006). Furthermore, Arce and Goodman (2002) also predict this kind of structure on their PV diagram for a molecular outflow driven by a wide-angle wind. However, a very turbulent outflow, even if highly collimated could also explain the observations. If we assume that the broad emission from the outflow lobes is produced by a wide-angle wind, we can obtain a crude estimate of the total space velocity of the outflow as follows. Under this assumption, the velocity width of the outflow is given by , where is the space velocity of the outflow and is the collimation angle of the outflow. Adopting and , we obtain , which is a plausible value.
From Figure 6, we note that the easternmost clump seems not to form part of this strong bipolar outflow. This component is located 10′′ away from the exciting object and shows low velocity gas (10 to 30 km s-1), unlike the extremely high velocity gas observed in this outflow. If this easternmost clump was ejected by 136-356, the dynamical age would be of order 1,300 years, much older than the age of 200 years of the compact SiO outflow. A possibility is that this thermal emission is tracing another outflow, perhaps powered by the source 141-357 only a few arcseconds away (see Figure 1). The nature of this molecular component is unclear.
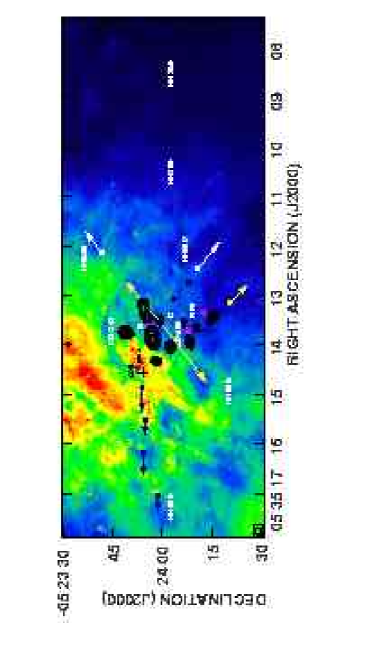
As mentioned in the introduction, the HH269 flow seems to be originating from a region only a few arcseconds across located in OMC1S. The HH 269 object is a blueshifted flow located due west of the OMC1S core and moves toward P.A. = +255∘, with a proper motion of about 50 km s-1 (Bally, O’Dell & McCaughrean 2000). O’Dell & Doi (2003) deduced that the expected location of the driving source responsible for the HH 269 flow should be located in the OOS, where no radio (Zapata et al 2004a,b), infrared (Robberto et al. 2005) or X-ray (Grosso et al. 2005) sources are detected. We have marked with a cross the position of the OOS region in the Figures 1 and 2. In Figure 2, we have overlapped the SiO velocity-integrated intensity detected by us with the H emission image of O’Dell & Wong (1996) from the Hubble Space Telescope. In this image we can see how the blueshifted side of the 136-356 bipolar SiO outflow is roughly aligned with the blueshifted HH 269 object, the differences of alignment could be explained by the jet deflection mechanism modeled by Raga and Cantó (1995) and discussed in the introduction. Moreover, both optical and radio flows display high velocity features. Then, it is tempting to propose that the source B or 136-356 might be energizing this optical large-scale object. However, there are strong arguments against this identification and we refer the reader to Henney et al. (2006) for a detailed discussion.
In this paper, we have estimated the kinematic ages of the SiO outflows by dividing the projected displacement in the plane of the sky over the radial velocity. In the case of this outflow, the age comes to be of order 200 years (see Table 2). We note that this manner of estimating kinematic ages can be very uncertain. An object moving at velocity forming an angle with respect to the line of sight, will have a line-of-sight radial velocity of . On the other hand, the projected displacement in the plane of the sky will be , where is the real displacement. Then, , the age estimated by this method, is , where is the real age. If , then and the estimated age is close to the real value. However, if the velocity vector is either close to the line-of-sight or to the plane of the sky, the error can be very large, reaching factors of about 5 for the cases of or . Then, the estimated ages should be taken with caution.
Only a few arcseconds east of this strong SiO outflow there is another remarkable Herbig-Haro that appears to be emanating from the OOS region, HH 529 (see Figure 2). The HH529 object consists of a chain of blueshifted bow shocks and knots moving toward the east at P.A. = -260∘ at a declination of about -5∘24′ and reaching spatial motions of up to 110 km s-1 (Bally, O’Dell & McCaughrean 2000). A few sources have been proposed to power the HH 529 object: the infrared source TCC 009 (McCaughrean & Stauffer 1994; proposed by Bally, O’Dell & McCaughrean 2000), the infrared sources A, B, and C (Gaume et al 1998; proposed also by Bally, O’Dell & McCaughrean 2000), the OOS region O’Dell and Doi (2003), and the source IRS2 of Smith et al. (2004). Possibly, the best candidate for the exciting source of this bow shock is the object TPSC-1 (Lada et al. 2000), which is seen only in the L band. We have indicated the position and motion of this HH object in Figure 2. ¿From this image it is evident that the HH 529 object does not align accurately with the redshifted lobe of this new SiO outflow (136-356). However, following again the jet deflection mechanism explained in the first section, we speculate that this molecular component, originally redshifted, may have been deflected due to an interaction with the molecular cloud and became the blueshifted optical object HH 529. These possible associations are discussed in a following paper (Henney et al. 2006).
3.2 Other SiO Molecular Flows
3.2.1 137-347 Monopolar Outflow
This northwest-southeast monopolar SiO outflow seems to emanate from the millimeter source 137-347 (see Figure 1), a source with no counterpart at infrared wavelengths (see Lada et al. 2000, 2004; Muench et al. 2002, Smith et al. 2004, Robberto et al. 2005), perhaps suggesting that it could be associated with a class 0 protostar. We propose that the object 137-347 is possibly its exciting source. The 137-347 monopolar outflow shows redshifted emission of moderate gas velocity ( 5 to 31 km s-1) with respect to the ambient cloud velocity (see Figures 3 and 5). The position angle of this outflow is 161.1∘ 0.5∘. The spatial distribution of the integrated SiO J=54 thermal emission shows that the source is not resolved along its minor axis, and this is consistent with a molecular clump of gas moving at moderate velocity. At present it is not possible to establish if its monopolarity is due to anisotropic ambient cloud conditions or to an intrinsic asymmetry in the flow.
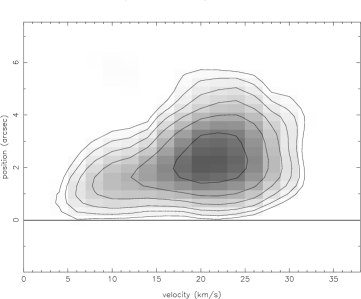
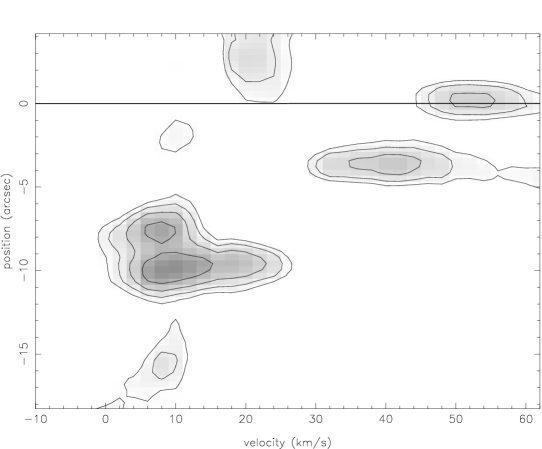
The PV diagram of this flow along the major axis is shown in Figure 7. This image shows the strongest SiO molecular emission at about 23 km s-1 and a distance from the exciting source of 900 AU. Analyzing this image, we note that this outflow also appears to be driven by a wide-angle wind starting close to its exciting object, since it shows a broad range of velocities very close to the exciting object, as observed in the bipolar outflow 136-356.
The 10 to 30 km s-1 clump discussed in section 3.1, that we tentatively proposed as being excited by the continuum source 141-357, falls close to the direction defined by the 137-347 monopolar outflow and could potentially be excited by the latter source. Proper motion studies of these outflows are needed to identify more firmly the exciting sources.
3.2.2 137-408 Multipolar Outflow
137-408 Bipolar Outflow: East-west Flow
This SiO bipolar outflow is found to be very young (with a dynamical age of about 200 yrs), exhibiting high velocity and well centered on the strong millimeter source 137-408 (see Figure 1). We note that the source 137-408 does not have centimeter or infrared counterparts (see Lada et al. 2000, 2004; Smith et al. 2004; Robberto et al. 2005, Zapata et al. 2004a,b), possibly because it is a genuine embedded class 0 object. We propose that 137-408 is likely the exciting source of the outflow.
The 137-408 bipolar outflow shows redshifted and blueshifted gas velocity at about 70 km s-1 quite symmetric with respect to the ambient cloud velocity (see Figures 3 and 8). The position angle of this object is 129.3∘ 0.9∘, and its collimation angle is 15∘. The northwest lobe is resolved only along its major axis, and we show its deconvolved parameters in Table 1. Its PV diagram along the major axis is shown in Figure 8. Analyzing this image we find that most of the blueshifted SiO thermal emission falls in a range of velocities between -30 to -80 km s-1, while the redshifted emission falls between 30 to 80 km s-1.
From our previous millimeter continuum image of the OMC1S region (Figure 1), we believe that FIR 4 and CS-3 sources are likely the same source (this possibility was first proposed by Gaume et al. 1998), and that this source could be related with our strong millimeter source 137-408, only a few arcseconds from both sources. However, given the uncertainties in the available positions for FIR 4 and CS-3, we cannot rule out the possibility that CS-3 is associated with 137-408 and that FIR 4 is associated with the continuum structure located about 2′′ to its west. This outflow can be related to one of the HH objects of east-west orientation that emanate from FIR 4 or CS-3; however, there is no clear relation to them.
137-408 Monopolar Outflow: South Flow
This SiO outflow also appears to emanate from the millimeter source 137-408 (see Figure 1). Therefore, in the same way as the previous SiO flow, the object 137-408 could be its exciting source. The 137-408 south flow shows redshifted emission of low (0 to 27 km s-1, for the most southern component) and moderate (29 to 56 km s-1, for the component nearest to 137-408) gas velocity with respect to the ambient cloud velocity (see Figure 9). The position angle of this outflow is 34∘. The spatial distribution of the integrated SiO thermal emission of the nearest component to the source 137-408 is found to be angularly unresolved, while the southern component is angularly resolved and we give its deconvolved parameters in Table 1.
We note that this flow shows a different morphology as compared with the other molecular outflows. It shows a clumpy structure along its major axis with every clump or ”bullet” displaying a different range of velocities (see Figure 9). Moreover, it is the most extended outflow detected by us, being 15′′ long and its dynamical age is an order of magnitude larger than the other flows discussed here (see Table 2).
When comparing our observations with those of the 12CO J=21 observations of Schmid-Burgk et al. (1990) toward the OMC1S region, we find that they detected a 120′′ long redshifted monopolar low velocity (15 km s-1) outflow with a position angle of 31∘, presumably ejected from the sources FIR 4 or CS-3. As discussed above, the (sub)millimeter sources FIR 4 and CS-3 could be associated with our source 137-408, implying that this SiO monopolar outflow is emanating from the same source as the CO outflow and at a P.A. of about 30∘. Moreover these SiO and CO outflows show low velocity features. Hence, we propose that the SiO outflow detected here is the base of the large-scale CO flow detected by Schmid-Burgk et al. (1990). However, we believe that further, more sensitive SiO observations of low angular resolution are required to confirm this relation.
We note that the presence of two outflows associated with 137-408 may indicate more than one underlying exciting source. These could be unresolved or one may be very faint.
3.3 SiO Thermal Emission Associated with the Powerful Southeast-Northwest CO Outflow
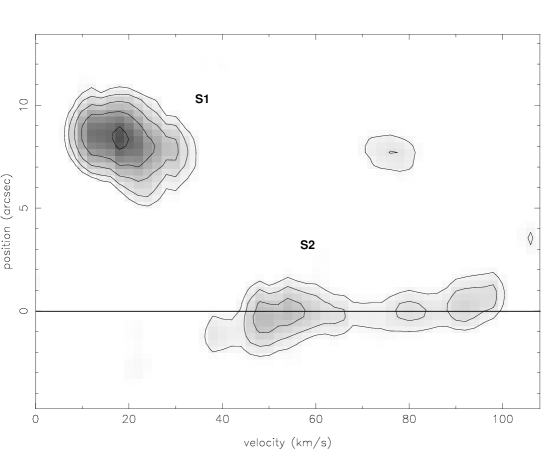
In Figure 1, we can see that there are two molecular clumps (labeled as S1 and S2) associated with the redshifted lobe of the highly collimated northwest-southeast CO bipolar outflow (see Figure 1, upper panel). The S1 clump shows moderate redshifted gas (10 to 25 km s-1), while the S2 clump shows gas motions at high velocities (40 to 100 km s-1), see Figures 3 and 8. We note that the clump S2 shows a little positional offset toward the northeast direction of the possible exciting object (source ’C’ or 136-359).
The southeastern clump (S1) is also very compact, and it is located in one of the knots of the southeast-northwest redshifted CO lobe (see Figure 1). As in the other outflows discussed here, we suggest that this SiO clump is produced by an internal shock in the flow, where the abundance of the SiO molecules can be enhanced by several orders of magnitude with respect to the quiescent ambient cloud by the destruction of dust particles (L1157; Gueth, Guilloteau and Bachiller 1998; L1448; Dutrey et al. 1997).
The spatial structure of the high and low velocity gas of the S1 and S2 clumps as a function of the radial velocities (PV Diagram) along a P.A. of 110∘ is shown in Figure 10.
3.4 Physical Parameters of the SiO Outflows
Following Liu et al. (1998), we calculate the physical parameters of all the new molecular outflows, e.g. masses, momenta, energies and mechanical luminosities, and the results are presented in Table 2. We assumed LTE conditions and optically thin emission, a rotational temperature of 80 K, and an abundance ratio of SiO/H2 equal to 1 10-7 (Ziurys & Friberg 1987; Mikami et al. 1992; Zhang et al. 1995). It is important to mention that this ratio can change in every molecular outflow and the masses can be over/underestimated. We also took the major and minor axes of the synthesized Gaussian beam to be 2.8′′ and 1.7′′, respectively, the upper energy level for the SiO J=54 transition to be Eu=14.48 K, a rotational constant for SiO of B=21,787 MHz and a dipole moment of 3.1 Debyes (Liu et al. 1998).
From Table 2 we note that the implied kinematic luminosity for the strongest SiO molecular outflow should be about 450 L⊙, a factor of 8 less than the total bolometric luminosity ( 3 103 L⊙) of the infrared source ’B’. Even when the situation in this case is not as critical as in the CO outflow reported by Zapata et al. (2005), where the kinematic luminosity of the outflow seems to exceed the bolometric luminosity of the exciting source, it is still very dificult to explain the large kinematic luminosity of this SiO outflow. Statistically, the kinematic luminosity of outflows is of order of only 0.001-0.01 of the bolometric luminosity of the exciting source (Wu et al. 2004). One possibility is that the SiO is greatly enriched in this flow, leading to an overestimate in the total mass of the outflowing molecular gas.
4 General Discussion
We note that most of the SiO outflows are compact ( 3500 AU 1500 AU), located close to their proposed exciting objects, and display a high dispersion of velocities.
It is puzzling that in our previous CO observations we did not detect these three monopolar and bipolar SiO flows. A possible explanation for the non-detection of these new SiO outflows in the CO data would be that two of them are low velocity outflows. The 137-408 monopolar south outflow (0 to 27 km s-1 for the southern component, and 30 to 50 km s-1 for the northern component) and the 137-347 monopolar south-east outflow (5 to 35 km s-1), may be confused with extended CO J=21 emission at ambient velocities (-25 to 21 km s-1), see Zapata et al. (2005). However, for the other two east-west SiO outflows (136-356 and 137-408) it is not clear why they were not detected as they have extremely high velocities ( 70 km s-1), and are apparently massive outflows. In particular, for the strong SiO outflow associated with 136-356 we estimate, from comparison with the data of Zapata et al. (2005), that an enhancement of SiO of order 50 with respect to the adopted value of [SiO/H2]1 10-7 is needed in order to explain the non detection of this SiO outflow in CO.
We also note that the blueshifted velocity component of the highly collimated CO outflow shows a faint extension between the second and third molecular ”bullets”, to the west of these components (see Figure 1). If one searches at the position of this weak CO feature in the SiO velocity-integrated intensity image, we find that this component coincides very well in position with the blueshifted side of the 136-356 bipolar outflow. Therefore, in the CO velocity-integrated intensity image, we may be seeing weak CO emission associated with the blueshifted component of the 136-356 SiO bipolar outflow. In such a way, this extension can be the key to explain the nature of those two new outflows. Probably, the SiO emission is tracing high density entrained gas with a broad range of velocities and closer to their exciting objects, associated perhaps with their primary jets (see Hirano et al. 2006). The CO emission, is possibly tracing low density entrained gas, with a less broad range of velocities as has been observed by Palau et al. (2006) in the HH211 flow. Following this premise, in these SiO observations, we have imaged unresolved emission from the jet itself, as observed by Hirano et al. (2005) and Palau et al (2006). However, for this mechanism to work, we need strong chemical mechanisms that would strongly favor the detection of each molecule in the two components of different density.
At this point, it is not well understood yet why the SiO is a selective tracer. In some cases it seems to be associated with the most excited parts of the flows (136-356 and 137-408 outflows; this paper, and HH211; Hirano et al. 2006; Palau et al. 2006) while in other cases it is associated with internal shocks in the outflows, (L1157; Gueth, Guilloteau and Bachiller 1998, L1448; Dutrey et al. 1997, and the 136-359 CO outflow; this paper). One possibility for unifying these two mechanisms would be if the SiO molecule is formed/excited in shocks that are propagating down the jet (”internal working surfaces”), as proposed by Arce et al. (2006).
In Table 3 we show a list of tentative associations between the HH objects, the molecular outflows, and their proposed exciting sources located in the OMC1S region.
5 Summary
We have observed the OMC1 South region in the SiO J=54 molecular line with high angular resolution (). We found for the first time a cluster of four hidden compact bipolar and monopolar outflows that show high, moderate and low velocity gas and appear to be energized by millimeter and infrared sources associated with the OMC1 South region. Furthermore, these SiO outflows seem to be the base of some remarkable Herbig-Haro flows that emanate from this region. The specific results and conclusions of this study are as follows:
1. We found four compact molecular outflows:
-
•
A strong east-west bipolar molecular outflow that appears to be powered by the luminous ( 3 103 L⊙) infrared source ’B’ or 136-356. This molecular flow is very compact ( 3600 AU) and shows a quite broad range of velocities ( 100 km s-1). By analyzing its PV diagram, we find evidence that its redshifted component is been driven by a wide-angle wind. This blueshifted component could be powering the HH 269 object, if we assume that this molecular outflow is being deflected. This and other possible associations in the region are discussed in detail in Henney et al. (2006).
-
•
A north-south compact monopolar redshifted outflow associated with the source 137-347 and has gas with velocities ranging between 5 and 31 km s-1. The spatial distribution of the integrated SiO J=54 thermal emission is unresolved and is consistent with a molecular clump of moderate velocity. By analyzing its PV diagram, we also find evidence that it is being driven by a wide-angle wind.
-
•
A multipolar outflow associated with the millimeter source 137-408. One of the components is emanating almost in an east-west orientation, while the other one is emanating in the southeast-northwest direction. The east-west bipolar outflow is very young (about 200 yrs), shows a broad range of velocities ( 80 km s-1), and has a P.A. of 129.3∘. On the other hand, the northwest-southeast monopolar flow shows gas at moderate velocities ranging between 3 and 60 km s-1 and it has a position angle of 34∘. Comparing with the orientation (31∘) and the integrated gas velocity ( 15 km ) of the red-shifted component of the large scale CO molecular outflow that emanates from this region (Schmid-Burgk et al. 1990), we propose that the monopolar SiO flow is the base of this CO flow. However, we believe that further sensitive SiO observations of low angular resolution are required to confirm this relation. Finally, we also note that the presence of two outflows associated with 137-408 may indicate more than one underlying exciting source.
2. We found two compact SiO molecular clumps S1 and S2 associated with the redshifted component of the CO outflow (Zapata et al. 2005). The northwestern component (S2) is very compact and its position is almost coincident with the source 136-359, the proposed exciting source of the CO flow. The southeastern clump (S1) is also very compact, shows moderate redshifted gas velocity (10 to 25 km s-1) and it is located in one of the knots of the southeast-northwest CO outflow. We therefore suggest that this molecular SiO clump is produced by an internal shock in the flow, where the abundance of the SiO molecules can be enhanced by several orders of magnitude with respect to the quiescent ambient cloud value by destruction of the dust particles.
3. We find that the SiO molecular outflows are compact ( 3500 AU 1500 AU), show a broad range of velocities (-80 to +110 km s-1), and in most of the cases, are located very close to their exciting sources. We propose that the SiO thermal emission is tracing the youngest and most highly excited parts of some outflows which cannot be detected in other molecules. Moreover, the SiO line observations can detect flows that in other molecular tracers appear confused with the ambient velocity cloud emission.
References
- (1) André, P., Ward-Thompson, D., & Barsony, M. 1993, ApJ, 406, 122
- (2) Arce, H. G., & Goodman, A. A. 2002b, ApJ, 575, 928
- (3) Arce, H. & Sargent, A. I 2006, arXiv.org:astro-ph/0605139
- (4) Arce, H. et al. 2006, arXiv.org:astro-ph/0603071
- (5) Bally, J., Licht, D., Smith, N., & Walawender, J., 2006, AJ, 131, 473
- (6) Bally, J., O’Dell, C. R., & McCaughrean, M. J. 2000, AJ, 119, 2919
- (7) Batrla, W., Wilson, T. L., Ruf, K., & Bastien, P. 1983, A&A, 128, 279
- (8) Raga, A. C. & Cantó, J. 1995, Rev. Mex. AA, 31, 51.
- (9) Chandler, C. J., & Richer, J. S. 2001, ApJ, 555, 139
- (10) Choi, M. 2005, ApJ, 630, 976C
- (11) Doi, T., O’Dell, C. R., & Hartigan, P. 2004, AJ, 127, 3456
- (12) Dutrey, A., Guilloteau, S., & Bachiller, R. 1997, A&A, 325, 758
- (13) Eislöffel, J., & Mundt, R. 1997, AJ, 114, 280
- (14) Fich, M., & Lada, C. J. 1997, ApJ, 484, L63
- (15) Hirano, N., Liu, S.-Y., Shang, H., Ho, P. T. P., Huang, H.-C., Kuan, Y.-J., McCaughrean, M. J., Zhang, Q., 2006, ApJ, 636, L141
- (16) Gaume, R. A., Wilson, T. L., Vrba, F. J., Johnston, K. J., & Schmid-Burgk J. 1998, ApJ, 493, 940
- (17) Grosso, N., et al. 2005, ApJS, 160, 530
- (18) Gueth, F., Guilloteau, S., & Bachiller, R. 1998, A&A, 333, 287
- (19) Guilloteau, S., Bachiller, R., Fuente, A., & Lucas, R. 1992, A&A, 265, L49
- (20) Henney, W. J., O’Dell, C. R., Zapata, L. A., García-Díaz, M. T., & Rodríguez, L. F. 2006, in preparation
- (21) Ho, P. P. T, Moran, J. M., & Lo, K. Y. 2004, ApJL, 616, L1
- (22) Kaifu, N., et al. 2000, PASJ, 52, 1
- (23) Keene, J., Hildebrand, R.H., & Whitcomb, S.E. 1982, ApJL, 252, L11
- (24) Lada, C. J., Muench, A. A., Haisch, K. E., Jr., Lada, E. A., Alves, J. F., Tollestrup, E. V., & Willier, S. P., 2000, AJ, 120, 3162
- (25) Lada, C. J., Muench, A. A., Lada, E. A., & Alves, J. F. 2004, AJ, 128, 1254
- (26) Liu, S.-Y., Mehringer, D. M., Miao, Y., & Snyder, L. E., 1998, ApJ, 501, 680
- (27) Masson, C. R., & Chernin, L. M. 1993, ApJ, 414, 230
- (28) Mauersberger, R., Henkel, C., Wilson, T. L.,& Walmsley, C. M. 1986, A&A, 162, 199
- (29) McMullin, J. P., Mundy, L. G., & Blake, G. A. 1993, ApJ, 405, 599
- (30) McCaughrean, M. J., & Stauffer, J. R. 1994, AJ, 108, 1382
- (31) Mezger, P. G., Zylka, R., & Wink, J. E. 1990, A&A, 228, 95
- (32) Mikami, H., Umemoto, T., Yamamoto, S., & Saito, S. 1992, ApJ, 392, L87
- (33) Muench A. A., Lada E. A., Lada C. J., & Alves J., 2002, ApJ, 573, 36
- (34) Mundy, L. G., Scoville, N. Z., Baath, L. B., Masson, C. R., & Woody, D. P. 1986, ApJ, 304, L51
- (35) O’Dell, C. R., & Wen, Z. 1994, ApJ, 436, 194
- (36) O’Dell, C. R., & Wong K. 1996, AJ, 111, 846
- (37) O’Dell, C. R. & Doi, T. 2003, AJ, 125, 127 (Erratum: 2003, AJ, 125, 2753)
- (38) Palau, A., Ho, P. T. P., Zhang, Q., Estalella, R., Hirano, N., Shang, H., Lee, C.-F., Bourke, T. L., Beuther, H., Kuan, Y.-J., 2006, ApJ, 636L, 137
- (39) Raga, A. C., de Gouveia Dal Pino, E. M., Noriega-Crespo, A., Minnini, P. D., & Velázquez, P. F. 2002, A&A, 392, 267
- (40) Reipurth, B., Raga, A. C., & Heathcote, S. 1996, A&A, 311, 989
- (41) Robberto, M., Beckwith, S. V. W., Panagia, N., Patel, S. G., Herbst, T. M., Ligori, S., Custo, A., Boccacci, P., & Bertero, M., 2005, AJ, 129, 153
- (42) Rodríguez-Franco, A., Martín-Pintado, J. & Wilson, T.L., 1999, A&A 344, L57
- (43) Rosado, M., de la Fuente, E., Arias, L., Raga, A., & Le Coarer, E. 2001, AJ, 122, 1928
- (44) Schilke, P., Walmsley, C. M., Pineau des Forets, G., & Flower, D. R. 1997b, A&A, 321, 293
- (45) Schmid-Burgk, J., Güsten, R., Mauersberger, R., Schulz, A., & Wilson, T. L. 1990, ApJ, 362, L25
- (46) Shang, H., Shu, F. H., & Glassgold, A. E. 1998, ApJ, 493, L91
- (47) Shu, F. H., Ruden, S. P., Lada, C. J., & Lizano, S. 1991, ApJ, 370, L31
- (48) Smith, M. D., Suttner, G., & Yorke, H. W. 1997, A&A, 323, 223
- (49) Smith, N., Bally, J., Shuping, R. Y., Morris M., & Hayward, T. 2004, ApJ, 610, L120
- (50) Su, Y., Zhang, Q., & Lim, J. 2004, ApJ, 604, 258
- (51) van Dishoeck, E. F., & Blake, G. A. 1998, ARA&A, 36, 317
- (52) Wilson, T. L., & Rood, R. T. 1994, ARA&A, 32, 191
- (53) Wiseman, J. J., & Ho, P. T. P. 1998, ApJ, 502, 676
- (54) Wu, Y., Wei, Y., Zhao, M., Shi, Y., Yu, W., Qin, S., & Huang, M. 2004, A&A, 426, 503
- (55) Zapata, L. A., Rodríguez, L. F., Kurtz, S. E., & O’Dell, C. R. 2004a, AJ, 127, 2252
- (56) Zapata, L. A., Rodríguez, L. F., Kurtz, S. E., O’Dell, C. R. & Ho, P. T. P. 2004b, ApJ, 610, 121
- (57) Zapata, L.A., Rodríguez, L.F., Ho, P.T.P., Zhang, Q., Qi, C., & Kurtz, S.E. 2005, ApJL, 630, L85
- (58) Zhang, Q., Ho, P. T. P., Wright, M. C. H., & Wilner, D. J. 1995, ApJ, 451, L71
- (59) Zinnecker, H., McCaughrean, M. J., & Rayner, J. T. 1998, Nature, 394, 862
- (60) Ziurys, L. M., Wilson, T. L. & Mauersberger, R., 1990, ApJ, 356, 25
- (61) Ziurys, L. M., & Friberg, P. 1987, ApJ, 314, L49
| Parameters | |||||
|---|---|---|---|---|---|
| Outflow | Coordinates | Deconvolved | |||
| Name | Size | P.A. | |||
| 137-347 | 05 35 13.740 | -05 23 48.79 | 2.1 0.4 - | 161.1∘ 0.5∘ | |
| 136-356 Redshifted | 05 35 13.817 | -05 23 56.79 | 3.006′′ 0.002′′ 0.35′′ 0.01′′ | 106.96∘ 0.08∘ | |
| 137-356 Blueshifted | 05 35 13.250 | -05 23 54.30 | 5.84′′ 0.2′′ – | 109.78∘ 0.07∘ | |
| S1 | 05 35 14.035 | -05 24 02.47 | - | - | |
| S2 | 05 35 13.511 | -05 23 59.42 | - | - | |
| 137-408 Redshifted | 05 35 13.946 | -05 24 08.16 | 1.00′′ 0.02′′ – | 129.3∘ 0.9∘ | |
| 137-408 Blueshifted | 05 35 13.534 | -05 24 06.43 | - | - | |
| 137-408 (South-1) | 05 35 13.662 | -05 24 10.51 | - | - | |
| 137-408 (South-2) | 05 35 13.416 | -05 24 15.48 | 1.89′′ 0.03′′ – | 49.3 ∘ 0.8∘ | |
Note. — Units of right ascension are hours, minutes, and seconds, and units of declination are degrees, arcminutes.
| Outflow | Projected Size | Dynamical Age | Mass | Momentum | Energy | Mechanical Luminosity | |
|---|---|---|---|---|---|---|---|
| Name | [AU] | [yr-1] | [M⊙] | [M⊙ km s-1] | [1046 erg] | [L⊙] | |
| 137-347 | 970 | 188 | 0.05 | 1 | 0.025 | 2.4 | |
| 136-356 Redshifted | 1400 | 160 | 0.80 | 45 | 2.5 | 400 | |
| 136-356 Blueshifted | 2700 | 192 | 0.19 | 7.5 | 0.3 | 50 | |
| S1 | - | - | 0.01 | 0.15 | 0.025 | - | |
| S2 | - | - | 0.04 | 2 | 0.1 | - | |
| 137-408 Redshifted | 460 | 107 | 0.02 | 1 | 0.025 | 8.8 | |
| 137-408 Blueshifted | - | - | 0.005 | 0.2 | 0.005 | 1.8 | |
| 137-408 | 900 | 3000 | 0.04 | 1 | 0.025 | 0.3 |
Note. — To calculate energy and momentum, we use as the typical velocity one half the highest velocity displayed by the molecular outflows.
Note. — To calculate those physical parameters we assumed a fractional abundance between SiO and H2 equal to 1 10-7, found by Ziurys & Friberg (1987), Mikami et al. (1992), and Zhang et al. (1995) toward the Orion-KL and L1157 molecular ouflows, respectively.
| Herbig-Haro | Molecular | Proposed Exciting | References |
|---|---|---|---|
| Object | Outflows | Sources | |
| HH 530 | 137-408 south outflow? | 137-408 or FIR4/CS3? | BAL00; this paper |
| HH 625 | 136-359 bipolar outflow (NW) | 136-359 or source C | OD03; ZA05 |
| HH 528 | 136-359 bipolar outflow (SE)? | 136-359 or source C? | This paper; OD03 |
| HH 269 | 136-356 bipolar outflow (W)? | 136-356 or source B? | This paper |
| HH 529 | No association | OOS | OD03 |
| HH 202 | No association | 143-353; Smith-IRS1 | ZA04; SM04 |
| HH 203+HH 204 | No association | 143-353; Smith-IRS1 | ZA04; SM04 |
Note. — OD03=O’Dell and Doi (2003); SM04=Smith et al. (2004); ZA04= Zapata et al. (2004b); ZA05=Zapata et al. (2005); BA00=Bally, O’Dell & McCaughrean (2000)