Enhanced density and magnetic fields in interstellar OH masers
Abstract
We have observed the 6030 and 6035 MHz transitions of OH in high-mass star-forming regions to obtain magnetic field estimates in both maser emission and absorption. Observations were taken with the Effelsberg 100 m telescope. Our observations are consistent with previous results, although we do detect a new 6030 MHz maser feature near km s-1 in the vicinity of W3(OH). In absorption we obtain a possible estimate of mG for the average line-of-sight component of the magnetic field in the absorbing OH gas in K3-50 and submilligauss upper limits for the line-of-sight field strength in DR 21 and W3. These results indicate that the magnetic field strength in the vicinity of OH masers is higher than that of the surrounding, non-masing material, which in turn suggests that the density of masing OH regions is higher than that of their surroundings.
Key Words.:
masers – stars: formation – ISM: magnetic fields – radio lines: ISM – H ii regions – ISM: molecules1 Introduction
The hydroxyl radical (OH) is one of the most commonly-observed molecules in astrophysical contexts. OH masers are seen in massive star-forming regions as well as other environments, such as evolved stars and supernova remnants. Since they are small and often bright, their locations can be pinpointed, and multi-epoch observations provide proper motions to submilliarcsecond astrometric accuracy. OH masers are also an excellent tracer of magnetic fields due to the large Zeeman splitting coefficients in the ladder, which includes the ground-state transitions at 18 cm and the transitions in the first rotationally excited state at 5 cm.
Our main motivation for this work is to address the question of whether cloud regions giving rise to OH masers are denser than the surrounding non-masing material. If true, this suggests that maser proper motions represent actual physical motions in the material, rather than unrelated travelling excitation phenomena. To this end, we aimed to identify sources with strong OH absorption and to obtain estimates of the magnetic field strength in the non-masing gas therein. The magnetic field strength is a reasonable proxy for the density because both theoretical modelling (Mouschovias 1976; Fiedler & Mouschovias 1993) and observations of molecular clouds (e.g., Crutcher 1999) indicate that the magnetic field scales as , during collapse. This scaling holds over many orders of magnitude in density, and the few milligauss magnetic field strengths found from Zeeman splitting of the maser lines correspond well to the densities ( – cm-3) that are thought to be conducive to their excitation (Cesaroni & Walmsley 1991).
It is necessary to observe excited-state transitions of OH because the spectra of high-mass star-forming regions with a large column density of OH are generally dominated by maser features in the ground state. Previous observations of main-line absorption were successful in detecting the Zeeman splitting in one source (W3(OH)) and obtaining milligauss-scale upper limits in two others (K3-50 and G10.6240.385) (Güsten, Fiebig, & Uchida 1994; Uchida, Fiebig, & Güsten 2001; Fish, Reid, & Menten 2005). In this work we extend this technique to the main-line transitions. Because this is a lower excited state, the spectra of many sources (e.g., W3(OH)) are dominated by strong masers. However, when uncontaminated absorption is seen, Zeeman splitting is easier to detect, due to a larger Zeeman splitting coefficient than in the transitions.
Several surveys of the main-line transitions have been undertaken previously. Chief among them are the survey by Baudry et al. (1997, henceforth B97) in the northern hemisphere and a series of surveys in the southern hemisphere by Caswell & Vaile (1995) and Caswell (1997, 2001, 2003). Our source list has a large overlap with B97 and a smaller overlap with the Caswell surveys, most of whose sources are not observable from Effelsberg, Germany. We compare our results with these and other previous results in Sect. 3.2.
| RA | Dec | Timea | |||
|---|---|---|---|---|---|
| Source | (J2000) | (J2000) | (min) | (mJy) | Detectedc |
| W3 Cont | 02 25 43.3 | 62 06 13d | 1217 | 3 | A |
| W3(OH) | 02 27 03.8 | 61 52 26 | 18 | 21e | M |
| Orion KL | 05 35 14.2 | 05 22 47 | 6 | 216 | M? |
| S269 | 06 14 37.1 | 13 49 36 | 12 | 21 | … |
| R Leo | 09 47 33.5 | 11 25 46 | 12 | 17 | … |
| IRC +10216 | 09 47 57.3 | 13 16 42 | 72 | 8 | … |
| Sgr A | 17 45 40.2 | 29 00 30 | 12 | 107 | … |
| Sgr B2M | 17 47 20.1 | 28 23 22 | 84 | 8 | E M |
| G5.886$-$0.393 | 18 00 30.6 | 24 04 01 | 12 | 35 | A E M |
| G10.624$-$0.385 | 18 10 28.6 | 19 55 50 | 12 | 31 | A M |
| M17 | 18 20 22.4 | 16 11 25 | 6 | …f | M |
| G19.61$-$0.23 | 18 27 38.1 | 11 56 39 | 6 | 36 | … |
| G28.199$-$0.048 | 18 42 58.0 | 04 13 58 | 30 | 12 | E M |
| G30.589$-$0.044 | 18 47 18.8 | 02 00 54 | 6 | 26 | … |
| G35.577$-$0.029 | 18 56 22.5 | 02 20 27 | 6 | 27 | … |
| W48 | 19 01 45.5 | 01 13 33 | 54 | 17 | A M |
| G45.122$+$0.133 | 19 13 27.8 | 10 53 37 | 180 | 8 | A M |
| W51 e/d | 19 23 40.0 | 14 30 51 | 36 | 47 | A M |
| K3-50 | 20 01 45.7 | 33 32 45 | 428 | 2 | A M |
| ON 1 | 20 10 09.1 | 31 31 35 | 24 | 16 | M |
| ON 2 N | 20 21 44.0 | 37 26 38 | 6 | 39 | … |
| DR 20 | 20 36 52.2 | 41 36 24 | 12 | 20 | M |
| W75 N | 20 38 36.4 | 42 37 34 | 6 | 34 | M |
| W75 S | 20 39 00.9 | 42 22 38 | 30 | 16 | M |
| DR 21 | 20 39 01.1 | 42 19 43 | 640 | 3 | A |
| LDN 1084 | 21 43 01.4 | 54 56 16 | 102 | 8 | M |
| S140 | 22 19 18.2 | 63 18 46 | 30 | 13 | … |
| Cep A | 22 56 19.1 | 62 01 57 | 6 | 34 | … |
| NGC 7538 | 23 13 45.6 | 61 28 18 | 180 | 8 | M |
-
a
Sum of on-source and off-source observing time.
-
b
Single-polarization rms noise in a 0.243 km s-1 Hanning-weighted channel.
-
c
A = absorption, E = broad emission, M = maser emission
-
d
Approximate position – see Sect. 3.2 for details.
-
e
Excessive ringing was still seen in 6035 MHz RCP after Hanning weighting.
-
f
Autocorrelator saturated.
2 Observations
Observations were taken with the 5 cm prime focus receiver on the 100 m telescope of the Max-Planck-Institut für Radioastronomie at Effelsberg between 11 and 21 March 2005. The system temperature was 27 K. The gain was 1.57 K/Jy as measured using 3C286 as a flux calibrator. The FWHM beam size at this wavelength is approximately 130. Pointing corrections were determined only several times a day, since pointing was stable to about 10. Focus corrections were determined less frequently. These corrections rarely exceeded 1 mm, or 2% of the observing wavelength.
The AK90 8192-channel correlator was used. Both the (rest frequency 6035.092 MHz) and (rest frequency 6030.747 MHz) transitions were observed simultaneously in both right (RCP) and left circular polarizations (LCP). Source DR 21 was also briefly observed in the (rest frequency 6016.746 MHz) transition. These transitions were Doppler-corrected for the motion of the Earth around the Sun as well as the LSR velocity of the source and then centered in four IFs of 5 MHz bandwidth. Each IF was subdivided into 2048 channels separated by 2.44 kHz, corresponding to a channel width of 0.121 km s-1. Position switching with equal time (generally 3 min) off- and on-source was employed.
Data were reduced using CLASS. Polynomial fitting was used to subtract baselines, which were generally stable with time. Interference was minimal; however, occasionally spurious patterns bearing a strong resemblence to OH absorption features appeared in IF 4 (6030 MHz LCP). These were generally easily identifiable, and the corresponding data were kept when the velocity region of interest was uncontaminated. In the rare instances in which these spurious features coincided with real absorption and/or emission features, the scan was discarded.
Gaussian profiles were fit to the data in spectral ranes with absorption and emission. In most cases the data were Hanning-weighted before fitting profiles to absorption components. Since the resulting channel width is comparable to a typical maser line width, Gaussian profiles were fit to the masers in the unsmoothed data, except in rare cases when it was necessary to suppress “ringing” (spectral sidelobes) from a strong, spectrally unresolved feature.
Consistent with the primary motivation for this project, emphasis in observing time was given to sources with strong absorption uncontaminated by maser emission at either 6030 or 6035 MHz. Secondary motivations included detecting sources with weaker absorption and measuring Zeeman splitting of masing sources in massive star-forming regions. Additionally, one carbon star (IRC +10216) and one Mira variable star (R Leonis) were observed. A complete list of sources observed with the aforementioned setup is provided in Table 1.
3 Results
As noted in Table 1, some combination of emission or absorption was detected toward most of the 29 sources we observed in at least one of the main-line 6.0 GHz transitions. Sixteen of our sources had clearly detectable maser emission, and several of these sources also had detectable broad emission. Parameters of the Gaussian fits to the emission features are given in Table References.
Pairs of maser features that we identify as probable Zeeman splitting are listed in Table 3 along with implied values of the three-dimensional magnetic field strength. Maser Zeeman splitting also provides information on the line-of-sight direction of the magnetic field: positive field values indicate that the magnetic field points in the hemisphere away from the Sun and negative values toward the Sun. We identify Zeeman pairs in every source in which masers are positively detected with the exception of G5.8860.393, in which the only two masers we detect are at the same velocity to within the fit accuracy.
In order to check the consistency of our flux scale with previous studies, we have compared our absorption parameters with those of several other studies. We find that our flux scale is lower than that of Gardner & Martín-Pintado (1983a), mixed though on average slightly lower than Guilloteau et al. (1984), and slightly higher than B97, all of which used the Effelsberg 100 m telescope. Our detected absorption for G5.8860.393 is consistent with the flux densities measured in ATCA observations by Caswell (2001). Variability precludes the reliable use of maser fluxes as an independent check on flux calibration.
| Transition | |||
|---|---|---|---|
| Source | (MHz) | (km s-1) | (mG) |
| W3(OH)b | 6030 | 69.92 | 4.4 |
| 69.58 | 3.8 | ||
| Sgr B2M | 6030 | 65.54 | 4.8 |
| 70.42 | 5.4 | ||
| 71.90 | 8.0c | ||
| 6035 | 62.22 | 5.9 | |
| 63.42 | 5.7 | ||
| 64.82 | 7.1 | ||
| 67.18 | 6.9 | ||
| 70.45 | 6.9 | ||
| 70.83 | 7.3 | ||
| 71.94 | 10.8 | ||
| M17 | 6030 | 21.52 | 0.8 |
| 6035 | 21.41 | 0.8 | |
| G28.1990.048 | 6030 | 94.70 | 7.0 |
| 96.12 | 1.4 | ||
| 6035 | 94.70 | 7.0 | |
| 98.04 | 8.9 | ||
| W48 | 6035 | 42.95 | 0.7 |
| 43.30 | 0.9 | ||
| G45.1220.133 | 6030 | 53.70 | 4.8 |
| 54.33 | 4.5 | ||
| 6035 | 53.70 | 4.4 | |
| 54.27 | 4.0 | ||
| 55.45 | 1.2 | ||
| W51 e/d | 6030 | 52.53 | 5.1 |
| 53.15 | 5.1 | ||
| 6035 | 52.80 | 6.7 | |
| 55.33 | 4.6 | ||
| 55.81 | 9.1 | ||
| 57.59 | 5.5 | ||
| 63.11 | 2.3 | ||
| 64.04 | 4.0 | ||
| K3-50 | 6030 | 19.45 | 8.8 |
| 6035 | 19.53 | 8.7 | |
| 18.80 | 6.9 | ||
| ON 1 | 6030 | 0.16 | 13.5 |
| 13.99 | 4.8 | ||
| 6035 | 0.42 | 10.4c | |
| 0.12 | 12.8c | ||
| 0.79 | 11.1c | ||
| 1.53 | 5.3 | ||
| 1.96 | 5.2 | ||
| 13.91 | 3.8 | ||
| 14.49 | 0.8 | ||
| 15.30 | 5.0 | ||
| DR 20 | 6030 | 11.05 | 3.5 |
| 6035 | 11.10 | 3.0 | |
| 9.75 | 4.1 | ||
| W75 N | 6035 | 7.85 | 7.1 |
| 9.54 | 4.6 | ||
| W75 S | 6035 | 2.31 | 2.3 |
| 3.33 | 4.8 | ||
| LDN 1084 | 6035 | 62.72 | 4.1 |
| 61.48 | 0.9 | ||
| NGC 7538 | 6035 | 56.88 | 0.9 |
-
a
Systemic velocity ().
-
b
The spectra are complicated at velocities between and km s-1, and we cannot identify individual Zeeman pairs with any certainty. See Sect. 3.2.
-
c
Pairing ambiguity.
| Transition | Absorption | |||
|---|---|---|---|---|
| Source | (MHz) | (Jy) | (km s-1) | (km s-1) |
| W3 Cont | 6030 | 0.03 | 43.83 | 4.14 |
| 0.29 | 39.58 | 2.64 | ||
| 0.11 | 37.86 | 2.59 | ||
| 6035 | 0.03 | 43.45 | 4.05 | |
| 0.31 | 39.98 | 2.44 | ||
| 0.16 | 38.10 | 2.65 | ||
| G5.8860.393 | 6030 | 0.10 | 19.76 | 6.51 |
| 0.12 | 8.70 | 25.52 | ||
| 6035 | 0.13 | 18.63 | 10.49 | |
| 0.10 | 6.24 | 25.33 | ||
| G10.6240.385 | 6030 | 0.11 | 6.67 | 5.19 |
| 6035 | …a | … | … | |
| W48 | 6030 | 0.27 | 41.96 | 3.22 |
| 6035 | 0.26 | 42.08 | 3.05 | |
| G45.1220.133 | 6030 | 0.04 | 54.50 | 3.23 |
| 0.07 | 57.98 | 3.29 | ||
| 6035 | 0.08 | 58.17 | 3.61 | |
| W51 e/d | 6030 | 0.27 | 59.75 | 6.97 |
| 6035 | 0.22b | 60.22 | 6.36 | |
| K3-50 | 6030 | 0.12 | 25.21 | 7.84 |
| 0.08 | 24.60 | 4.00 | ||
| 6035 | 0.13 | 25.56 | 6.97 | |
| 0.08 | 24.39 | 3.70 | ||
| DR 21 | 6016 | 0.06 | 10.63 | 8.90 |
| 0.13 | 5.17 | 5.22 | ||
| 6030 | 0.05 | 13.61 | 2.25 | |
| 0.44 | 10.25 | 9.91 | ||
| 0.77 | 4.99 | 4.93 | ||
| 0.09 | 1.98 | 2.10 | ||
| 6035 | 0.05 | 13.64 | 2.08 | |
| 0.51 | 10.16 | 10.27 | ||
| 0.79 | 5.00 | 4.82 | ||
| 0.13 | 2.26 | 2.08 |
-
a
The low velocity wing of absorption is detected below km s-1, but maser contamination and low signal-to-noise preclude fitting this feature.
-
b
Region of absorption is heavily contaminated with emission, which may compromise accuracy of fit.
| Transition | ||
|---|---|---|
| Source | (MHz) | (mG) |
| W3 Cont | 6030 | |
| 6035 | ||
| DR 21 | 6030 | |
| 6035 | ||
| K3-50 | 6030 | |
| 6035 |
-
a
Values are upper limits on for nondetections.
-
b
Systematics may dominate. See Sect. 4.3 for details.
3.1 Absorption
Absorption features were detected toward eight sources, as listed in Table 4. In some sources, such as W51 e/d at 6035 MHz, the ability to fit absorption features is hampered by the presence of maser features in the same velocity region as the absorption. When the absorption is sufficiently strong and relatively uncontaminated by maser emission, normally two or even three Gaussian components are required to fit the absorption. This appears to be true at 13434 and 13441 MHz as well. When absorption is detected with sufficient signal-to-noise and spectral resolution, more than one Gaussian fit component is required (Fish, Reid, & Menten 2005).
As mentioned in Sect. 1, primary among our motivations for this work was to obtain magnetic field estimates in the absorbing OH material in high-mass star-forming regions. To this end, we selected three sources with strong absorption for deep integration: W3 Cont, DR 21, and K3-50. These sources are uncontaminated by maser emission, with the exception of the high-velocity wing of the absorption in K3-50.
The theory of Zeeman splitting in absorption is discussed in detail in the literature (e.g., Troland & Heiles 1982; Sault et al. 1990). The Stokes V spectrum is related to the derivative of the Stokes I spectrum via the equation
where and are the Stokes V and I flux densities, is the Zeeman splitting coefficient between the two -components, and is the strength of the line-of-sight component of the magnetic field. In principle, the Stokes V spectrum is simply half the difference of the LCP and RCP spectra. In practice, it is often the case that the LCP and RCP spectra have different gains. If this gain difference is not corrected for, the Stokes V spectrum will be dominated by a scaled version of the Stokes I spectrum. For each source and transition, we scaled one polarization to remove this effect. Note that this will not create a false detection. The derivative of Stokes I produces an “S-curve,” or adjacent positive and negative spectral features, which is duplicated in the Stokes V spectrum in the presence of a magnetic field. However, an incorrect scaling factor between the two circular polarizations will produce either a positive or a negative feature in Stokes V, but not both.
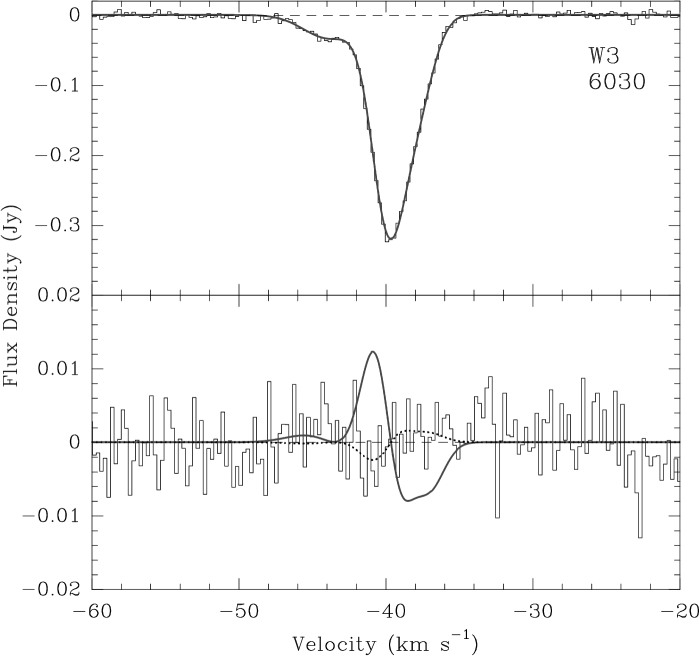
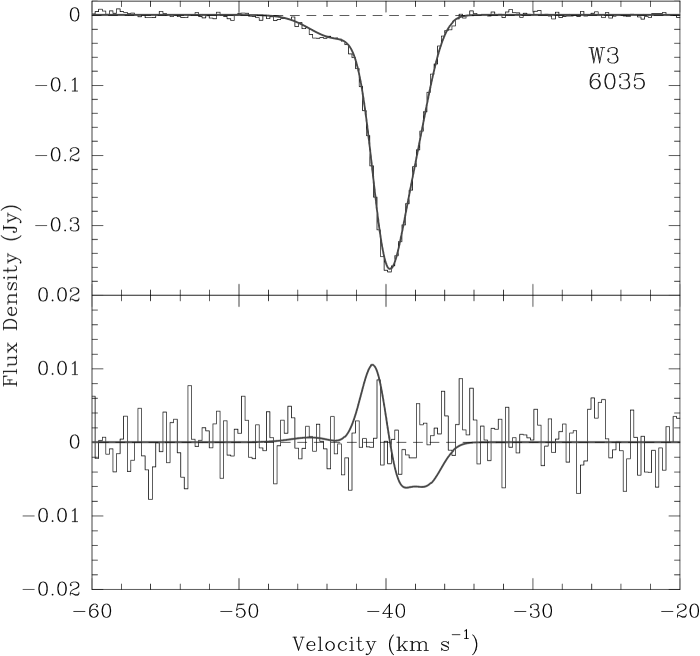
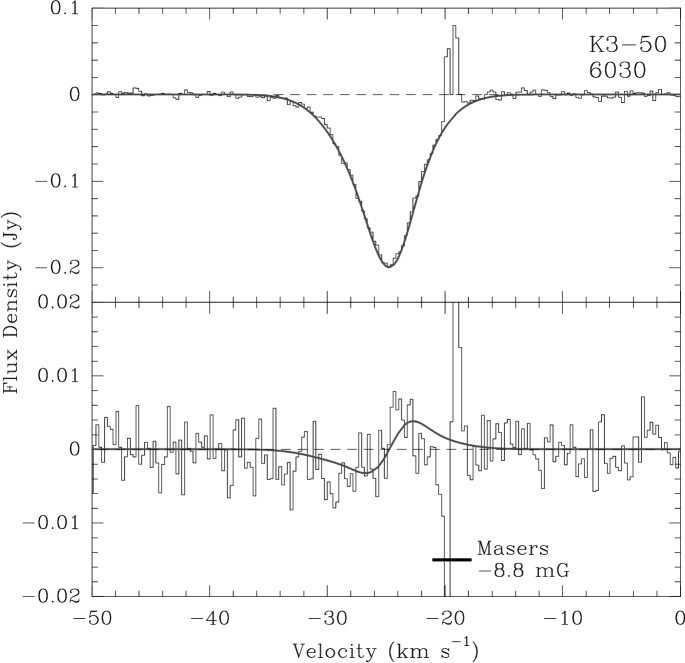
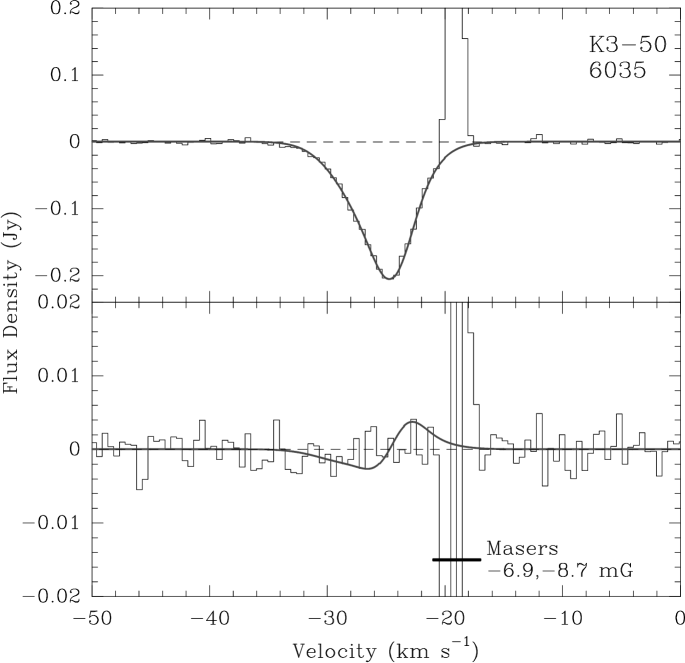
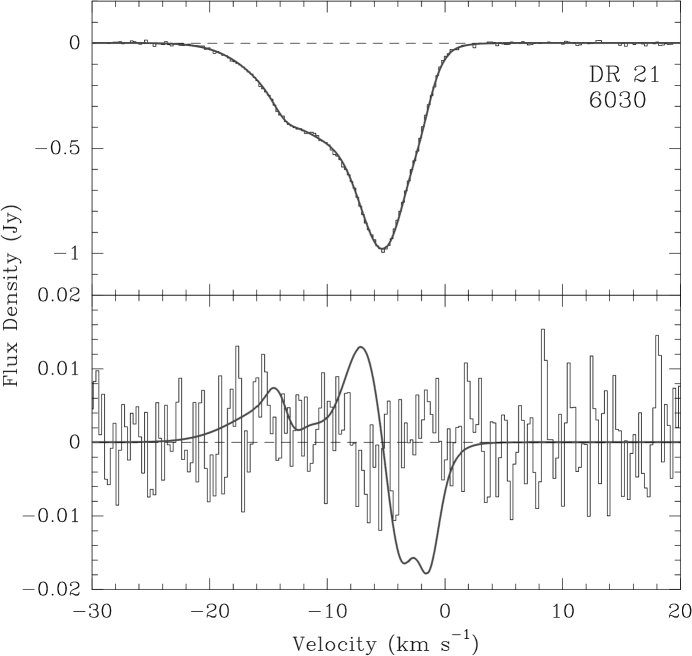
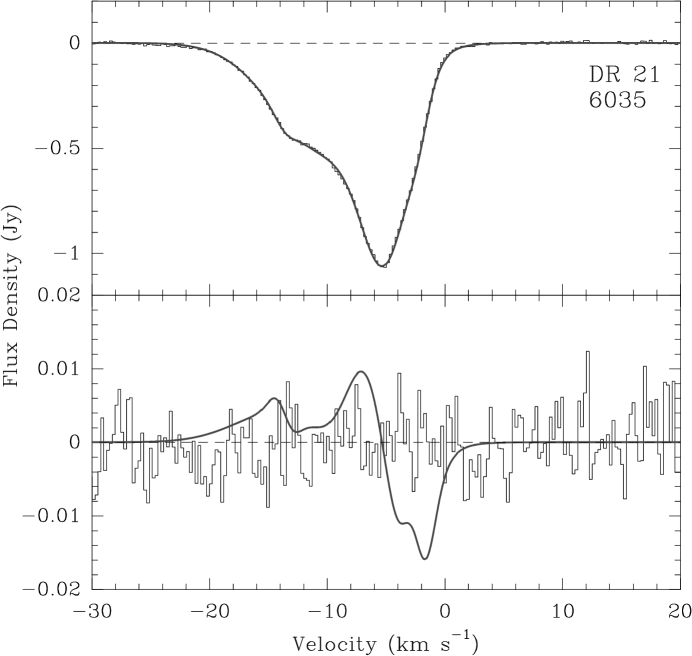
For each source, the magnetic field was determined by determining the best multiple-Gaussian fit to the Stokes I spectrum, computing the derivative of the fit, and least-squares fitting the resulting derivative to the Stokes V spectrum. Results are shown for W3 Cont in Figs. 1 and 2, K3-50 in Figs. 3 and 4, and for DR 21 in Figs. 5 and 6. The top panel of each plot shows the Stokes I spectrum along with the best-fit Gaussian parameters as listed in Table 4. The bottom panel of each plot shows the Stokes V spectrum as well as the derivative of the fits to the Stokes I spectrum. This derivative is scaled to fit the data for K3-50, in which a marginal positive result is obtained at 6030 MHz. (In this case, the derivative scaling factor and the RCP/LCP scaling factor were solved for simultaneously by least-squares fitting.) For the other sources the scaling is chosen in order to most clearly show the functional form of the derivative. Implied magnetic fields and upper limits are quoted in Table 5.
Up to four Gaussians were fit to each Stokes I absorption profile. Since absorption is produced by an integrated column density of molecules at different velocities, it is probable that Stokes I absorption profiles deviate from sums of a small number of pure Gaussians when observed with sufficient sensitivity. But the magnitude of the expected Stokes V profile due to Zeeman splitting is only a few percent of Stokes I. Thus, our magnetic field estimates are not highly sensitive to minor errors in fitting Stokes I profiles.
3.2 Source notes
For sources in large complexes of H ii regions, our pointing center is occasionally offset from the coordinates of the associated source in order for our 130″ beam to encompass several sources or a larger area of continuum flux. Exact pointing centers are listed in Table 1.
W3 Cont – The coordinates listed in Table 1 are approximate. To observe this source, we peaked up on the continuum nearest this position, located approximately 10″ away, which lies in the direction of component W3A in the labelling scheme of Harris & Wynn-Williams (1976). Absorption spectra are shown in Figs. 1 and 2. We find that 3 Gaussian components are required to fit the absorption. The velocities of the main absorption component in each transition agree generally with those of Gardner & Martín-Pintado (1983a), Guilloteau et al. (1984), and B97. Ground-state absorption at 1667 MHz is centered near km s-1 (Troland et al. 1989). Weak 4750 MHz emission as well as 4765 MHz masers are seen in the velocity range of absorption (Gardner & Martín-Pintado 1983b). We are able to obtain a upper limit of 0.5 mG on the line-of-sight component of the magnetic field in the absorbing OH material.
W3(OH) – Substantial ringing exists at 6035 MHz due to strong, narrow masers. Ringing is so substantial in RCP that the data must be Hanning weighted twice, degrading effective resolution to km s-1, or much broader than a typical maser linewidth. At this resolution, it is difficult to identify individual maser components and futile to attempt to identify Zeeman pairs. Even at 6030 MHz, where ringing is far less severe, overlap of maser components in the spectral domain precludes accurate fitting of maser components as well as unambiguous identification of Zeeman pairs. We refer the reader to previous interferometric work by Moran et al. (1978) and Desmurs et al. (1998) for more precise maser and Zeeman pair identification.
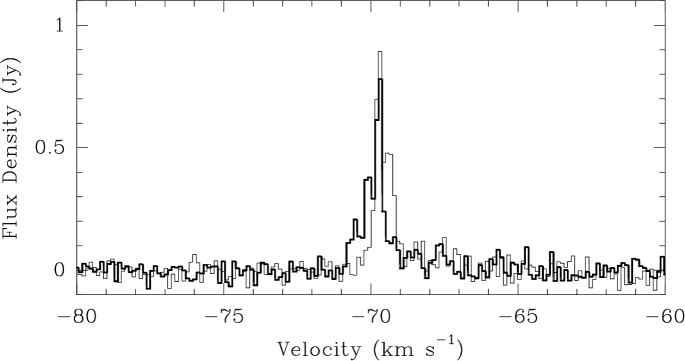
We find new maser features near km s-1 in the 6030 MHz transition, as shown in Fig. 7. It is unlikely that these masers are associated with the ultracompact H ii region of W3(OH). The masers around W3(OH) have radial velocities of km s-1 (e.g., Argon, Reid, & Menten 2000) and are observed to be expanding (Bloemhof, Reid, & Moran 1992) and rotating (Wright, Gray, & Diamond 2004a) at several km s-1, not tens of km s-1. The association of these masers with W3(OH) proper cannot be conclusively ruled out because former studies of W3(OH) have not had the velocity coverage to have detected a feature at km s-1. It is more plausible that these masers are associated with the Turner-Welch (TW) object located ″ east of W3(OH) (Turner & Welch 1984). This source is also located well within our 130″ beam, and the water masers span a velocity range of over 75 km s-1, including a feature at km s-1 (Cohen 1979). These 6030 MHz features are discussed in further detail in Sect. 4.1.
The detection of these OH masers at an unusual velocity prompted us to obtain follow-up exploratory observations of all four ground-state transitions of OH as well as the 4750 and 4765 MHz transitions with the VLA111The National Radio Astronomy Observatory is a facility of the National Science Foundation operated under cooperative agreement by Associated Universities, Inc.. We observed the ground-state transitions in 256 spectral channels of 3.052 kHz each and the excited-state transitions in 128 channels of 6.104 kHz each, giving us a velocity range of approximately 130 and 50 km s-1 centered at km s-1 for the ground-state and excited-state transitions, respectively. In no instance did we detect emission at km s-1 or at any other velocity outside the systemic range of velocities from approximately to km s-1. Our noise detection levels were approximately 60 to 75 mJy for all transitions.
Orion KL – The data are suggestive of a weak ( Jy) maser at km s-1 in both polarizations of the 6035 MHz transition, but the signal-to-noise ratio is too low to claim a detection. This velocity is consistent with the velocity of masers at 1665 MHz (e.g., Hansen et al. 1977). B97 do not make note of a detection in this source, although their 6035 MHz noise limits for Orion KL are better than ours by nearly a factor of two.
R Leo – No masers were detected in R Leo. The bright ( Jy) ground-state masers in this source disappeared in 2002 and have only reappeared as much weaker masers since (Lewis 2004).
Sgr B2M – Our spectra are qualitatively similar to those presented in Caswell & Vaile (1995) and Caswell (2003), although ringing effectively degrades our spectral resolution at 6035 MHz RCP. Caswell (2003) identifies a Zeeman pair of mG at km s-1 in his 6030 MHz data and finds similar magnetic fields in the high-velocity 6035 MHz data. All Zeeman pairs indicate a magnetic field pointing in the hemisphere toward the Sun, with the exception of a single Zeeman pair at km s-1, also noted by Caswell (2003). ATCA observations by Caswell (1997) indicate that the 6035 MHz masers trace two distinct H ii regions: features below km s-1 are associated with source G0.6660.035 (the bright continuum near the center of Sgr B2M), and features above this velocity with G0.6660.029 (the weaker continuum to the west of Sgr B2M).
Because Sgr B2M is a source with many maser features, it is probable that spatially-separated regions of maser emission at different velocities are blended together in our beam. Since we do not spatially resolve the emission, we cannot always identify Zeeman pairs unambiguously. For instance, the marked Zeeman pair in Table 3 consists of a feature at 72.21 km s-1 in LCP and 71.58 km s-1 in RCP. We choose this particular pairing over the other possibilities (71.99 or 72.43 km s-1 in RCP) in part because the sign and magnitude of the magnetic field more closely match those of the magnetic fields determined from other Zeeman pairs near this velocity, both at 6030 and 6035 MHz. But without interferometric mapping, we cannot be certain that this pairing is correct.
Sgr B2M was also observed for 36 min in a 20 MHz band centered near 5935 MHz. This frequency range includes both the 5934.644 () and 5938.967 MHz () main lines of 18OH as well as the 5938.901 MHz () line of 17OH. The dual-polarization noise in a Hanning-weighted 1.97 km s-1 channel was 7 mJy. The 5931.908 MHz () line of 17OH is also in this range but is unobservable due to extremely strong contamination from the H103 recombination line at 5931.545 MHz. No isotopomers of OH were detected. This is as expected, given a measurement of for the [16O]/[18O] ratio in this source in the ground state of OH (Whiteoak & Gardner 1981). The expected strength of 18OH features in Sgr B2M would be less than 1 mJy, assuming identical excitation temperatures for 16OH and 18OH. Since 17OH is even less abundant than 18OH, the 17OH lines would be weaker still (Valtz & Soglasnova 1973; Bujarrabal, Cernicharo, & Guélin 1983).
G5.8860.393 – Our spectra at both 6035 and 6030 MHz are similar to the spectrum provided by Caswell (2001). Our bandwidth spans an effective velocity range of nearly 250 km s-1, which allows us to obtain a good baseline even for the broad absorption features. Our data are consistent with the interpretation of the spectrum provided by Caswell.
G10.6240.385 – There are masers in both polarizations in the 6035 MHz transition in the velocity range from to km s-1. Poor signal-to-noise and the overlap of multiple maser components, especially in the upper half of this velocity range, prevent us from being able to fit these features. Caswell & Vaile (1995) and Caswell (2003) find weak 6035 MHz maser emission peaking at km s-1 in Stokes I, a conclusion which our data support. There is no clear Zeeman pattern, but if the peak of the RCP and LCP emission are interpreted as a Zeeman pair, the implied magnetic field is approximately mG, consistent in direction with and mG Zeeman pairs seen at 1667 MHz (Fish et al. 2005; Ruiz-Velasco et al. 2006). We detect absorption in both transitions, although maser contamination prevents a determination of fit parameters at 6035 MHz. In the (Matthews et al. 1986; Uchida, Fiebig, & Güsten 2001; Fish, Reid, & Menten 2005) and (Walmsley et al. 1986) transitions, absorption features are centered in the velocity range to km s-1, where 6035 MHz maser emission is strongest.
M17 – The autocorrelator saturated during observations due to high levels of continuum emission. Flux densities derived for masers in this source are of questionable accuracy, and we defer to the previous data of B97. As was sometimes seen in other scans with very high continuum fluxes, the 6035 MHz RCP spectrum was flipped (i.e., the continuum level was negative, and maser features were seen in “absorption”). This is clearly an instrumental artifact. It is not possible to obtain flux densities for these maser features, but the velocities at which the features appear would not be expected to be affected. The velocities in both polarizations are consistent with EVN maps of M17 (Desmurs & Baudry 1998). Additionally, we identify one Zeeman pair each at 6035 MHz and 6030 MHz at approximately the same velocity and with equal splitting ( mG). This too is consistent with Desmurs & Baudry, who find an upper limit of 1 mG for the magnetic field.
G28.1990.048 – This is one of only two sources in our survey in which we find a reversal of the line-of-sight direction of the magnetic field. Caswell (2003) find a Zeeman pair with approximately the same magnetic field and center velocity as the pairs we find at km s-1. They also find higher velocity features at 6030 MHz, although B97 do not.
W48 (G35.2001.736) – At 6035 MHz, half of the velocity range of absorption is contaminated by strong maser emission. The RCP spectrum is especially corrupted by ringing due to strong, narrow maser features near km s-1. B97 note similar problems in determining absorption fit parameters. Additionally, we detecte a weak 6035 MHz maser in both polarizations coincident with the low-velocity wing of the absorption. Our spectra are similar to those of Caswell (2003), although the Caswell 6035 MHz spectrum does not include the weak maser features near 40.3 km s-1, whose LCP peak flux density is half that of the 44.2 km s-1 feature, clearly visible in the Caswell spectrum. Strong variability of this latter feature has been noted by Caswell (2001, 2003). The 40.3 km s-1 must have been weaker by a factor of several in 2001 May and previous epochs.
G45.1220.133 – As with Caswell (2003), we find a consistent Zeeman pattern at 6030 and 6035 MHz. For most of the Zeeman pairs our data suggest a stronger magnetic field ( mG) compared to the mG determined by Caswell. But precise determination of the magnetic field strength, if indeed a single magnetic field strength is responsible for the Zeeman pairs at and km s-1, is complicated by spectral blending of maser spots of comparable flux density. The velocity and width of the 6030 MHz absorption agrees with a previous detection by Guilloteau et al. (1984) to within their errors. Matthews et al. (1986) and Baudry & Desmurs (2002) also detect absorption at 13434 and 13441 MHz in approximately the same velocity range.
W51 e/d – As with B97, our pointing center lies between sources e and d. We find eight Zeeman pairs each indicating a magnetic field pointing in the hemisphere away from the Sun. This is consistent with B97 and Desmurs & Baudry (1998), who each find one Zeeman pair in 6035 MHz indicating a positive magnetic field. We identify Zeeman pairs at or near the velocities of these features. A pair of features at 6030 MHz in the B97 survey centered at km s-1 with a splitting of mG is broadly consistent with a Zeeman pair of identical magnitude that we detect at km s-1. Absorption parameters are consistent with those of Guilloteau et al. (1984) at 6030 MHz. For comparison, the 13434 and 13441 MHz absorption is much narrower and redshifted by 3 to 4 km s-1 (Baudry & Desmurs 2002).
K3-50 – Three Zeeman pairs are detected, all indicating a negative magnetic field. This is consistent with 1665 and 1667 MHz maser mapping (Fish et al. 2005). Previous observations have detected a single absorption component at 6030 and 6035 MHz as well as in higher transitions in the ladder (Guilloteau et al. 1984; Walmsley et al. 1986; Baudry & Desmurs 2002). We find that a single Gaussian component is inadequate to fit our observed absorption, although two components provide an excellent fit. The 6030 and 6035 MHz spectra of Guilloteau et al. did not have sufficient signal-to-noise to permit the detection of the weaker component. We detect a magnetic field of mG in the 6030 MHz absorption (Fig. 3), but we do not detect a magnetic field in the 6035 MHz absorption (Fig. 4).
ON 1 – All Zeeman pairs in ON 1 indicate a negative magnetic field, consistent with results in ground-state transitions (e.g., Fish et al. 2005). Consistent with prior 6030 and 6035 MHz (B97) and 13441 MHz (Baudry & Desmurs 2002; Fish, Reid, & Menten 2005) observations, most masers appear near two systemic velocities: 0 and km s-1. Additionally, we detect weak masers at intermediate velocities (5.5 and 7.7 km s-1) at 6035 MHz.
DR 20 (G80.8640.421) – Moderate spectral ringing is seen in 6035 MHz. It is possible that there is another weak feature in both RCP and LCP at slightly higher velocity than the strongest maser feature, but there is insufficient resolution to claim detection after Hanning weighting. The masers identified by B97 are in excellent agreement with this work.
W75 N – As B97, we find a Zeeman pair with a magnetic field splitting of slightly over mG. We also detect a Zeeman pair centered near km s-1 implying a field splitting of mG. Interferometric maps at 1665 and 1667 MHz show masers aligned along two axes, with negative magnetic fields in the east-west axis and positive fields in the north-south axis (e.g., Fish et al. 2005). The magnetic fields measured at 6035 MHz suggest that the excited-state masers appear predominantly in the latter structure, probably associated with continuum source VLA 1.
W75 S – We detect several features near km s-1, including a Zeeman pair implying a magnetic field of mG, not previously detected by B97. In the 1665 and 1667 MHz transitions, there is a reversal of the line-of-sight direction of the magnetic field across the source, with positive magnetic fields to the west and negative magnetic fields to the east of the weak continuum source (Fish et al. 2005). This suggests that the Zeeman pairs, which imply negative magnetic fields, may also be located to the east. We do not detect the possible feature they see at km s-1 in 6030 MHz RCP.
DR 21 – The strongest absorption components we detect are qualitatively consistent with previous results by Guilloteau et al. (1984), who also find two absorption components in each of the main-line transitions: a feature near km s-1 and a slightly broader feature near km s-1 that is weaker by a factor of two. Spectra of Stokes I and V for the 6030 and 6035 MHz transitions are shown in Figs. 5 and 6, respectively. Matthews et al. (1986) find absorption at 13434 and 13441 MHz at the velocity of the stronger absorption component, while Walmsley et al. (1986) see 23826 MHz absorption at km s-1. At 6016 MHz, Gardner & Martín-Pintado (1983a) also see two absorption components.
LDN 1084 – We identify two Zeeman pairs indicating magnetic fields of and mG in the 6035 MHz transition. B97 detect two 6035 MHz masers in opposite polarizations. Interpreted as a Zeeman pair, they would imply a magnetic field of mG centered at km s-1. The sign of this field would be consistent with our findings.
S140 – B97 detect a Zeeman pair of masers of flux density 0.4 Jy and width 0.20 km s-1 at 6035 MHz. Neither these features nor any others are present in our spectra. Our noise level in a Hanning-weighted 0.243 km s-1 channel is 13 mJy.
Cep A – We detect no maser emission in either transition to a limit of 34 mJy in a Hanning-weighted 0.243 km s-1 channel. B97 detect multiple maser lines with flux densities of 0.1 to 0.6 Jy, including two Zeeman pairs in the 6035 MHz transition.
NGC 7538 – Our identification of a mG Zeeman pair is consistent with observations at 1665 MHz, in which a single Zeeman pair of mG is detected (Fish et al. 2005). However, previous observations have found Zeeman pairs with the opposite sense of polarization (e.g., Lo et al. 1975). In ground-state transitions, Hutawarakorn & Cohen (2003) identify two Zeeman pairs of and mG in source IRS 1, the pointing center of observations. They also find three Zeeman pairs with a line-of-sight magnetic field reversal in IRS 11, located approximately half a beamwidth away from our pointing center.
4 Discussion
4.1 6030 and 6035 MHz maser statistics
We detect 6035 MHz masers in 16 sources and 6030 MHz masers in 11 of these. In all cases, the 6035 MHz masers are stronger than the 6030 MHz masers, whether measured in terms of the strongest maser component or as an integrated flux of all maser spots in a transition. In nearly all cases when a 6030 MHz maser is observed, a stronger 6035 MHz maser is seen at approximately the same velocity, consistent with B97 and observations by Caswell (2003) of southern hemisphere sources. Diverse theoretical models agree that the set of parameter space conducive to 6030 MHz maser action is almost wholly a subset of that conducive to 6035 MHz maser action and that 6030 MHz masers should almost always be weaker than their 6035 MHz counterparts (e.g., Gray, Field, & Doel 1992; Pavlakis & Kylafis 2000; Cragg, Sobolev, & Godfrey 2002).
However, the 6030 MHz features near km s-1 in W3(OH) have no counterpart at 6035 MHz. Theoretical models by Pavlakis & Kylafis (2000) suggest that the presence of 6030 MHz without corresponding 6035 MHz maser emission is indicative of a velocity gradient greater than 1 km s-1. This suggests that the low-velocity 6030 MHz masers may not be associated with the main ultracompact H ii region in W3(OH), for which the turbulence is estimated to have a FHWM of 0.8 km s-1 from the spatial and velocity distribution of ground-state OH masers (Reid et al. 1980). For comparison, the turbulent component of the velocity field of the water masers in the bipolar outflow from the TW object is km s-1 (Alcolea et al. 1993). Pavlakis & Kylafis also predict that 1665 MHz masers should be seen in regions containing 6030 but not 6035 MHz masers. But no ground-state maser emission in any transition is seen at km s-1. It is possible that current maser models are insufficient to explain the appearance of masers at 6030 MHz with no corresponding features in another OH transition.
4.2 Zeeman pairs
As with any single-dish study of OH masers, one must be careful interpreting spectral offsets as Zeeman pairs. In the 1665 and 1667 MHz transitions, the Zeeman splitting is large (0.590 and 0.354 km s-1 mG-1 respectively), and a typical magnetic field of several milligauss will split the two -components by many linewidths. Velocity coherence of the amplifying material usually favors one -component over the other, resulting in Zeeman pairs of very unequal amplitude or the detection of only a single -component (Cook 1966). Since high-mass star-forming regions with OH masers frequently have many masers, including multiple masers at the same velocity, single-dish efforts at identifying maser pairs are generally inadequate. In practice, even connected-element interferometry provides insufficient spatial resolution to identify Zeeman pairs in the ground-state main-line transitions (e.g., compare sources in common between Fish et al. 2003 and Fish et al. 2005). At 6030 and 6035 MHz, the smaller Zeeman coefficients (0.0790 and 0.0564 km s-1 mG-1 respectively) result in -components that are usually separated by less than 0.8 km s-1, the turbulent dispersion inferred from maser clusters for W3(OH) (Reid et al. 1980). Thus, it is expected that amplification of both -components of a Zeeman pair occurs with similar gain, a hypothesis supported by the more equal ratio of flux densities in the components of a 6.0 GHz Zeeman pair as compared with ground-state Zeeman pairs.
On the other hand, the dearth of sources observed at 6.0 GHz at milliarcsecond resolution make it difficult to determine whether this hypothesis is justified. To date, only four published sources have been mapped at 6030 and/or 6035 MHz: W3(OH) (Desmurs et al. 1998), M17, ON 1, and W51 (Desmurs & Baudry 1998, for the latter three). In W3(OH), multiple strong, spatially-separated maser features in the same polarization and transition were often seen at the same velocity. Desmurs et al. find 37 Zeeman pairs and several unpaired maser components at 6030 and 6035 MHz between and km s-1. The ratio of fluxes between the two -components rarely exceeds two and never exceeds three. Magnetic fields thus measured range from to mG. Clearly, single-dish observations of W3(OH) are insufficient in making sense of such rich maser fields. In the other three sources, Desmurs & Baudry find far fewer maser spots and Zeeman pairs than we do due to a high detection limit (0.4 Jy beam-1). Even in ON 1, in which only four 6035 MHz RCP masers are detected with the EVN, there is evidence that spatially-separated maser features overlap in velocity.
From this, it seems reasonable to conclude that single-dish Zeeman pairing at 6030 and 6035 MHz is trustworthy in spectrally uncomplicated fields with comparable flux densities in opposite circular polarizations, such as LDN 1084. It is probable that sources with numerous overlapping maser components, such as Sgr B2M and ON 1, have many more Zeeman pairs than identified here. Additionally, ambiguities may cause misidentification of which maser components constitute a Zeeman pair. Judgment on the reliability of Zeeman pairs in cases intermediate to these extremes awaits confirmation from interferometric mapping.
4.3 Zeeman splitting in absorption
4.3.1 K3-50
K3-50 is the only source in which we obtain a marginal positive detection of a magnetic field in absorption. We measure the magnetic field to be mG in absorption in the 6030 MHz transition. At 6035 MHz we obtain an upper limit () of 0.9 mG. The previous upper limit on the magnetic field strength in absorption was 2.9 mG from 13441 MHz observations (Fish, Reid, & Menten 2005).
Given the low signal-to-noise ratio of the 6030 MHz detection and the lack of a detection at 6035 MHz, it is possible that the positive detection at 6030 MHz is due to a systematic error. One possible source of error is an incorrect spectral baseline in one or both circular polarizations. As mentioned in Sect. 2, spurious instrumental effects mimicking absorption were occasionally seen in the 6030 MHz LCP spectra; while such cases were usually easily identifiable, it is possible that the some LCP scans are contaminated by similar instrumental effects too weak to be detected in a single 6-minute scan.
VLBA maps of the 1665 and 1667 MHz OH masers in K3-50 find six Zeeman pairs: five implying full three-dimensional field strengths of to mG to the north and east of the H ii region, and one implying a magnetic field of mG projected atop the northern portion of the H ii region (Fish et al. 2005). In the 6030 and 6035 MHz transitions, Zeeman pairs indicate magnetic fields of to mG (B97 and this work). Thus, all OH maser data point to a negative magnetic field in the region sampled by the masers. However, in the absence of an interferometric map of the positions of the 6.0 GHz masers, only one Zeeman pair is known to be located in projection atop the H ii region. Without magnetic field measurements in the western and southern portions of the source, it is unknown whether there is a reversal of the line-of-sight direction of the magnetic field across the source. If there is, the magnetic field strength measured in OH absorption would be an average value and would therefore underestimate the actual line-of-sight magnetic field strength. Therefore, it is difficult to compare directly the magnetic field strength measured in OH absorption with the field strength derived from maser Zeeman splitting.
It is important to note that the interpretation of the Stokes V flux in K3-50 as due to Zeeman splitting is predicated upon the assumption that the OH absorption is thermal and unpolarized. Verschuur (1996) finds evidence that some sources may have weak, nonthermal, partially polarized absorption components which could lead to the erroneous estimates of magnetic field strength. A more definitive detection of Stokes V, as well as a sensitive interferometric map of 6030 MHz absorption, may be necessary to convincingly link our Stokes V detection to a magnetic field estimate.
4.3.2 W3 Cont and DR 21
We obtain upper limits for the line-of-sight component of the magnetic field in two sources: W3 Cont and DR 21. In each case, the observations are consistent with an upper limit on the coherent line-of-sight magnetic field strength of about half a milligauss. Note that the upper limits assume that the magnetic field is constant across the source. This may be an incorrect assumption; the different Gaussian absorption components likely correspond to physically distinct clouds of material, each of which may have a different average magnetic field strength and orientation. Nevertheless, it does not seem warranted to attempt to fit derivatives of individual Gaussian absorption components scaled to different magnetic fields when the measurement of Stokes V is consistent with zero, as is the case for most of our spectra.
While the formal upper limit on the line-of-sight magnetic field strength is 0.3 mG in the 6030 MHz transition in DR 21, the noise is likely dominated by systematic effects. Unlike in W3 Cont or K3-50, or indeed even in the 6035 MHz transition in DR 21, it was not possible to find a scaling constant such that Stokes V was flat or proportional to the derivative of Stokes I in the velocity region of absorption. This could be due to two effects. First, the total absorbing region is fairly wide ( km s-1), so it is possible that the baselines of the LCP and RCP spectra are not determined to high enough accuracy in the region of interest. Second, as noted in Sect. 2, low-level artifacts resembling absorption features occasionally appeared at 6030 MHz RCP. Because the actual absorption in DR 21 is so strong ( Jy), the presence of spurious instrumental absorption features at coincident velocity may have escaped our detection. In fact, nearly one-third of the 6030 MHz DR 21 scans (representing all scans on source on one day) were discarded because the LCP and RCP absorption shapes were qualitatively different near km s-1.
Zeeman splitting is detected in H i absorption in several different subregions of DR 21, implying an average magnetic field of approximately mG (Roberts, Dickel, & Goss 1997). The velocity range of the Zeeman-split H i features is generally coincident with the velocity range in which excited-state OH absorption is detected. They detect three components in H i: a broad negative wing between and km s-1, roughly corresponding to the broad absorption component we detect; a narrow feature near km s-1 with a FWHM of km s-1, corresponding to an absorption component we detect with similar parameters; and a narrow absorption component near km s-1, which we do not detect at all. The magnetic field is most strongly detected in H i absorption in the outflow in the range of velocities between and km s-1. The number density in the outflow is probably between and cm-3 (e.g., Garden et al. 1991). For comparison, the number density in the OH absorption region exceeds cm-3 (Jones et al. 1994). For any reasonable scaling of with , the magnetic field should be detectable in OH absorption.
Why then do we detect no magnetic field on a submilligauss level toward DR 21? One possibility is that multiple sources are blended together within our beam. DR 21 is composed of several condensations (e.g., Harris 1973), although the most of the continuum flux comes from regions A, B, and C, which are near the head of one of the cometary H ii regions (see Fig. 1 of Cyganowski et al. 2003). It is possible that there exists one or more reversals of the line-of-sight direction of the magnetic field across DR 21 which are being blended together in our beam. Our beam is much larger than the 10″ effective resolution of Roberts, Dickel, & Goss, and it is possible that areas of different magnetic field strength are blended together in our beam. However, Roberts, Dickel, & Goss obtain positive detections of the magnetic field strength at several locations within DR 21 and find that the magnetic field is everywhere consistent with being mG.
As for W3 Cont, the largest negative and positive magnetic field strengths measured in H i are G and G between W3 A and W3 B (Roberts et al. 1993), measured in the km s-1 velocity component. Crutcher (1999) also reports an H i measurement of 400 G, which is below our detectability limit. We detect strong OH absorption near this velocity and almost no absorption at km s-1, the other velocity for which Roberts et al. obtain H i Zeeman measurements. Toward the strongest continuum source (W3 A), they obtain a magnetic field estimate of G. All of these values are well below our detection threshold, although the excited OH traces regions of higher density and therefore likely higher magnetic field. Nevertheless, the line-of-sight magnetic field reversal between different sources in our beam would serve to diminish the signal in Stokes V.
There are no OH maser measurements of the magnetic field in W3 Cont or DR 21. No masers have been detected in DR 21. Weak 1665 MHz masers have been detected in the W3 source G133.7151.215 (Argon, Reid, & Menten 2000). If interpreted as a Zeeman pair, the masers near the origin in the Argon, Reid, & Menten map indicate a magnetic field strength of mG, which is below our detection threshold. For neither of these sources then can we comment on the clumpiness of the material through comparison of with .
4.4 Are masers overdense?
In general, OH masers exist in environments of higher magnetic field strengths and have narrower line widths than OH absorption. Thus, in practice, OH maser Zeeman splitting is sensitive to the full, three-dimensional magnetic field strength, while absorption Zeeman splitting is only sensitive to the line-of-sight component thereof. Theoretically, the inclination of the magnetic field to the line of sight at an OH maser site can be estimated from the linear polarization fraction of the maser radiation (Goldreich, Keeley, & Kwan 1973). The ground-state OH masers that are projected atop the H ii region in K3-50 have no detected linear polarization, naïvely suggesting that the local magnetic field lies entirely in the plane of the sky (i.e., that the line-of-sight component of the magnetic field is zero). However, the large percentage of maser spots with no detectable linear polarization (e.g., Fish et al. 2005) suggests that OH masers preferentially amplify circularly-polarized radiation, a result supported by diverse theoretical simulations (e.g., Nedoluha & Watson 1990; Gray & Field 1994; Elitzur 1996). In this case, magnetic field inclinations derived from linear polarization fractions may be misleading. In fact, interpretation of the linear polarization from ground-state OH masers may be impossible in some sources (Fish & Reid 2006).
There are now three sources with magnetic field estimates or upper limits from OH absorption that are lower than the magnetic field determined from OH maser Zeeman splitting: K3-50, W3(OH), and G10.6240.385 (Güsten, Fiebig, & Uchida 1994; Uchida, Fiebig, & Güsten 2001; Fish, Reid, & Menten 2005). In each case the line-of-sight field strength () is significantly less than of the three-dimensional field strength () derived from masers projected atop the continuum emission; this is the value that would be expected if the magnetic field in these regions were uniform and randomly oriented. If magnetic beaming is important for preferential amplification of -components of OH masers (Gray & Field 1994), it is likely that at maser sites.
Assuming that an increased magnetic field strength indicates increased density, it is likely that the density at OH maser sites is higher than that of the surrounding material. This is consistent with observations of ammonia in massive star-forming regions. Ammonia absorption in G10.60.4 shows two components: a fairly uniform component of low column density and a clumpy component of higher column density (Sollins & Ho 2005). Observations of W3(OH) suggest that ammonia and OH are cospatially distributed in a clumpy molecular envelope (Reid, Myers, & Bieging 1987). Their observations support an interclump-to-clump density ratio of , which would imply an interclump-to-clump magnetic field strength ratio of assuming that scales as (Crutcher 1999). Combining with the projection effect, we would predict that as measured in the absorbing material would be between 0.4 and 0.7 times measured from OH masers. This is consistent with results for W3(OH) (Güsten, Fiebig, & Uchida 1994; Fish, Reid, & Menten 2005). as measured in absorption appears to be even less than 0.4 times as measured from Zeeman splitting in G10.6240.385 (Fish, Reid, & Menten 2005) and K3-50 (this work), but the magnetic field in front of the UCH ii region is poorly sampled by OH masers in both of these sources. Single-dish absorption studies are sensitive only to the average value of in the absorbing material, weighted by OH density. If the magnetic field strength is variable or if there is a reversal of the line-of-sight direction of the field across the source, absorption measurements of may be significantly smaller than derived from a single maser Zeeman pair.
Theoretical models support our conclusion that the single most important physical factor discriminating between OH absorption and maser emission is the density of the material. Cesaroni & Walmsley (1991) find that OH can undergo a sharp change from strong absorption to strong maser emission with a small change in density. For most transitions the critical density is between and cm-3 and the excitation temperature changes from (efficient absorption) to (near maximum inversion) when the density () changes by less than a factor of two across this value. Cesaroni & Walmsley find that thermalization occurs at several cm-3, and OH will be seen in absorption above this density. Their results are sensitive to the presence of dust; for instance, is negative for two disjoint ranges of density for the 1667 MHz transition. Pavlakis & Kylafis (1996, 2000) explore a larger range of physical conditions and find qualitatively similar maser behavior.
While observations of K3-50, W3(OH), and G10.6240.385 argue strongly for masers being overdense as compared to the OH seen in absorption, the picture in DR 21 is less clear. The best-fit density ( – cm-3) derived by Jones et al. (1994) for DR 21 is difficult to reconcile with the low upper limit on the magnetic field strength that we calculate from OH ( mG) and that Roberts, Dickel, & Goss (1997) calculate from H i ( mG). If the magnetic field strength scales as (Crutcher 1999), we would expect a magnetic field strength at least ten times greater than this value. Furthermore, it is unclear why OH at this density would be seen in absorption. The models of Cesaroni & Walmsley (1991), which assume a ratio of OH/H2 consistent with the Jones et al. (1994) results and a dust temperature only marginally higher than Jones et al., indicate that many lines of OH, including the 6035 MHz transition, should be inverted in this density range. In contrast, only the 4.7 GHz () lines are seen in weak, broad emission (Gardner & Martín-Pintado 1983b), while all other detected transitions are seen in absorption (see Jones et al. 1994). The large compact (as opposed to ultracompact) H ii regions in DR 21 argue for a density that is too low to sustain OH maser emission or detectable OH absorption Zeeman splitting.
The significance of the density contrast between masers and the ambient medium cannot be overstated. Since masers are overdense clumps of material, their observed proper motions can reliably be interpreted as material motions. Maser proper motions have been an important tool both in measuring material motions in sources (e.g., Bloemhof, Reid, & Moran 1992) as well as for obtaining geometric parallaxes independent of Galactic rotation curves (Hachisuka et al. 2006) and the cosmic distance scale (Herrnstein et al. 1999; Brunthaler et al. 2005). Were masers the result of chance lines of coherence due to random velocity fluctuations in an otherwise homogeneous medium (Deguchi 1982), observed proper motions could very well be unrelated to physical motions of material. Our results suggest that masers occur in higher-density clumps of material. While we cannot rule out the possibility of beam averaging of opposite senses of the magnetic field in some sources, our results are consistent with the interpretation of the magnetic field derived from OH absorption in W3(OH) (Güsten, Fiebig, & Uchida 1994; Fish, Reid, & Menten 2005), a source whose magnetic field is well sampled by OH masers (Wright, Gray, & Diamond 2004b). Combined with the observed persistence of maser spot shapes between epochs (Bloemhof, Moran, & Reid 1996), our results constitute strong evidence that maser proper motions do indeed indicate real, material motions.
5 Conclusions
We have observed 29 sources, primarily high-mass star forming regions, in order to detect 6030 and 6035 MHz OH absorption and emission. We find maser emission in 16 sources and absorption in 8. When 6030 MHz maser emission is seen, it is almost always accompanied by stronger 6035 MHz maser emission. However, W3(OH) exhibits an unexplained weak 6030 MHz maser at km s-1 that appears to be unaccompanied by maser emission at 6035 MHz, any of the four ground-state transitions, or two of the transitions.
We have taken significantly long observations of three sources with strong absorption to place submilligauss upper limits () on the average line-of-sight magnetic field strength. We are able to obtain a weak tentative detection of mG in the 6030 MHz transition of K3-50, although our upper limit in the 6035 MHz transition is lower than this value. Consistent with observations in the 13.4 GHz main-line transitions of OH (Fish, Reid, & Menten 2005), the line-of-sight magnetic field strengths measured in OH absorption are significantly lower than would be expected from random orientation of the field, given three-dimensional magnetic field strengths measured in OH masers. Since the magnetic field strength is correlated with density, this provides strong evidence that OH masers occur in regions of enhanced density. We conclude that maser proper motions are a reliable indicator of physical material motions.
Acknowledgements.
Based on observations with the 100 m telescope of the MPIfR (Max-Planck-Institut für Radioastronomie) at Effelsberg.References
- Alcolea et al. (1993) Alcolea, J., Menten, K. M., Moran, J. M., & Reid, M. J. 1993, LNP Vol. 412: Astrophysical Masers, 412, 225
- Argon, Reid, & Menten (2000) Argon, A. L., Reid, M. J., & Menten, K. M. 2000, ApJS, 129, 159
- Baudry & Desmurs (2002) Baudry, A., & Desmurs, J. F. 2002, A&A, 394, 107
- Baudry et al. (1997) Baudry, A., Desmurs, J. F., Wilson, T. L., & Cohen, R. J. 1997, A&A, 325, 255 (B97)
- Bloemhof, Moran, & Reid (1996) Bloemhof, E. E., Moran, J. M., & Reid, M. J. 1996, ApJ, 467, L117
- Bloemhof, Reid, & Moran (1992) Bloemhof, E. E., Reid, M. J., & Moran, J. M. 1992, ApJ, 397, 500
- Brunthaler et al. (2005) Brunthaler, A., Reid, M. J., Falcke, H., Greenhill, L. J., & Henkel, C. 2005, Science, 307, 1440
- Bujarrabal, Cernicharo, & Guélin (1983) Bujarrabal, V., Cernicharo, J., & Guélin, M. 1983, A&A, 128, 355
- Caswell (1997) Caswell, J. L. 1997, MNRAS, 289, 203
- Caswell (2001) Caswell, J. L. 2001, MNRAS, 326, 805
- Caswell (2003) Caswell, J. L. 2003, MNRAS, 341, 551
- Caswell & Vaile (1995) Caswell, J. L., & Vaile, R. A. 1995, MNRAS, 273, 328
- Cesaroni & Walmsley (1991) Cesaroni, R., & Walmsley, C. M. 1991, A&A, 241, 537
- Cohen (1979) Cohen, N. L. 1979, Astrophys. Lett., 20, 81
- Cook (1966) Cook, A. H. 1966, Nature, 211, 503
- Cragg, Sobolev, & Godfrey (2002) Cragg, D. M., Sobolev, A. M., & Godfrey, P. D. 2002, MNRAS, 331, 521
- Crutcher (1999) Crutcher, R. M. 1999, ApJ, 520, 706
- Cyganowski et al. (2003) Cyganowski, C. J., Reid, M. J., Fish, V. L., & Ho, P. T. P. 2003, ApJ, 596, 344
- Deguchi (1982) Deguchi, S. 1982, ApJ, 259, 634
- Desmurs & Baudry (1998) Desmurs, J. F., & Baudry, A. 1998, A&A, 340, 521
- Desmurs et al. (1998) Desmurs, J. F., Baudry, A., Wilson, T. L., Cohen, R. J., & Tofani, G. 1998, A&A, 334, 1085
- Elitzur (1996) Elitzur, M. 1996, ApJ, 457, 415
- Fiedler & Mouschovias (1993) Fiedler, R. A., & Mouschovias, T. Ch. 1993, ApJ, 415, 680
- Fish & Reid (2006) Fish, V. L., & Reid, M. J. 2006, ApJS, 164, 99
- Fish et al. (2003) Fish, V. L., Reid, M. J., Argon, A. L., & Menten, K. M. 2003, ApJ, 596, 328
- Fish et al. (2005) Fish, V. L., Reid, M. J., Argon, A. L., & Zheng, X.-W. 2005, ApJS, 160, 220
- Fish, Reid, & Menten (2005) Fish, V. L., Reid, M. J., & Menten, K. M. 2005, ApJ, 623, 269
- Garden et al. (1991) Garden, R. P., Hayashi, M., Hasegawa, T., Gatley, I., & Kaifu, N. 1991, ApJ, 374, 540
- Gardner & Martín-Pintado (1983a) Gardner, F. F., & Martín-Pintado, J. 1983, MNRAS, 204, 709
- Gardner & Martín-Pintado (1983b) Gardner, F. F., & Martín-Pintado, J. 1983, A&A, 121, 265
- Goldreich, Keeley, & Kwan (1973) Goldreich, P., Keeley, D. A., & Kwan, J. Y. 1973, ApJ, 179, 111
- Gray & Field (1994) Gray, M. D., & Field, D. 1994, A&A, 292, 693
- Gray, Field, & Doel (1992) Gray, M. D., Field, D., & Doel, R. C. 1992, A&A, 262, 555
- Guilloteau et al. (1984) Guilloteau, S., Baudry, A., Walmsley, C. M., Wilson, T. L., & Winnberg, A. 1984, A&A, 131, 45
- Güsten, Fiebig, & Uchida (1994) Güsten, R., Fiebig, D., & Uchida, K. I. 1994, A&A, 286, L51
- Hachisuka et al. (2006) Hachisuka, K. et al. 2006, ApJ, in press, astro-ph/0512226
- Hansen et al. (1977) Hansen, S. S., Moran, J. M., Reid, M. J., Johnston, K. J., Spencer, J. H., & Walker, R. C. 1977, ApJ, 218, L65
- Harris (1973) Harris, S. 1973, MNRAS, 162, 5P
- Harris & Wynn-Williams (1976) Harris, S., & Wynn-Williams, C. G. 1976, MNRAS, 174, 649
- Herrnstein et al. (1999) Herrnstein, J. R., et al. 1999, Nature, 400, 539
- Hutawarakorn & Cohen (2003) Hutawarakorn, B., & Cohen, R. J. 2003, MNRAS, 345, 175
- Jones et al. (1994) Jones, K. N., Field, D., Gray, M. D., & Walker, R. N. F. 1994, A&A, 288, 581
- Lewis (2004) Lewis, B. M. 2004, BAAS, 36, 1358
- Lo et al. (1975) Lo, K. Y., Walker, R. C., Burke, B. F., Moran, J. M., Johnston, K. J., & Ewing, M. S. 1975, ApJ, 202, 650
- Matthews et al. (1986) Matthews, H. E., Baudry, A., Guilloteau, S., & Winnberg, A. 1986, A&A, 163, 177
- Moran et al. (1978) Moran, J. M., Reid, M. J., Lada, C. J., Yen, J. L., Johnston, K. J., & Spencer, J. H. 1978, ApJ, 224, L67
- Mouschovias (1976) Mouschovias, T. Ch. 1976, ApJ, 207, 141
- Nedoluha & Watson (1990) Nedoluha, G. E., & Watson, W. D. 1990, ApJ, 361, 653
- Pavlakis & Kylafis (1996) Pavlakis, K. G., & Kylafis, N. D. 1996, ApJ, 309, 320
- Pavlakis & Kylafis (2000) Pavlakis, K. G., & Kylafis, N. D. 2000, ApJ, 534, 770
- Reid et al. (1980) Reid, M. J., Haschick, A. D., Burke, B. F., Moran, J. M., Johnston, K. J., & Swenson, G. W. Jr. 1980, ApJ, 239, 89
- Reid, Myers, & Bieging (1987) Reid, M. J., Myers, P. C., & Bieging, J. H. 1987, ApJ, 312, 830
- Roberts et al. (1993) Roberts, D. A., Crutcher, R. M., Troland, T. H., & Goss, W. M. 1993, ApJ, 412, 675
- Roberts, Dickel, & Goss (1997) Roberts, D. A., Dickel, H. R., & Goss, W. M. 1997, ApJ, 476, 209
- Ruiz-Velasco et al. (2006) Ruiz-Velasco, A. E., Migenes, V., Slysh, V., & Val’tts, I. E. 2006, Rev. Mexicana Astron. Astrofis. (SC), in press, astro-ph/0603695
- Sault et al. (1990) Sault, R. J., Killeen, N. E. B., Zmuidzinas, J., & Loushin, R. 1990, ApJS, 74, 437
- Sollins & Ho (2005) Sollins, P. K., & Ho, P. T. P. 2005, ApJ, 630, 987
- Troland et al. (1989) Troland, T. H., Crutcher, R. M., Goss, W. M., & Heiles, C. 1989, ApJ, 347, L89
- Troland & Heiles (1982) Troland, T. H., & Heiles, C. 1982, ApJ, 252, 179
- Turner & Welch (1984) Turner, J. L., & Welch, W. J. 1984, ApJ, 287, L81
- Uchida, Fiebig, & Güsten (2001) Uchida, K. I., Fiebig, D., & Güsten, R. 2001, A&A, 371, 274
- Valtz & Soglasnova (1973) Valtz, I. E., & Soglasnova, V. A. 1973, Astrophys. Lett., 13, 23
- Verschuur (1996) Verschuur, G. L. 1996, AJ, 112, 2718
- Walmsley et al. (1986) Walmsley, C. M., Baudry, A., Guilloteau, S., & Winnberg, A. 1986, A&A, 167, 151
- Whiteoak & Gardner (1981) Whiteoak, J. B., & Gardner, F. F. 1981, MNRAS, 197, 39P
- Wright, Gray, & Diamond (2004a) Wright, M. M., Gray, M. D., & Diamond, P. J. 2004a, MNRAS, 350, 1253
- Wright, Gray, & Diamond (2004b) Wright, M. M., Gray, M. D., & Diamond, P. J. 2004b, MNRAS, 350, 1272
[x]lrrrrr
Detected Emission and Maser Emission
Frequency Flux Density
Source (MHz) Polarization (Jy) (km s-1) (km s-1)
\endfirstheadcontinued.
Frequency Flux Density
Source (MHz) Polarization (Jy) (km s-1) (km s-1)
\endhead\endfootW3(OH) 6030 LCP 0.70 69.75 0.23
0.46 69.43 0.62
1.19 45.90 0.30
2.27 45.30 0.62
3.46 44.50 0.31
2.70 44.45 0.57
5.53 43.98 0.18
109.4143.60 0.28
55.68 43.40 0.33
105.3442.89 0.23
RCP 0.19 70.56 0.39
0.42 70.10 0.26
0.81 69.73 0.26
0.66 47.42 0.24
0.48 46.89 0.28
0.24 45.51 0.30
1.31 44.98 0.20
2.18 43.98 2.32
1.74 43.96 0.29
6.00 43.34 0.30
39.90 42.83 0.29
75.26 42.55 0.27
11.56 42.03 0.38
6035 LCP 2.26 48.86 0.18
2.22 47.77 0.88
4.13 47.26 0.44
34.20 45.62 0.26
17.17 45.23 0.37
30.25 44.35 0.58
195.5743.37 0.36
342.1142.99 0.21
54.7542.81 0.42
RCP 13.60 46.97 0.31
36.70 45.04 0.34
16.07 44.46 0.37
39.58 44.06 0.26
52.55 43.52 0.25
156.3543.06 0.17
141.3942.75 0.91
Sgr B2M 6030 LCP 0.05 53.63 8.87
0.08 65.06 8.71
0.05 65.73 0.55
0.21 70.64 0.24
0.69 72.21 0.22
RCP 0.05 52.98 7.70
0.08 64.93 9.94
0.05 65.35 0.54
0.49 70.21 0.23
0.16 71.58 0.12a
0.11 71.99 0.57
0.12 72.43 0.18
6035 LCP 0.02 50.59 3.46
0.30 62.05 0.19
0.08 62.58 1.08
0.13 63.58 0.56
0.04 64.00 5.30
0.46 65.02 0.31
0.08 65.89 0.93
0.07 66.48 0.25
0.54 67.38 0.51
0.12 68.90 0.97
1.09 70.65 0.40
1.18 71.04 0.38
4.33 72.23 0.32
RCP 0.05 48.83 0.39
0.03 50.17 3.75
0.04 60.90 1.22
0.27 62.38 0.61
0.22 63.26 0.74
0.37 64.62 0.38
0.16 65.88 1.79
0.63 66.99 0.51
0.18 68.92 1.40
1.30 70.26 0.27
1.78 70.63 0.44
2.18 71.62 0.32
1.22 72.25 0.23
1.85 72.66 0.35
G5.8860.393 6030 LCP 0.13 9.07 3.09
RCP 0.13 8.91 6.47
6035 LCP 0.13 8.53 6.79
0.14 9.73 0.80
RCP 0.22 8.46 7.56
0.14 9.76 0.90
G10.6240.385 6035 See §3.2
M17 6030 LCP 2.85b 21.49 0.34
RCP 2.65b 21.55 0.44
6035 LCP 66.01b 21.39 0.31
61.21b 22.58 0.23
5.43b 23.54 0.34
RCP…b21.43 0.33
…b22.58 0.32
G28.1990.048 6030 LCP 0.17 94.42 0.51
0.18 96.17 0.67
0.12 96.74 4.38
RCP 0.38 94.97 0.37
0.18 96.06 0.68
0.18 96.24 3.56
6035 LCP 1.05 94.51 0.59
3.56 96.07 0.30
1.05 96.32 1.00
0.21 96.61 3.92
0.13 97.79 0.25
RCP 1.59 94.90 0.63
3.13 96.12 0.66
0.18 96.86 4.40
0.38 97.02 0.62
0.14 98.29 0.43
W48 6035 LCP 0.39 40.23 0.14
2.59 42.97 0.25
2.31 43.33 0.47
0.73 44.18 0.46
RCP 0.29 40.31 0.31
2.80 42.93 0.22
3.25 43.28 0.62
1.28 44.18 0.35
G45.1220.133 6030 LCP 0.18 53.89 0.65
0.08 54.51 0.64
RCP 0.14 53.51 0.50
0.11 54.15 0.85
6035 LCP 1.90 53.82 0.37
1.19 54.38 0.77
0.86 55.49 0.40
RCP 2.02 53.58 0.34
2.72 54.16 0.61
1.14 55.42 0.33
W51 e/d 6030 LCP 0.30 52.33 0.33
0.89 52.95 0.28
RCP 0.25 52.73 0.43
1.00 53.35 0.30
6035 LCP 0.37 52.63 1.03
1.71 55.20 1.04
0.26 56.58 1.19
4.02 57.43 0.31
0.47 63.05 0.39
0.95 63.92 0.20
RCP 0.64 52.95 1.01
1.39 55.46 1.24
1.16 55.67 0.70
0.45 56.84 0.51
5.58 57.74 0.36
0.50 63.17 0.33
0.55 64.15 0.31
K3-50 6030 LCP 0.29 19.10 0.33
RCP 0.25 19.80 0.30
6035 LCP 1.05 19.29 0.39
0.46 18.60 0.60
RCP 1.04 19.78 0.44
1.59 18.99 0.34
ON 1 6030 LCP 0.38 0.69 0.27
0.10 1.30 0.36
2.57 14.17 0.29
RCP 0.18 0.37 0.45
3.64 13.80 0.26
6035 LCP 0.12 0.76 0.19
0.42 0.13 0.46
1.41 0.49 0.26
0.26 1.10 0.27
0.15 1.68 0.32
0.25 2.11 0.39
0.14 5.47 0.39
0.09 7.74 0.21
0.26 12.59 0.27
2.06 14.02 0.65
3.09 14.52 0.21
0.68 14.88 0.37
1.96 15.44 0.26
RCP 1.21 0.71 0.26
1.69 0.24 0.32
0.53 0.47 0.12a
0.29 1.38 0.26
0.34 1.82 0.32
0.47 5.53 0.39
5.56 13.81 0.38
15.91 14.47 0.30
15.160.13
DR 20 6030 LCP 1.43 10.92 0.23
RCP 1.18 11.19 0.22
6035 LCP 1.96 11.02 0.30
6.26 9.64 0.16
RCP 1.85 11.18 0.37
1.92 9.87 0.33
W75 N 6035 LCP 0.44 7.10 0.34
4.59 7.65 0.27
1.78 9.41 0.26
RCP 0.58 6.88 0.38
1.54 7.52 0.21
4.06 8.05 0.35
2.01 9.67 0.32
W75 S 6035 LCP 0.97 8.79 0.12a
0.20 2.24 0.21
1.20 3.46 0.30
RCP 0.12 8.79 0.40
0.20 2.37 0.30
0.55 3.20 0.31
0.21 3.76 0.52
LDN 1084 6035 LCP 0.19 62.84 0.18
1.24 61.51 0.23
RCP 0.20 62.60 0.29
1.04 61.46 0.29
NGC 7538 6030 LCP 0.10 59.12 1.18
RCP 0.09 59.14 1.06
6035 LCP 1.64 59.34 0.40
0.20 58.89 0.32
0.06 58.74 3.16
0.09 56.91 0.29
RCP 1.71 59.34 0.48
0.11 58.83 0.38
0.08 58.70 2.95
0.16 56.84 0.29
-
a
FWHM is comparable to channel width.
-
b
Saturation of the autocorrelator prevented accurate determination of flux densities. See Sect. 3.2 for further details.
-
c
Untapered spectrum is contaminated by ringing, but there is insufficient spectral resolution to achieve a good fit of the maser parameters after Hanning weighting.