A Deep Proper-Motion Survey in Kapteyn Selected Areas: I. Survey Description and First Results for Stars in the Tidal Tail of Sagittarius and in the Monoceros Ring
Abstract
We describe a high-precision, deep (to ) absolute proper-motion survey that samples lines of sight in the Kapteyn Selected Areas along declination zones , and . In many fields the astrometric baseline reaches nearly a century. We demonstrate that these data provide typical per star precisions between and 3 mas yr-1 to the above magnitude limits, with the absolute reference frame established by numerous extragalactic sources in each survey field. Combined with existing and ongoing photometric and radial velocity surveys in these fields, these astrometric data will enable, among other things, accurate, detailed dynamical modeling of satellite interactions with our Galaxy. In this contribution we describe the astrometric part of our survey and show preliminary results along the trailing tail of the Sagittarius dwarf galaxy, and in the Monoceros ring region.
1 Introduction
Modern, deep, uniform, large-area photometric surveys have shown unambiguously that the Milky Way outer halo contains accretion-derived substructure (e.g., Ibata et al. 2001, Newberg et al. 2002, Majewski et al. 2003, Rocha-Pinto et al. 2003, 2004, Vivas et al. 2004, Conn et al. 2005a). These structures of known or assumed remnants of satellite accretion, have long-lived, coherent tidal features that can be used to model the Galactic gravitational potential (e.g., Ibata et al. 2001, Law et al. 2005), as well as the characteristics of the original satellite (e.g., Johnston et al. 1999). However, such modeling studies have been limited by the meager available kinematical data over large angles along the tidal features. While radial-velocity programs have just recently begun to address this problem for the few known Galactic tidal tails (Sagittarius - Majewski et al. 2004, Vivas et al. 2005, and the Monoceros ring - Crane et al. 2003), no systematic survey has begun to address the transverse (tangential) velocities (i.e., absolute proper motions). Without this information, dynamical models remain poorly constrained, and therefore limited to describing merely a range of possible events, rather than an accurate description of the real event.
The work described here is a proper-motion survey that provides high precision (1 to 3 mas/yr per well-measured star) absolute and relative proper motions down to a magnitude of , and for a few selected fields down to , in lines of sight in the Selected Areas (SA) designed by Kapteyn for Galactic structure studies in 1906. Current proper-motion surveys do not achieve this precision at a similar magnitude limit and thus have limited capability to detect and characterize distant halo substructure. To date there are only a few similarly deep, precise, pencil-beam-type proper-motion data sets that are primarily centered on globular clusters or dwarf spheroidals, and even fewer that are focused on Galactic field stars (e.g., Chiu 1980, Majewski 1992, Guo et al. 1993, Dinescu et al. 2002). Obviously, ground-based studies of this type are limited to parts of the sky where suitable first epoch astrometric data exist. Here we exploit a unique cache of nearly century old, deep photographic plates having good scale, as well as other plate material collected in Kapteyn fields.
We intend to complement the new proper motion data with radial velocities, distances and metallicity estimates from our own photometric and spectroscopic work as well as from overlapping surveys such as 2MASS, SDSS, QUEST and RAVE.
With this survey we aim to (1) determine the extent and orbital motion of the highly obscured Monoceros ring-like structure above and below the Galactic plane, and explore its possible relation to other low latitude structures, such as the Canis Major (CMa) overdensity, (2) characterize the transverse motion of the Sagittarius tidal streams, (3) search for and characterize additional substructures in the halo of the Milky Way and (4) determine the kinematical properties of numerous thick disk and halo stars in our fields as a function of Galactic position.
Future papers will include detailed kinematical analyses for specific regions, while in this paper we characterize the survey and show its potential in two specific regions where tidal streams have already been identified from other sources. In the following Section we will describe the survey in detail. In Section 3 we show results in a few SA fields, and a brief summary is presented in Section 4.
2 Survey Description
2.1 The Collection of Photographic Plates
This survey is made possible by the visionary, now century-old Milky Way survey introduced by Kapteyn in 1906. Kapteyn devised the Plan of Selected Areas as a means to systematically study the Milky Way. The Plan, as originally envisioned, involved photometry, astrometry and spectroscopy of stars in 206 SAs collected at numerous observatories around the world and focused on characterizing the “sidereal world”; the perceived importance of this grand effort in the early 20th century prompted the creation of International Astronomical Union (IAU) Commission 32: Selected Areas, as well as the Subcommittee on Selected Areas of IAU Commission 33: Structure and Dynamics of the Galactic System. Among the important early contributions to the SA program was the Carnegie Institution’s systematic analysis of stellar photometry from Mount Wilson 60-inch plates of the 139 northern accessible SAs by Sears, Kapteyn and van Rhijn (1930). The photographic plates used in this analysis were taken by Fath and Babcock with the 60-inch telescope between 1909 and 1912. For 54 near-equatorial fields there exist deliberately matched (in area, approximate plate scale and depth) photographic plates taken with the Las Campanas Du Pont 2.5-m telescope by S. Majewski between 1996 and 1998. This collection of photographic plates provides the opportunity for an unprecedentedly deep, high-precision proper-motion survey that takes advantage of the excellent plate scale (/mm for the 2.5-m Du Pont, and /mm for the 60-inch Mt. Wilson) of the images taken in both epochs which span a year baseline. Each field of view is . Unfortunately, because the old 60-inch plates go only as deep as for blue objects, there are very few galaxies to determine the correction to absolute proper motion in a field of view, and with those that are available being at the plate limiting magnitude, and therefore yielding rather poor centroids. Primarily for this reason, we have included in our proper-motion determinations the first Palomar Observatory Sky Survey (POSS-I) plates as measured by both Space Telescope Science Institute (STScI, the Digitized Sky Survey - DSS) and by USNO. The POSS-I plates were taken in the early fifties with the Oschin Schmidt telescope and have a plate scale of /mm. While the scale and the digitization of the POSS-I plates (see Section 2.3) are much poorer than those of the other two sets of plates, they offer a 40-year baseline with the DuPont plates, and extend the proper motion limiting magnitude to .
Minimally, each field has an early epoch Mt. Wilson plate with two offset images, one from a 60 min exposure and one from a 3 min exposure. Many fields have a second early Mt. Wilson plate, sometimes with two exposures, sometimes with one. For each field there are two recent-epoch Du Pont plates taken in the blue (IIIa-J + GG385) and visual (IIIa-F + GG495) passbands. These plates also contain a pair of offset exposures of about 60 min and 3 min integration. The intermediate epoch POSS-I plates were taken in the blue (103a-O, no filter) and red (103a-E + RP2444) passbands, with typical exposure times of 10 and 50 minutes respectively.
Finally, a handful of fields have KPNO Mayall 4-m prime focus photographic plates (plate scale /mm) taken in the mid seventies by A. Sandage, and mid nineties by S. Majewski. The modern plates were taken in the blue (IIIa-J+GG385) and visual (IIIa-F+GG495) passbands, while the Sandage plates were taken in the blue (IIa-O+GG385/GG3), visual (IIa-D+GG495/GG11) and red (127-04+RG610) passbands.
2.2 Area Coverage
In Figure 1 we show the location of the centers of the SA fields (open circles) on the sky in an Aitoff projection. The filled circles represent the fields that also have Mayall 4-m plates. The survey samples three declination zones ( and ) and the full range in right ascension, except for low () Galactic latitude zones. The Galactic plane is represented with a grey dash-dot line. There is one field, SA 29, which is at higher declination, and which has only 4-m plates. We are including this field because it falls within the QSO catalog determined from Data Release 3 (DR3) of the Sloan Digital Sky Survey (SDSS) area (grey area in Fig. 1). Although, for our astrometric reductions, we make use of the photometry from DR4, Figure 1 highlights the approximate SDSS footprint corresponding to the QSO catalog. Thus it can be seen that for a good number of fields QSOs have already been identified that can be used in setting the absolute proper-motion reference frame.
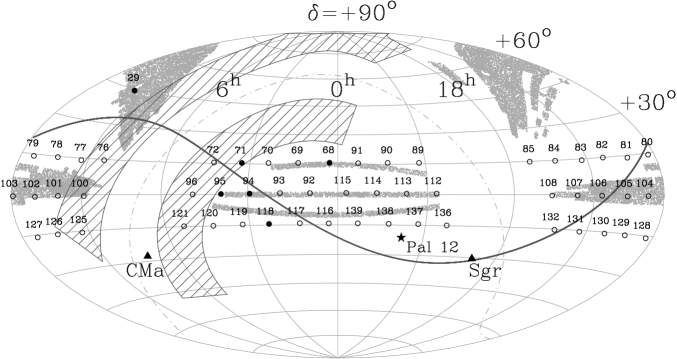
We have indicated the location of the Sagittarius dwarf galaxy’s (Sgr) center, and that of globular cluster Pal 12, which is believed to have belonged to Sgr according to proper-motion data (Dinescu et al. 2000), surrounding field photometry (Martínez-Delgado et al. 2002) and chemical abundances (Cohen 2004). The continuous dark line shows Sgr’s most recent orbit determination (Dinescu et al. 2005a). The orbit is roughly indicative of Sgr’s tidal streams that can be as wide as , as Pal 12’s location for instance suggests. It is apparent that Sgr’s southern, trailing arm, which is closer in distance to the Sun ( kpc, Majewski et al. 2003) than much of the northern, leading arm, will be sampled in perhaps six SA fields (depening on the true stream width) from RA = to . In this paper we present results for SA 93 and 94.
The second most well-known, putative halo substructure is the Monoceros stream or ring (“Mon”; Newberg et al. 2002, Ibata et al. 2003), a low Galactic-latitude structure which is represented here by the two cross-hatched bands above and below the Galactic plane. This area is drawn only approximately as based on observations from Yanny et al. (2003), Ibata et al. (2003), Rocha-Pinto et al. (2003), Crane et al. (2003), Conn et al. (2005a), Martin et al. (2006). The stellar overdensity discovered by Martin et al. (2004) in the constellation of Canis Major and subsequently analyzed by other groups, may be a distinct structure (but cf. Rocha-Pinto et al. 2006), and it has been suggested to be the core of the satellite that is responsible for the Monoceros stream (see, e.g. Peñarrubia et al. 2005). We have marked the location of this structure (CMa) and we note that Conn et al. (2005b) claim, based on radial velocities, to have detected the Monoceros ring behind the CMa structure as well. At first glance, between six and twelve SA fields are likely to sample the Monoceros ring. Fields SA 71 and 72 are more problematical because both Sgr and Mon are expected in these areas (see Fig. 1). This paper presents results in SA 96, 100 and 101 that fall within/close to the Mon region.
Another equatorial survey that overlaps some of our proper-motion survey is the QUEST survey (QUasar Equatorial Survey Team), which identifies RR Lyrae variable stars along the celestial equator (Vivas et al. 2004). Their most recent results (Duffau et al. 2006) indicate the discovery of a new halo structure in the constellation of Virgo that is not related to either Sgr or Mon (see also Jurić et al. 2006). Two of our SA fields, 103 and 104 are in the area indicated by QUEST to sample the Virgo structure. Provided the depth of the plates allows it, we may be able to determine an absolute proper motion for this structure in the near future.
2.3 Photographic Plate Measurements
2.3.1 Du Pont 2.5-m, Mt. Wilson 60-inch and Mayall 4-m Scans
For each field, we start by fully digitizing one Du Pont, one 60-inch and one 4-m plate. These initial coarse scans serve to build input lists for high-resolution scans. All of the scans, except for those of the Mayall 4-m plates in SA 29, 71, 94 and 118, were done with the Yale PDS Microdensitometer. The coarse scans of most of the 4-m plates were done with the University of Virginia’s microdensitometer. The size of the field is defined by the 10 inch 10 inch Du Pont plate size, which corresponds to . For the 60-inch plate in each field, we digitize the same size area that matches the Du Pont field. This corresponds to a 10-cm box located at the center of the Mt. Wilson plate. Stellar images on the 60-inch plates are affected by coma, and outside this region they are practically unusable for astrometric purposes. Based on these coarse scans, an input list of objects is determined using the software package SExtractor (Bertin & Arnouts 1996), for each epoch. Long and short exposures on each plate are separated into two different lists. Then, each exposure on each plate is measured in a fine raster, object-by-object mode, with a pixel size of m () for the Du Pont plates, and m () for the 60-inch plates. The input lists for the 4-m plates were made from the coarse scans done at UVa, and using the software package FOCAS (Valdes 1982)111See also Valdes’s 1993 FOCAS User’s Guide, an NOAO document available at ftp://iraf.noao.edu/iraf/docs/focas/focasguide.ps.Z. These 4-m input catalogs prepared earlier (Dinescu et al. 2002) were used to measure the 4-m plates at Yale in a fine raster mode with a pixel size of m (). The objects’ positions, instrumental magnitudes, and other object parameters were derived from the fine raster scans using the Yale 2D Gaussian centering routines (Lee & van Altena 1983). As is customary, a set of five to eight stars well-distributed over the plate are repeatedly measured during the scan in order to monitor and correct for thermal drifts during the scan.
From coordinate transformations of same-epoch, same-telescope plates we obtain, for well-measured stars, a centering precision of m (13 mas) per single measurement, per star for the Du Pont plates. For the 60-inch plates this number is m (90 mas), while for the 4-m plates, it is m (24 mas).
2.3.2 POSS-I Scans
There are two readily available scans of the POSS-I plates: those of the red plates done with a PDS machine at STScI, widely known as the DSS, and those of both blue and red plates done at US Naval Observatory (USNO), Flagstaff Station with the Precision Measuring Machine (PMM, see Monet et al. 2003 for its description). The DSS scans are retrieved directly from the web222http://archive.stsci.edu/cgi-bin/dss-form as the area in question is smaller than a degree on a side. The resolution of the DSS scans is m/pix (/pix).
Sections of the PMM scans were kindly made available to us by S. Levine at USNO-Flagstaff. These scan sections are centered on the SA fields, and cover . The PMM is an 8-bit, fast measuring machine that uses a CCD detector to take “footprint” images of the photographic plate. The POSS-I plates were scanned at a resolution of m/pix (/pixel). Each Schmidt plate is covered by some 588 exposures with a field of view of each. The CCD footprints are assembled together in the subsequent software by using an offset, to provide the entire digitized sky (see details in Monet et al. 2003). The “stitching” of the CCD footprints however is not perfect, and thus position-dependent systematics are introduced (see Section 2.5). Without access to the individual PMM footprints, a method is required to correct the systematics in the assembled scans. We have made use of the DSS scans, which were produced by a traditional PDS measuring machine, to correct the PMM positions (see Section 2.5). The SA field scans from DSS and USNO, for each POSS-I plate are processed as follows: Objects are detected with SExtractor and then re-centered with the Yale centering routines. Coordinate transformations between overlapping plates for the DSS measurements indicate a centering precision of m (141 mas) per single measurement, per star. Similarly, for the USNO scans we obtain m (174 mas) for both the red and blue plates. Based on these values, if we use only the Du Pont and the POSS-I plates (a -year baseline), we can obtain a proper-motion uncertainty of mas/yr per well-measured star.
2.4 Photometry and Spectroscopy
Here we will only briefly mention our campaign to obtain photometry and spectroscopy in the SA fields; more details of these observations will be presented in subsequent papers.
All SA fields have CCD photometry taken with with the SITe#1 20482 CCD on the Swope 1-m at Las Campanas Observatory on the nights of UT 1997 December 23-31, 1998 June 19-26, and 1998 December 15-16. The CCD field of view covers (, /pixel) of the astrometric field. Exposure times were 120, 200, and 900 seconds for the Johnson and filters, respectively, yielding data shallower by 1 to 1.5 magnitudes than the typical Du Pont plates, for red stars, and by magnitudes for blue stars. Short exposures (5, 7, and 40-45 seconds in and ) were also taken to obtain photometry for the bright stars in these fields.
For the astrometric reductions, we need colors for all stars to map out the color terms. These were obtained by calibrating photographic instrumental magnitudes for each blue and visual Du Pont plate with CCD magnitudes. The CCD magnitudes used in this process are not calibrated to the standard Johnson system because at the time the astrometric reductions were done, the CCD photometry had not been calibrated yet. Nevertheless, the CCD photometry helped to linearize the photographic magnitudes.
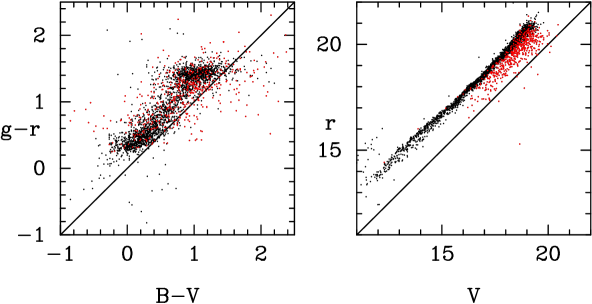
To date, the reduced CCD data cover only a handful of fields. Therefore, for the rest of the fields where there is coverage with SDSS, we have used the SDSS colors in the astrometric reductions. In Figure 2 (left panel) we show the photographic, CCD-calibrated colors versus the SDSS colors in SA 100. Dark symbols are stars, and red symbols are galaxies. The good color correlation justifies our use of the colors in the astrometry. The right panel shows the relationship between the SDSS magnitude and the photographic magnitude. This shows that the Du Pont plates reach a limiting magnitude of .
For the fields where we have detected structure in the proper-motion distribution as well as in the corresponding SDSS color-magnitude diagram (CMD), we have started an observing program with on the 3.5-m telescope in order to measure radial velocities. So far, preliminary radial velocities have been obtained in SA 71 and SA 96. These results will be presented elsewhere.
2.5 Astrometry
The Du Pont plates were precorrected for differential refraction (third-order refraction theory, Taff 1981) and for distortion (see details in Dinescu et al. 2000). The distortion coefficients applied here were determined from the coordinate transformations of eight visual and seven blue plates into the Second Naval Observatory CCD Astrograph Catalog (UCAC2, Zacharias et al. 2004). The distortion coefficient for the visual plates is mm-2, and for the blue plates is mm-2. Between 100 and 200 stars in common with UCAC2 in the various SA fields were used to model the coordinate transformations. The center of distortion was assumed to coincide with the tangent point. The tangent point was determined by minimizing quadratic terms in the transformations of plate coordinates into the UCAC2 positions (see e.g., Guo et al. 1993). The cubic distortion coefficients determined here, although slightly smaller than that determined by Cudworth & Rees (1991), are in agreement within quoted uncertainties. The center of distortion is determined with a precision of mm, or 5.5 arcsec.
The Mayall 4-m plates were precorrected for distortion using the coefficients from Chiu (1976). The center of distortion is determined similarly to the process used for the Du Pont plates, i.e., by minimizing quadratic terms from a coordinate transformation into UCAC2. This gives a distortion center known no better that mm (1 arcsec). We have not precorrected the 4-m plates for differential refraction, as this effect is much smaller than that of distortion; for the Du Pont plates these effects are similar in size (Dinescu et al. 2000).
The positions determined from the DSS scans of the POSS-I plates were used to correct the positions determined from the PMM scans that are affected by the assemblage of multiple CCD footprints (see Section 2.3). In Figure 3 we show the residuals from a coordinate transformation between PMM measurements and DSS measurements as a function of position. The transformation includes up to fourth-order terms. The top two panels show the residuals for the red plate (i.e., same red plate, two different measurements, PMM into DSS) and the bottom two for the blue plate (i.e., blue PMM measurements into red DSS measurements) as labeled. The right panels show the residuals after the correction was applied. The correction for each object is derived by taking a local average (of some 20 neighbors) from a 2-d map of the residuals shown in Fig. 3.

It is well known that astrometry from the wide-field POSS-I plates, which were taken with a Schmidt telescope, is strongly affected by position and magnitude-dependent systematics (e.g., Morrison et al. 2001 and references therein). These are particularly large and difficult to model when an entire plate of is being mapped into astrometric catalogs. For our purposes however, we are using only small regions on a plate, which can be mapped into one another and into an external system, such as the Du Pont plates for example, by using up to third order polynomials. As for magnitude dependent systematics (i.e., the magnitude equation) , these are minimized by using stars within a relatively narrow magnitude range, toward the faint end of the plate limit: to 19.
The old 60-inch plates were not precorrected in any manner as they are the least well-understood. We are aware that coma is present from the shape of the images on the plates, and that it affects the astrometry from coordinate transformations of long into short exposure. In the following Section we describe the way in which these plates were incorporated into the proper-motion determinations.
2.6 Proper-Motion Determinations
The lists of coordinates from the 60-inch, POSS-I and 4-m plates are matched with the list from the Du Pont plates. The matching radius is 2 arcsec. This basically limits our catalog to objects with proper-motions smaller than mas/yr. Although stars with proper motions larger than this value can be recovered from the current lists of positions for all measured objects on each plate, it is not our immediate goal to do so.
The proper-motions are determined differentially, by adopting one plate as the master plate, into which all the others are mapped. The master plate is chosen from the Du Pont plates, which are best understood and modeled. During long exposures, guiding-induced magnitude-dependent systematics (also known as the magnitude equation, see e.g., Majewski 1992, Guo et al 1993, Girard et al. 1998) affect practically all photographic material. However, the Du Pont plates have a short exposure, and we have assumed that this exposure is not strongly affected by the magnitude equation. Therefore we have transformed the long exposures into one short exposure, and the magnitude-dependent trend of the residuals was used to correct the long-exposure measurements. This essentially corrects the bright stars (), over which the trend is apparent. One of the magnitude-equation corrected Du Pont long-exposures is then chosen as the master plate. The remaining plates are then transformed into the master plate using up to fourth order polynomial coordinate transformations and linear color terms. These high-order geometric terms are present most likely due to our inability to accurately determine the center of distortion (see Section 2.5).
Preliminary proper motions are calculated based on the Du Pont and POSS-I plate measures, and, for a handful of fields, from Du Pont and 4-m plates. The transformation of POSS-I plates into the Du Pont system occasionally requires third-order polynomials in the coordinates, and linear color terms. The derived preliminary proper motions allow propagation back in time to the epoch of the 60-inch plates, and thus the 60-inch plates are tied to the system of the Du Pont master plate. These transformations include third order polynomials in the coordinates, coma terms and linear color terms. New proper motions are then calculated from the entire set of plates and one more iteration is performed to obtain the final values. The reference system that is used to determine the plate transformations consists of faint stars, varying in number from a couple hundred to a couple thousand, depending upon the Galactic latitude of the field and the depth of the corresponding plates. The resulting proper motions are relative; the correction from relative to absolute proper motions is derived from the offset defined by the mean proper motion of QSOs and galaxies in the field. We note that the Du Pont and 60-inch short exposures provide measurements of stars as bright as some of the faintest stars (). However, we will not rely on any of the stars at the bright end to determine the correction to absolute proper motions, because we believe our proper-motions at the bright end () are affected by unaccounted for magnitude-dependent biases. The proper motions of galaxies and the QSOs are also used at each iteration to check magnitude and color-dependent systematics. In some of the areas that have 4-m plates, galaxies were used to correct small trends with color and magnitude left in the first-iteration set of proper motions. QSOs and galaxies are selected from the SDSS (Schneider et al. (2005) and DR4 classification). According to the SDSS documentation, the galaxy classification is quite reliable down to . For areas that do not overlap with SDSS we have selected galaxies from a visual inspection of the deepest Du Pont plate.
We calculate a proper motion for each object that has at least three measurements separated in time by at least years ( years for fields that include 4-m plates). The proper motion is calculated for each object from a linear least-squares fit of positions as a function of plate epoch. The formal proper-motion uncertainty is given by the scatter about this best-fit line. Measurements that differ by more than from the best-fit line are excluded. Objects that have only three measurements should however be considered with caution because they may have unrealistically small formal uncertainties.
2.7 Proper-Motion Uncertainties
There are two ways to estimate externally the proper-motion uncertainties: (1) by direct comparison with another high-quality proper-motion catalog and (2) from the proper-motion scatter of objects that have no or negligible intrinsic proper-motion dispersion. For the first test, we compare our proper motions with those in the Munn et al. (2004) catalog in five SA fields. We remind the reader that the Munn et al. (2004) proper-motion catalog was made by combining USNO-B (Monet et al. 2003) with the SDSS (DR1). Munn et al. (2004) have used SDSS galaxies to correct for position-dependent proper-motion systematics and to place the proper motions on an absolute reference frame. In Figure 4 we show proper-motion differences (i.e., our relative proper motions minus proper motions from Munn et al. 2004) as a function of magnitude. Units for proper motions are mas/yr throughout the paper. The left panels show proper-motion differences along right ascension (RA), and the right panel along declination (Dec). It is apparent that, in all fields, there is a larger scatter in the RA proper-motion differences, than in Dec. Proper-motion differences plotted as a function of positions and colors show that the larger scatter in RA is not due to systematics related to these quantities. Our proper motions for galaxies and QSOs (i.e., objects with no intrinsic proper-motion dispersion) do not indicate that our measurements are consistently poorer in the RA direction than in Dec (see below). Interestingly, the histogram of QSO proper motions in Munn et al. (2004, their Figs 1 and 3) shows that the RA proper-motion dispersion is larger than that in Dec, in agreement with our findings. From coordinate transformations of the modern Du Pont plates directly into SDSS positions in some thirteen SAs, we do not find indications that the positional error in RA is larger than that in declination. This leads one to conclude that the positional precision in the USNO-B catalog is poorer in RA than in declination. Indeed, Figure 1 in Munn et al. (2004), which shows the distribution of QSOs’ proper motions in RA and Dec for both the USNO-B catalog and the new Munn et al. (2004) catalog, indicates that the scatter in RA is larger than that in Dec in both catalogs.

From our comparison with the Munn et al. (2004) catalog, we obtain a scatter of mas/yr in RA and mas/yr in Dec , for . Munn et al. (2004) quote uncertainties of 3.6 and 2.8 mas/yr in RA and Dec respectively for the same magnitude range. This indicates that our uncertainties are substantially smaller. The fact that we see in the proper-motion differences (Fig. 4) the larger scatter in RA than in Dec which is characteristic of the Munn et al. (2004) catalog, implies that the errors in the latter catalog dominate the scatter in the proper-motion differences.
Our second test uses galaxies, QSOs, stars in known streams or in clusters, i.e., objects for which the proper-motion dispersion reflects only the measurement uncertainty. In practice, galaxies have larger proper-motion uncertainties than stars due to poor centering of their fuzzy, low-gradient image profiles, and there are very few QSOs in each SA field. Thus these uncertainty estimates should also be viewed as conservative numbers. In Figure 5 we show relative proper motions of galaxies (open circles) and QSOs (filled red circles) as a function of magnitude for the same SA fields shown in Fig. 4 (left panel is for RA, right panel for Dec). Clearly SA 94 is better measured, and this is because it includes 4-m plates.
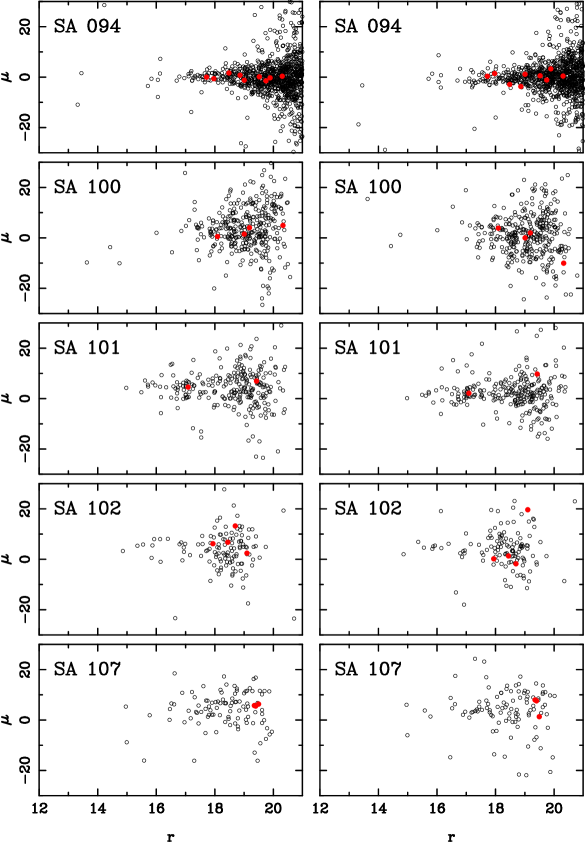
Figure 5 indicates that the proper-motion uncertainty varies considerably with magnitude, and there may be slight variations from field to field. These variations are primarily due to the image quality of the old POSS I plates. For a typical field, we obtain between 3 and 5 mas/yr for reasonably well-measured galaxies, while for fields that have 4-m plates, we obtain 2 to 3 mas/yr. Most fields have of the order of 100 galaxies, therefore the uncertainty in the correction to absolute proper motion is mas/yr. For the QSOs, it is more difficult to reliably estimate uncertainties, due to small number statistics and the fact that most QSOs are toward the faint limit of the survey. However, for SA 94, we obtain between 1 and 2 mas/yr for well-measured () images. Proper-motion uncertainty estimates as derived from “known” tidal structures will be given in the following Section, where we present the tidal tail results.
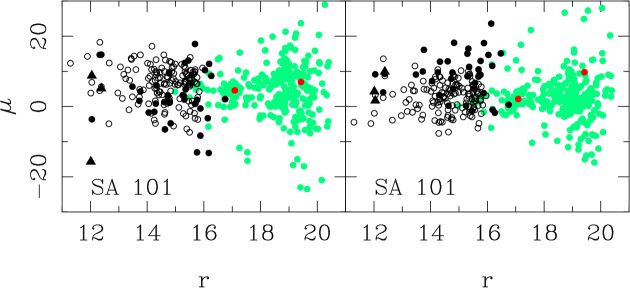
Finally, in Figure 6 we show the correction to absolute proper motion as given by a number of calibrating objects for SA 101. Most of the fields show similar characteristics. Toward the faint end, the galaxies (green symbols) and QSOs (red symbols) dominate. At the bright end we show the correction to absolute proper motion as given by proper-motion differences of Tycho2 (Hog et al. 2000) stars (filled triangles), UCAC2 stars (open circles), and NPM1 (Lick Northern Proper-Motion Program, Klemola et al. 1987) stars (filled circles). For all of these three catalogs, the stars matched with our survey are at the faint limit of those catalogs, so that these are stars with the largest measurement errors in these other catalogs. Indeed, the proper-motion scatter is between 4 and 6 mas/yr, poorer than that of our measured galaxies. This is one reason why we have not used Tycho2, UCAC2 and NPM1 stars to calibrate to absolute proper motions. The second reason is due to obvious offsets between the zero point as determined by galaxies and QSOs in our survey, and that determined based on brighter stars in these external catalogs. This is due to residual magnitude-dependent systematics in either or both the listed catalogs and in our survey. Since the magnitude range of galaxies and QSOs better matches that of our survey stars, using these to establish the abolute proper motion correction minimizes magnitude-dependent systematics. We will use both galaxies and QSOs in the determination of the absolute proper-motion correction.
One more question remains: Why not use stars in the Munn et al. (2004) catalog as astrometric zero-point calibrators? From comparisons of the zero point as determined by galaxies and by the Munn et al. (2004) stars, we find differences between 0.2 and 5 mas/yr. The scatter in the difference is 2 mas/yr. The absolute proper-motion calibration in Munn et al. (2004) is also based on SDSS-selected galaxies, and their first epoch material is in our time series. Nevertheless, differences appear in the two independently determined catalogs. We feel our proper motions are more reliable for two reasons: (1) the modern epoch consists of precise measurements of the high quality Du Pont plates, and (2) the old epoch, i.e., the POSS-I scans were re-reduced here in a very careful manner to minimize position-dependent systematics (see Section 2.5), while the Munn et al. (2004) proper motions necessarily had to rely on the batch-reduced PMM scans of the POSS-I plates for nearly objects. For these reasons, as well as because of the effect seen in Figure 4, we will use our internal zero-point calibration based on galaxies and QSOs.
2.8 Completeness
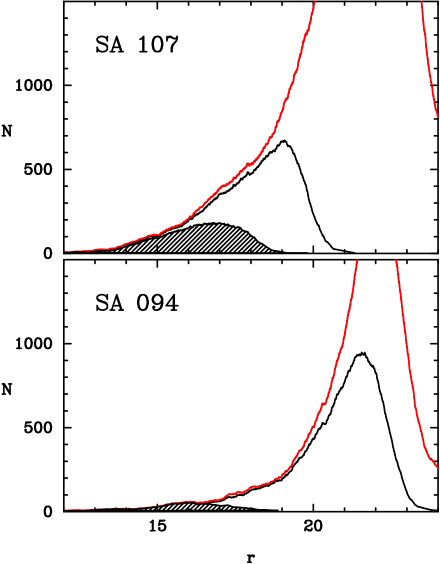
In Figure 7 we show the distribution of objects detected as a function of magnitude in two fields, SA 107 a typical field in our survey, and SA 94, a deep field that includes 4-m plates. The SDSS distribution is represented with a red line, our survey with a black line, and the hatched area is that fraction of our stars that were measured on the old 60-inch plates. For a typical survey field, our catalog is nearly complete to , and this magnitude limit varies slightly from field to field depending on the deepness of the POSS-I plates. Figure 7 shows that the SDSS distribution and our catalog distribution follow each other closely. A difference between the SDSS and our catalog counts is however present between and 19. This difference indicates that SDSS has 6 to more counts than our catalog. For these two fields, we have checked by hand the objects that appear in SDSS and do not appear in our catalog. We found that the absence of these objects from our catalog is due to two reasons: (1) from its construction (Section 2.6) our catalog misses high (greater than mas/yr) proper-motion stars, and (2) SDSS has a non-negligible number of spurious detections near bright stars that, upon inspecting the SDSS images, appear to be located on diffraction spikes. We note that the latter objects have SDSS flags that qualify them as real, primary detections (i.e., flag “GOOD”). To correctly quantify the contribution of each of these effects is not a trivial matter. If we assume however that the SDSS represents the true counts, we then obtain a conservative estimate of our completeness limit which is greater than to . The limiting magnitude at completeness is . For fields that include 4-m plates, the catalog is near-complete (greater than ) to and reaches a limiting magnitude of at completeness.
3 Results
In what follows we show proper-motion results in SA fields containing some currently known halo substructures. Quantitative analyses that involve absolute proper motions combined with other information and with models will be presented elsewhere.
3.1 Sagittarius Tidal Tails
Based on Hess diagrams, Newberg et al. (2002) have identified overdensities of F-colored stars related to debris from the Sagittarius dwarf in the regions labeled S167-54-21.5 (their Fig. 7), and S341+57-22.5 (their Fig. 5). The latter region includes our SA 105 and 106. We find however very little evidence of clumpiness in the proper-motion diagram because Sgr’s main sequence turnoff is at very faint magnitudes (). A small number of Sgr red clump stars at may be present in SA 105 and 106, but these are at the faint end of our survey and will have large proper-motion uncertainties. This SDSS region samples distant parts of the leading tidal tail of Sgr (see Fig. 1 and e.g., Majewski et al. 2003). Thus we no longer consider these fields here.
The SDSS region S167-54-21.5 includes SA 93 at and SA 94 at , and it samples the trailing tidal tail of Sgr, which is generally closer to the Sun than the leading trail (e.g., Majewski et al. 2003). Yanny et al. (2003, 2004), Majewski et al. (2004) and Law et al. (2005) confirm with radial velocities the presence of Sgr debris in this region. In Figure 8 we show the SDSS CMDs and relative proper-motion distributions for SA 94, 93 and 107. The middle and right hand panels show proper motions: the direction corresponds to proper motions along RA, and the direction to Dec. Each row represents one field. SA 107 located at was chosen for comparison with the other two fields, and it is roughly symmetrically placed in the Galaxy with SA 94. The reddening is relatively low in all fields: for SA 93 it is , for SA 94 it is , and for SA 107 it is 0.11 (Schlegel, Finkbeiner, & Davis 1998). The CMDs show objects in the SDSS that were matched with our proper-motion survey. Galaxies according to the SDSS classification were eliminated. The magnitudes and colors are not dereddened. For SA 94, where we have better statistics for the QSOs than in the other fields, we highlight the QSOs with red symbols so that their proper-motion distribution can be compared to that of stars.
The middle panels show the proper-motion distribution of blue stars () chosen to represent the turnoff of thick disk and halo stars, and the right panels that of red stars () chosen to represent more nearby, disk dwarf stars. Sgr’s turnoff is visible in the CMDs of SA 94 and 93, at . SA 107 is also located in the SDSS region S6+41-20, which Newberg et al. (2002) find is most consistent with a smooth halo/thick disk population. Because of its direction toward the inner Galaxy and the fact that the scale length of the thick disk is 3-4 kpc (e.g., Jurić et al. 2006), SA 107 samples more thick disk stars than SA 94. The proper-motion distributions show the intrinsic dispersion convolved with the proper-motion measurement uncertainty, which increases with magnitude.
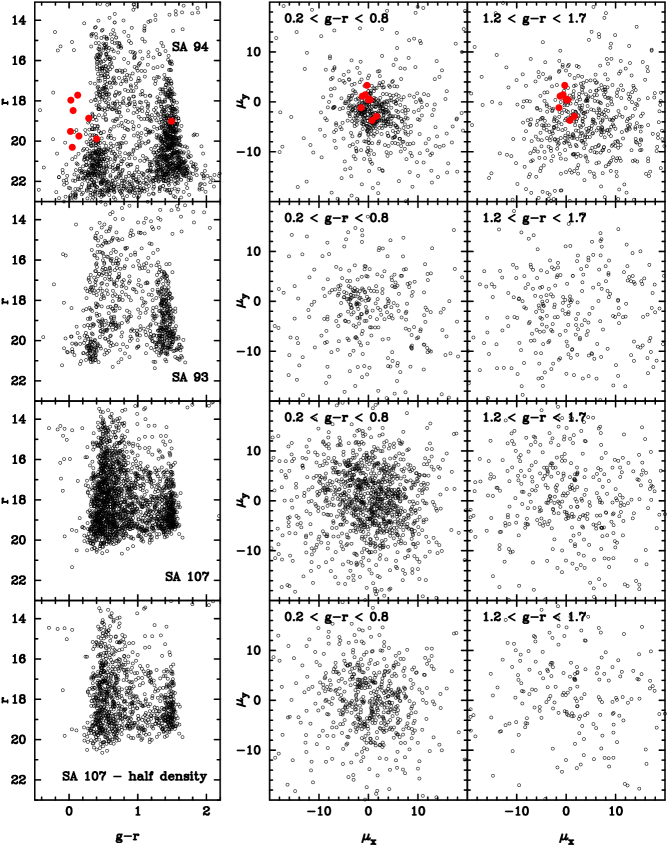
By comparing the Figure 8 proper-motion distribution of presumably nearby red stars in all fields, it is clear that SA 94 is a much better measured field — a result of having 4-m plates in its time series data. The proper-motion uncertainties for SA 93 and SA 107 are however comparable to one another. The proper-motion distribution in SA 107 shows a clear kinematical distinction between blue stars — i.e., distant thick disk and halo stars near the main sequence turnoff — and red, nearby dwarf stars. The fourth row shows the same diagrams as in the third row, but with only half the stars in SA 107 plotted so as to approximately match the number of stars in SA 94 in the appropriate magnitude range. It is evident that the blue stars in SA 94 and 93 show more concentrated clumping in proper-motions due to the presence of a population with a dispersion much tighter than that expected for random thick-disk/halo stars (i.e., SA 107).
This identified proper-motion clumpiness together with a sudden overdensity of stars at a particular magnitude in the CMD is a clear signature of distinct substructure in the halo, presumably dominated by Sgr tidal debris. In SA 94, the best measured field, the proper-motion scatter of the clumped, blue stars is mas/yr. This number is determined primarily by faint stars () and reflects our proper-motion uncertainty. In this contribution we present the mean absolute proper motion of candidate Sgr debris in SA 94 and 93.
In SA 94, the correction to absolute proper motion is given by the error-weighted mean of two determinations: that with respect to QSOs and that with respect to galaxies. The former determination is the average of nine QSOs and it is mas/yr and mas/yr. The latter includes 885 galaxies with magnitudes between and 21 that have measurements on at least four plates and proper-motion values less than 20 mas/yr in both coordinates. Their average proper motion is mas/yr and mas/yr. The error-weighted average of these two determinations is: mas/yr and mas/yr. Candidate Sgr stream stars were selected based on the SDSS CMD (Fig. 8) to belong to the turnoff region. Only stars with measurements on at least four plates and with magnitudes brighter than 21.7 were included, to avoid stars with highly uncertain proper motions. Furthermore, stars with proper motion values larger than 15 mas/yr are eliminated as outliers. In this way, the sample of Sgr candidates consists of 156 objects. To determine their mean and dispersion, we have used the probability-plot method (Hamaker 1978) using the inner of the proper-motion distribution. By doing so we aim to eliminate the minor contribution of distant halo stars to the estimate of the mean proper-motion of the candidates. The Besancon model (Robin et al. 2003) predicts 21 halo stars in the CMD region and proper-motion range used to select Sgr debris candidates. Therefore the chosen contamination fraction of seems to slightly overestimate the Besancon model output. We find the mean relative proper-motion of Sgr debris candidates in SA 94 is mas/yr and mas/yr. By using fractions between and , the estimate of the mean did not change within its formal uncertainty. The mean absolute proper motion for candidate Sgr debris in SA 94 is therefore mas/yr and mas/yr.
For SA 93 we also present a preliminary value for Sgr stream candidates. We plan to improve both determinations for SA 93 and 94 by obtaining radial velocity data that will help establish membership to the stream. For SA 93, the correction to absolute proper motion is given by galaxies and QSOs together, rather than two independent measurements as was done for SA 94. This is because there are only 2 QSOs measured on this field, one of which is a galaxy as well. Proceeding in a similar manner as for SA 94, we obtain the correction to absolute proper motion as given by the mean of 222 extragalactic objects: mas/yr and mas/yr. Since there are far fewer Sgr candidates in SA 93 than in SA 94, we have made use of all stars within to 20 and to 0.9 to determine the mean motion, since some subgiant and red clump stars may also be present besides the turnoff stars. In this case the halo contamination is much more important than in SA 94, and probability plots will not give an accurate result. We have thus simply selected the candidates by defining a very conservative proper-motion cut: a circular region of radius mas/yr that encompasses the proper-motion clump seen in Figure 8. The mean is thus based on 63 stars, and it is: mas/yr and mas/yr. The uncertainties are derived from the scatter given by the 63 Sgr candidates. We caution that this uncertainty is formally low because it does not account for the uncertainty in choosing Sgr stream members. Finally, the absolute proper motion for Sgr candidates in SA 93 is: mas/yr and mas/yr. We regard this number as preliminary, and with uncertainties possibly underestimated. In both SA 94 and 93 determinations the membership to the stream is the major source of error.
Majewski et al. (2006) have shown that by measuring the proper motion of Sgr debris, especially along the trailing tail, one can determine the rotation velocity of the Local Standard of Rest (LSR), whereas Law et al. (2005) and Johnston et al. (2005) show how the dynamics of the Sgr arms are also affected by the flattening, , of the Galactic potential. In Figures 9 and 10 we show proper-motion predictions by Law et al. (2005) for Sgr tidal debris in the direction of SA 93 and SA 94 compared to the observed results found here in these two fields. The proper motions are shown as a function of the longitude along Sgr’s orbit (Majewski et al. 2003); corresponds to the main body of Sgr and increases in the trailing direction. In Figure 9, the adopted velocity of the LSR is 220 km/s, while the flattening of the halo , has three values corresponding to prolate (top), spherical (middle) and oblate (bottom) halos. In Figure 10, the adopted flattening of the halo is , and the velocity of the LSR varies from 260 km/s to 180 km/s, as indicated in each panel. The general agreement between our proper motion results and the model, which was constrained solely from the distribution and radial velocities of M giants (Majewski et al. 2003, 2004) and a given Galactic potential (i.e., no proper-motion data), is remarkable. This correspondence reinforces the assumption that we are measuring proper motions in Sgr’s tidal stream. We note that the proper-motion range shown in Figs. 9 and 10 is only mas/yr, a typical value for the proper-motion uncertainty per well-measured star in catalogs such as Tycho2 (Hog et al. 2000), SPM 3 (Girard et al. 2004). To better illustrate this, we include here the mean absolute proper motion of red field stars (see also Fig. 8). In SA 94, we obtain mas/yr and mas/yr, and in SA 93, mas/yr and mas/yr. Thus, along RA the mean proper-motions of red field stars in both areas lie outside the proper-motion range shown in Figs. 9 and 10.
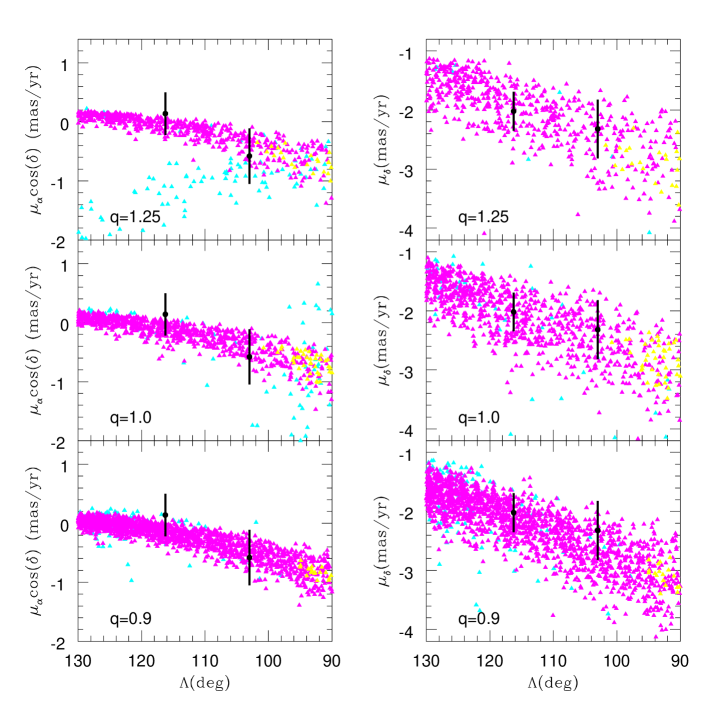
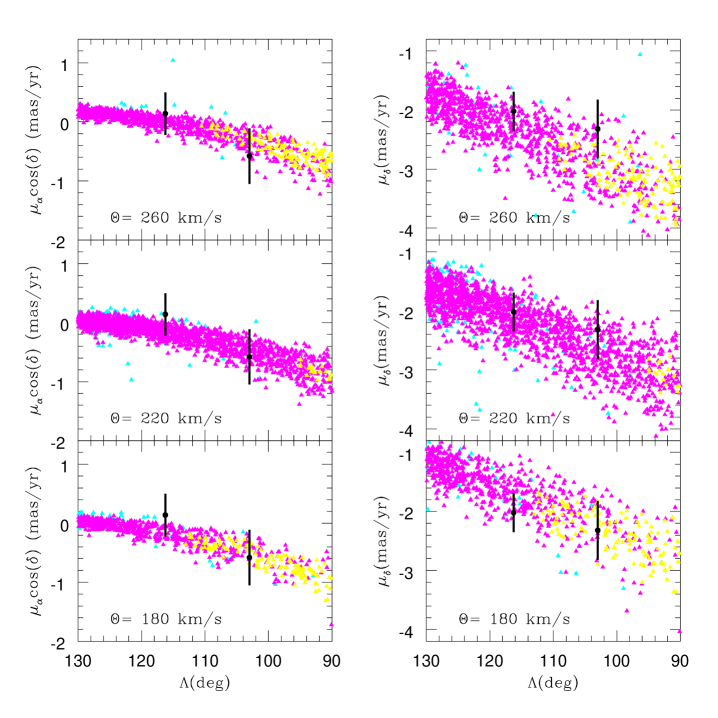
While our preliminary proper motions in only two SA fields do not yet lend discriminatory power between the Galactic models shown, with improved proper motion samples and the inclusion of additional fields at other (e.g., SA 116 and 117; see Fig. 1) we expect to be able to more rigorously address this issue in the near future.
3.2 The Monoceros Structure
In Figure 11 we show similar plots to those in Figure 8 for the fields SA 96 at , SA 100 at , and SA 101 at . These areas sample regions in the Monoceros structure at the anticenter and across the Galactic plane. For SA 96, the data for the CMD are not in the available SDSS data releases. We have obtained the data set from B. Yanny, and the photometry is dereddened for this field. Reddening is however rather low for all three of these fields: for SA 96, for SA 100 and for SA 100. Since the data for SA 96 are dereddened, we have shifted blueward the color ranges for selecting blue and red stars, by 0.1 mag compared to the other fields (Fig. 11). Newberg et al. (2002) designate the region containing SA 96 as S200-24-19.8, for which their Fig. 15 shows a clear main sequence turnoff at . SA 100 is located only away from the eastern edge of S223+20-19.4, which also displays a clear main sequence with the turnoff at (see Fig. 12 in Newberg et al. 2002). At , SA 101 is farther away from the Monoceros ring (see also Fig. 1). The majority of the stars measured in our survey are however brighter than these turnoffs and the corresponding main sequence stars that were studied by SDSS and assigned to the Monoceros structure.
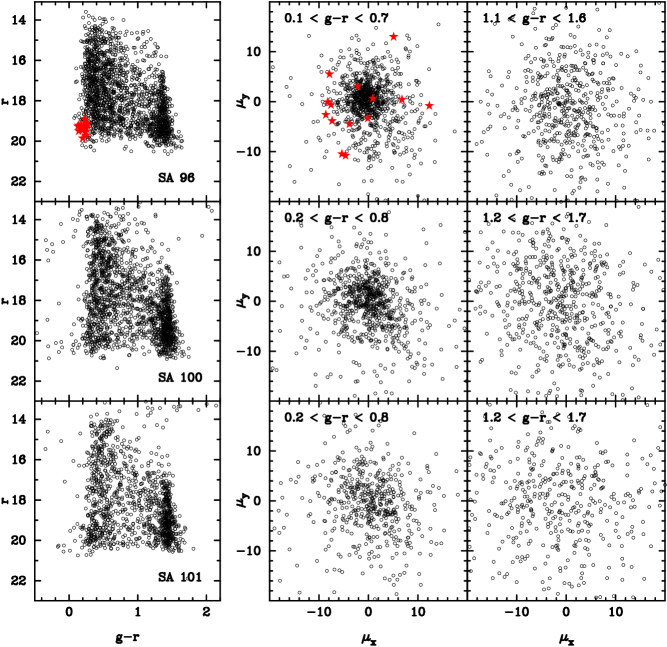
Yanny et al. (2003, 2004) measured radial velocities of candidate turnoff stars in the Monoceros ring to demonstrate that their dispersion is indicative of a kinematically cold stream (but cf. Crane et al. 2003). In Fig. 11, top row, the red symbols are the stars in our SA 96 field that have radial velocities measured by Yanny et al. (2003, 2004). These stars are at the faint limit of our survey, therefore their proper motions are quite uncertain. Since the mean radial velocity of the candidate Monoceros stars overlaps with that of the thick disk (Yanny et al. 2003, 2004), it is also possible that some of the stars are indeed thick disk stars, i.e., have a larger proper-motion dispersion that that of a cold stream. The tight clump seen in the proper-motion diagram of blue stars in SA 96 is comprised of stars with to 19. Are these only thick disk/halo stars? Comparing SA 96 with SA 100 which is located at the same latitude as SA 96, only above the plane, and only away in longitude from SA 96, we sample very similar parts of the major Galactic components. However, there is a clear difference in the number of blue stars in the two regions. A careful inspection of Fig. 15 in Newberg et al. (2002) which corresponds to SA 96 suggests that multiple main sequences and turnoffs may be present, with the faintest one in SDSS being the most distinct. To better illustrate the proper-motion clumpiness in SA 96, we show a zoomed-in proper-motion diagram of the blue stars (as defined in Fig. 11) for SA 96 (left panels) and SA 100 (right panels) in Figure 12. The middle and bottom panels show the proper motions as a function of magnitude. The stellar excess as well as the proper-motion tightness in SA 96 are obvious when compared to SA 100.

The stellar excess is also apparent when comparing the proper-motion distributions in the three fields with those predicted by the Besancon Galactic model (Robin et al. 2003) which obviously contains only the major Galactic components. In Figure 13 we show the absolute proper-motion distribution along one coordinate (RA, for example) in all three fields as determined from the Besancon Galactic model (Robin et al. 2003) (top panels), and from our data (bottom panels). The filter system of the Besancon models is the CFHT MEGACAM system which is very close to the SDSS system. At any rate, we are interested only in relative comparisons between fields, rather than a direct comparison between data and model counts. The model proper motions were convolved with a 1 mas/yr proper-motion uncertainty to approximately match the errors of the observed proper motions.
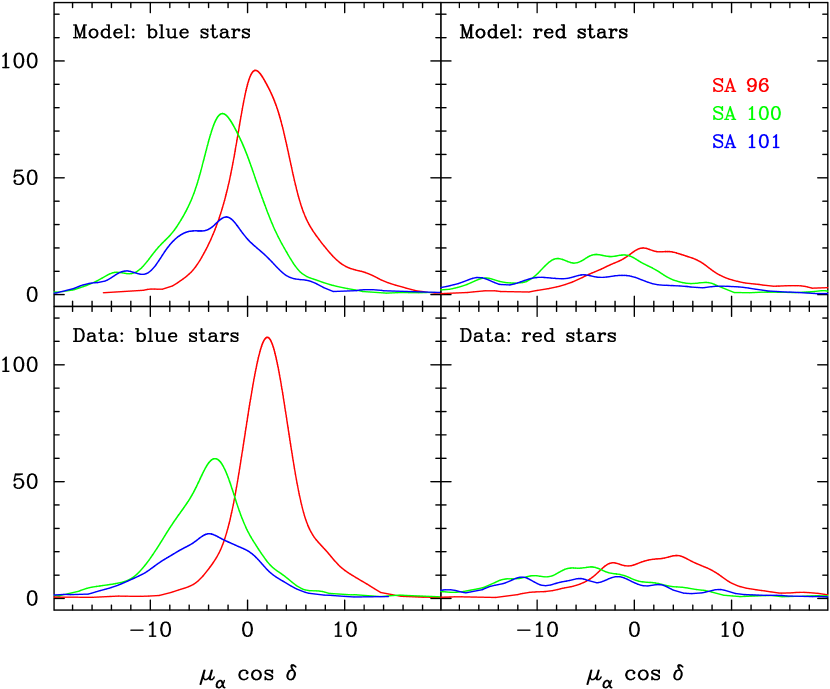
The distributions were constructed for blue and red stars as defined above (see also Fig. 11) and in the magnitude range to 19. SA 96 is represented with a red line, SA 100 with a green line and SA 101 with a blue line. Rather than comparing directly the distributions given by the data with those given by the model for each field, we proceed to do a relative comparison as follows. We compare pairs of fields, i.e. take ratios of the distributions as given separately by the data and the model for SA 100 and SA 101, and for SA 96 and SA 100. These ratios are readily apparent from the plot as given by the areas under each curve. Alternatively, one can use the ratios of the peaks for pairs of fields. By doing so, for the red stars it is apparent that the observations are in good agreement with the model predictions. For the blue stars, the ratios of the proper-motion distributions for SA 100 and SA 101 as given by the model and the observations are in reasonably good agreement. However, this is not the case for the ratios for SA 96 and SA 100. Clearly the data show that SA 96 has an excess of stars when compared to the model predictions. We also note here the good agreement between model and data for the displacement in absolute proper motion between fields as the Galactic plane is crossed.
One interpretation for the excess counts in SA 96 is that in this region we see multiple, wrapped streams from the Monoceros structure, with the most distant one detected by SDSS at kpc. Our preliminary absolute proper motion for candidate Mon stars in SA 96 indicates a thick-disk-like motion in agreement with the recently-modeled orbit of the Mon system by Peñarrubia et al. (2005). Another possible interpretation is that the excess stars in SA 96 are part of the Canis Major overdensity, under the assumption that this overdensity is the core of a disrupted dwarf galaxy. The nature of this overdensity is strongly debated in the current literature. Other interpretations besides the dwarf galaxy hypothesis are: the overdensity is the warp of the Galactic disk (e.g., Momany et al. 2006), a spiral arm in the warped disk (e.g., Carraro et al. 2005), and the periphery of a system centered in the region of the Argo constellation (Rocha-Pinto et al. 2006). Currently, no interpretation of the reported CMa overdensity is clearly proved or widely accepted. If CMa proves to be any of the above interpretations other than the dwarf galaxy one, then the excess in SA 96 is very unlikely to be related to the CMa overdensity, primarily because of its location. We therefore explore the possible connection between SA 96 and the CMa overdensity interpreted as a dwarf galaxy.
In a recent wide-area study of the distribution of red clump stars from 2MASS, Bellazini et al. (2006) map out the overdensity in Canis Major, as well as the Galactic warp. From their study, CMa stands out as a distinct overdensity in the outer regions of the Galactic disk. More importantly, because it is so nearby, CMa covers a large portion of the sky, and the geometry is such that at lower longitudes, toward the anticenter, CMa is closer to the Sun ( kpc) than its core, which is supposedly at kpc (Bellazzini et al. 2006, Martinez-Delgado et al. 2005). Two figures in Bellazzini et al. (2006) support the notion that SA 96 may be on the outskirts of the reported CMa overdensity: (a) their Figure 9 (top panel), which shows the excess of surface density of CMa and indicates that CMa is extended away from the Galactic plane at longitudes closer to the Galactic Anticenter; and (b) Figure 13 (bottom panel) of Bellazini et al., which shows a Sgr-type galaxy placed at the distance and location of CMa. Indeed its putative extension is impressive, and SA 96 would lie at the tidal radius of such a system. Another indication that the system may be elongated in the direction of Galactic rotation and away from the plane is the motion of CMa as measured by Dinescu et al. (2005b): the velocity component is km/s, while the component is km/s. Radial velocities of our proper motion stars in the field of SA 96 should help clarify this issue and hopefully lend further clues to the nature of Mon and CMa structures.
We proceed now to estimate the proper-motion uncertainty by assuming that the blue stars in the proper-motion clump seen in SA 96 belong to a kinematically cold system, and therefore their proper-motion dispersion reflects measurement errors only. In the proper-motion diagram of SA 96, in Fig. 12 there appear to be two overlapping proper-motion clumps with different dispersion: one less tightly clumped, centered at mas/yr and a “radius” of mas/yr, and the other more tightly clumped centered at mas/yr and a “radius” of mas/yr. Selecting stars within the radius of the less tight clump, and within to 18, we obtain a proper-motion scatter of 1.6 mas/yr. Similarly, for the tighter clump we obtain a proper-motion scatter of mas/yr. These numbers are only approximate estimates to illustrate the precision of the proper motions in this work. A rigourous kinematical understanding and therefore a better separation of these two clumps is beyond the scope of this paper. This will be addressed in future work where radial velocities will be considered also. One more cautionary note should be made: the population of the less tight proper-motion clump seems to appear as well in SA 100 (Fig. 12), and may therefore be representative of distant halo/thick disk stars, i.e., a population with a non-negligeable intrinsic proper-motion dispersion.
4 Summary
We describe our ground-based, photographic absolute proper-motion survey along three near-equatorial declination zones. Proper motions are derived in fields from a collection of 2.5-m Du Pont, 4-m Mayall, 60-inch Mt. Wilson and POSS-I plates. The time baseline varies between 40 and 85 years. We have demonstrated that we obtain proper-motion uncertainties between and 3 mas/yr per star down to a magnitude of 19, and for a few fields down to 21. The typical uncertainty in the correction to absolute proper motions as given by galaxies and QSOs is between 0.2 and 0.8 mas/yr. The described proper-motion survey is complemented by our own ongoing radial-velocity and photometric follow-up programs as well as by current surveys such as SDSS, QUEST, etc. The characteristics of this proper-motion survey make it suitable to address many topics related to both the main Galactic components, and the tidal features seen in the halo and associated with streams from disrupted satellites. In this contribution, we present preliminary results in the southern trailing tidal tail of Sgr and in the Monoceros ring region.
We thank Stephen Levine from USNO-Flagstaff for making available the POSS-I USNO scans. SRM is grateful to the Carnegie Observatories and its former director Augustus Oemler for a Carnegie Visiting Associateship that made possible the collection of the Du Pont plates used in this survey. The financial support from NSF grants AST-0406884 and AST-0407207 for this research is acknowledged.
This publication makes uses of SDSS data products. Funding for the SDSS and SDSS-II has been provided by the Alfred P. Sloan Foundation, the Participating Institutions, the National Science Foundation, the U.S. Department of Energy, the National Aeronautics and Space Administration, the Japanese Monbukagakusho, the Max Planck Society, and the Higher Education Funding Council for England. The SDSS Web Site is http://www.sdss.org/.
References
- (1) Bellazzini, M., Ibata, R., Martin, N., Lewis, G. F., Conn, B., & Irwin, M., J. 2006, MNRAS, 366, 865
- (2) Bertin, E., & Arnouts, S. 1996, A&AS, 117, 393
- (3) Carraro, G., Vázquez, R, A., Moitinho, A., & Baume, G. 2005, ApJ630, 153
- (4) Chiu, L.-T. G. 1908, ApJS, 44, 31
- (5) Cohen J. G. 2004, AJ, 127, 1545
- (6) Conn, B. C., Lewis, G. F., Irwin, M. J., Ibata, R. A., Ferguson, A. M. N., Tanvir, N., & Irwin, J. M. 2005a, MNRAS, 362, 475
- (7) Conn, B. C., Martin, N. F., Lewis, G. F., Ibata, R. A., Bellazzini, M., & Irwin, M. J. 2005b, MNRAS, 364, 13
- (8) Crane, J. D., Majewski, S. R., Rocha-Pinto, H. J., Frinchaboy, P. M., Skrutskie, M. F., & Law, D. R. 2003, ApJ594, L119
- (9) Dinescu, D. I., Majewski, S. R., Girard, T. M., Méndez, R. A., Sandage, A., Siegel, M. H., Kunkel, W. E., Subasavage, J. P., & Ostheimer, J. 2002, ApJ, 575, 70
- (10) Dinescu, D. I., Majewski, S. R., Girard, T. M., & Cudworth, K. M.,2000, AJ, 120, 1892
- (11) Dinescu, D. I., Majewski, S. R., Girard, T. M., Méndez, R. A., Sandage, A., Siegel, M. H., Kunkel, W. E., Subasavage, J. P., & Ostheimer, J. 2002, ApJ, 575, L67
- (12) Dinescu, D. I., Girard, T. M., van Altena, W. F. & López, C. E. 2005a, ApJ, 618, 25
- (13) Dinescu, D. I., Martínez-Delgado, D., Girard, T. M., Peñarrubia, J., Rix, H-W., Butler, D., & van Altena, W. F. 2005b, ApJ, 631, 49
- (14) Duffau, S. Zinn, R., Vivas, A. K., Carraro, G., Méndez, R. A., Winnick, R., & Gallart, C. 2006, ApJ, 636, 97
- (15) Girard, T. M., Platais, I., Kozhurina-Platais, V., van Altena, W, F. & López, C. E. 1998, AJ, 115, 855 reference Girard, T. M., Dinescu, D. I., van Altena, W. F., Platais, I., Monet, D. G., & López, C. E. 2004, AJ, 127, 3060
- (16) Guo, X., Girard, T. M., van Altena, W. F., & López, C. E., 1993, AJ, 105, 2182
- (17) Hamaker, H. C. 1978, Applied Statistics, 27, 76
- (18) Hog, E, Fabricius, C, Makarov, V. V., Urban, S., Corbin, T., Wycoff, G., Bastian, U., Schwekendiek, P., & Wicenec, A. 2000, A&A, 355, 27
- (19) Ibata, R. A., Irwin, M., Lewis, G. F., & Stolte, A. 2001, ApJ, 547, L133
- (20) Ibata, R. A., Irwin. M. J., Lewis, G. F., Perguson, A. M. N., & Tanvir, N. 2003, MNRAS, 340, 21
- (21) Johnston, K. V., Zhao, H., Spergel, D. N., & Hernquist, L. 1999, ApJ, 512, L109
- (22) Jurić, M., Ivezić, Z., et al. 2006, ApJ, in press
- (23) Klemola, A., Jones, B. F., & Hanson, R. B. 1987, AJ, 94, 501
- (24) Law, D. R., Johnston, K. V., & Majewski, S. R. 2005, ApJ619, 807
- (25) Lee, J.-F., & van Altena, W. F. 1983, AJ, 88, 1683
- (26) Majewski, S. R. 1992, ApJSupp, 78, 87
- (27) Majewski, S. R., Skrutskie, M. F., Weinberg, M. D., & Ostheimer, J. C. 2003, ApJ, 599, 1115
- (28) Majewski, S. R. et al. 2004, AJ128, 245
- (29) Majewski, S. R., Law, D. R., Polak, A. A., & Patterson, R. J. 2006, ApJ, 637, 25
- (30) Martin, N. F, Irwin, M. J., Ibata, R. A., Conn, B. C., Lewis, G. F., Bellazzini, M., Chapman, S., & Tanvir, N. 2006, MNRAS, in press
- (31) Martin, N. F., Ibata, R. A., Bellazzini, M., Irwin, M. J., Lewis, G. F., & Dehnen, W. 2004, MNRAS, 348, 12
- (32) Martínez-Delgado, D., Butler, D. J., Rix, H. W., Franco, Y. I., Peñarrubia, J., Alfaro, E. J., & Dinescu, D. I. 2005, ApJ, 633, 205
- (33) Martínez-Delgado, D., Zinn, R., Carrera, R., & Gallart, C. 2002, ApJ, 573, 19
- (34) Momany, Y., Zaggia, S., Gilmore, G., Piotto, G., Carraro, G., Bedin, L. R., & De Angeli, F. 2006, A&Ain press
- (35) Monet, D. G. et al. 2003, AJ, 125, 984
- (36) Morrison, J. E., Roser, S., McLean, B., Bucciarelli, B., & Laker, B. 2001, AJ, 121, 1752
- (37) Munn, J. A. et al. 2004, AJ, 127, 3034
- (38) Newberg, H. J. et al. 2002, ApJ, 569, 245
- (39) Peñarrubia, J., Martínez-Delgado, D., Rix, H. W., Gómez-Flechoso, M. A. Munn, J., Newberg, H., Bell. E. F., Yanny, B., Zucker, D. & Grebel, E. K. 2005, ApJ, 626, 128
- (40) Rocha-Pinto, H. J., Majewski, S. R., Skrutskie, M. F. & Crane, J. D. 2003, ApJ594, 115
- (41) Rocha-Pinto, H. J., MAjewski, S. R., Skrutskie, M. F., Crane, J. D., & Patterson, R. J. 2004, ApJ, 615, 732
- (42) Rocha-Pinto, H. J., Majewski, S. R., Skrutskie, M. F., Patterson, R. J., Nakanishi, H., Muñoz, R., R., & Sofue, Y. 2006, ApJ, 640, 147
- (43) Robin, A. C., Reylé, C., Derrière, & Picaud, S. 2003, A&A, 409, 523
- (44) Schneider, D. P. et al. 2005, AJ, 130, 367
- (45) Schlegel, D. J., Finkbeiner, D. P., & Davis, M. 1998, ApJ, 500, 525
- (46) Sears, F. H., Kapteyn, J. C., & van Rhijn, P. J. 1930, “Mount Wilson Catalogue of Photographic Magnitudes in Selected Areas 1-139”, Carnegie Institutions of Washington
- (47) Valdes, F. 1982, Proc SPIE, 331, 465
- (48) Vivas, K. A., Zinn, R., Abad, C., Andrews, P., Bailyn, C., Baltay, C., Bruzual, G., et al. QUEST collaboration 2004, AJ, 127, 1158
- (49) Yanny, B., Newberg, H. J., Grebel, E. K., Kent, S., Odenkirchen, M., Rockosi, C. M., Schlegel, D., Subbarao, M., Brinkmann, J., Fukugita, M., Ivezik, Z., Lamb, D. Q., Schneider, D. P., & York, D. G. 2003, ApJ, 588, 824
- (50) Yanny, B., Newberg, H. J., Grebel, E. K., Kent, S., Odenkirchen, M., Rockosi, C. M., Schlegel, D., Subbarao, M., Brinkmann, J., Fukugita, M., Ivezik, Z., Lamb, D. Q., Schneider, D. P., & York, D. G. 2004, ApJ, 605, 575
- (51) Zacharias, N., Urban, S. E., Zacharias, M. I., Wycoff, G. L., Hall, D. M., Monet, D. G., & Rafferty, T. J. 2004, AJ, 127, 3043