Extremely Red Objects in Two Quasar Fields at z 1.4111Based in part on data collected at the Subaru Telescope, which is operated by the National Astronomical Observatory of Japan; on data obtained with the Chandra X-Ray Observatory, which is operated for the National Aeronautics and Space Administration by the Smithsonian Astrophysical Observatory; on data obtained at the Canada-France-Hawaii Telescope, which is operated by the National Research Council of Canada, the Institut National des Sciences de l’Univers of the Centre National de la Recherche Scientifique of France, and the University of Hawaii; and on data obtained at the The United Kingdom Infrared Telescope, which is operated by the Joint Astronomy Centre on behalf of the U.K. Particle Physics and Astronomy Research Council. Some of the data presented herein were obtained at the W. M. Keck Observatory, which is operated as a scientific partnership among the California Institute of Technology, the University of California and the National Aeronautics and Space Administration. The Observatory was made possible by the financial support of the W. M. Keck Foundation.
Abstract
We present an investigation of the properties and environments of bright extremely red objects (EROs) found in the fields of the quasars TXS 0145+386 and 4C 15.55, both at . There is marginal evidence from Chandra ACIS imaging for hot cluster gas with a luminosity of a few ergs s-1 in the field of 4C 15.55. The TXS 0145+386 field has an upper limit at a similar value, but it also clearly shows an overdensity of faint galaxies. None of the EROs are detected as X-ray sources. For two of the EROs that have spectral-energy distributions and rest-frame near-UV spectra that show that they are strongly dominated by old stellar populations, we determine radial-surface-brightness profiles from adaptive-optics images. Both of these galaxies are best fit by profiles close to exponentials, plus a compact nucleus comprising % of the total light in one case and 8% in the other. Neither is well fit by an -law profile. This apparent evidence for the formation of massive disks of old stars in the early universe indicates that at least some galaxies formed essentially monolithically, with high star-formation rates sustained over a few years, and without the aid of major mergers.
1 Introduction
Galaxies classified as extremely red objects (EROs; e.g., Daddi et al. 2000; Chapman et al. 2000; Stockton 2001; Cimatti et al. 2002; Saracco et al. 2004; Yan, Thompson, & Soifer 2004; Daddi et al. 2004; earlier references can be found in these papers) are usually defined to have greater than a value somewhere in a range of 5–6. They have long been known to include at least two disparate classes. Some are highly reddened high-redshift star-forming galaxies (e.g., Dey et al. 1999; Cimatti et al. 2002; Yan et al. 2004b). The remainder are almost exclusively galaxies with whose stellar populations are already ancient and have little admixture from more recent star formation (e.g., Stockton, Kellogg, & Ridgway, 1995; Dunlop et al., 1996; Spinrad et al., 1997; Soifer et al., 1999; Liu et al., 2000; Stockton, 2001; Stockton, Canalizo, & Maihara, 2004; Chen & Marzke, 2004; Cimatti et al., 2004; Fu, Stockton, & Liu, 2005). For convenience, we shall henceforth simply refer to this latter class as “old galaxies” (OGs; however, note that this term refers to the age of the stellar population, not necessarily the age of assembly of the galaxy itself). These OGs represent the earliest major episodes of star formation in the universe, and they seem to have formed the overwhelming majority of their stars over a very short period. Accordingly, they potentially offer us an avenue to investigate the formation and early evolution of the very first massive galaxies to appear in the universe.
There have been a number of discussions of the mix of morphologies in various samples of EROs. It is commonly assumed that morphological types are surrogates for the two classes of EROs mentioned above; i.e., that spheroidals as a group are more-or-less congruent with galaxies dominated by old stellar populations and that disk-like galaxies and those showing obvious merging activity are dusty star-forming galaxies (Moriando, Cimatti, & Daddi, 2000; Stiavelli & Treu, 2001; Smith et al., 2002; Sawicki et al., 2005). Nevertheless, both Gilbank et al. (2003) and Yan, Thompson, & Soifer (2004) mention the possibility of truly passive disk-dominated galaxies. Iye et al. (2003) seem to have found such a galaxy at , and Stockton, Canalizo, & Maihara (2004) and Fu, Stockton, & Liu (2005) have shown examples of galaxies that seem to be essentially pure disks of old stars at and , respectively.
So far, the morphologies of only a few OGs at redshifts significantly greater than 1 have been studied in any detail (e.g., Bunker et al. 2003; Stockton, Canalizo, & Maihara 2004; Yan, Thompson, & Soifer 2004; Cimatti et al. 2004; Fu, Stockton, & Liu 2005; Daddi et al. 2005). Here we present an investigation of the morphologies and environments of 3 OGs (and 1 dusty star-forming galaxy) found in the fields of the quasars TXS 0145+386 () and 4C 15.55 (). We assume a flat cosmology with and .
2 Observations and Data Reduction
2.1 Optical and Near-IR Observations
The two fields discussed in this paper are part of a larger sample identified from a survey of the fields of (radio-loud) quasars with . We have chosen to observe quasar fields in this redshift range for three reasons. First, there is the simple and practical observational matter that, for our near-IR observations, it is necessary to have one or more objects in each field that will be detected in single short exposures and that can be used to center each dithered frame that is coadded to make the final image. Centering the field on a quasar ensures that at least one such object will be present, even when our field size is relatively small. Second, radio sources at high redshifts appear to mark regions that include those of high overdensity (e.g., Best 2000; Best et al. 2003; Barr et al. 2003; Röttgering et al. 2004), which are precisely the regions in which most models expect processes of galaxy formation and evolution to have proceeded most rapidly. Significantly, compelling results from the 2dF survey show that radio quiet QSOs are much less strongly clustered than are quasars (Croom et al. 2001). Finally, and most importantly, looking for companions to radio sources at a specific redshift allows us to choose redshifts for which the photometric diagnostics from standard broadband filters give the cleanest separation between old galaxy populations and highly reddened star-forming galaxies or other possible contaminants. Specifically, for , the 4000 Å break falls just shortward of the band. At this redshift, an or vs. plot provides excellent discrimination between OGs and most other objects with similar values (Pozzetti & Mannucci, 2000; Stockton, 2001). Cimatti et al. (2003) claim that some star-forming galaxies may have colors similar to those of OGs; however, their Fig. 5, on which this claim is based, seems to depend strictly on morphological classes judged by eye from HST ACS images, rather than on spectroscopic evidence for star formation. This approach assumes that the generally tight correlation between morphology and star-formation rate that applies at the present epoch continues to hold at high redshifts. One of the purposes of the present paper is to discuss evidence that this assumption may not always be valid.
We have used a photometric sieve process to isolate candidates. The initial observations were carried out at with NSFCam on the NASA Infrared Telescope Facility (IRTF). If any objects were found within a 30″ square region surrounding the quasar (limited by the NSFCam field and the dithering amplitude) and with (we use the Vega magnitude scale throughout this paper), we next obtained -band imaging. If (as expected for old stellar populations in this redshift range), we then obtained (and sometimes and/or ) imaging, generally with the Echellette Spectrograph and Imager (ESI) on the Keck II telescope, but sometimes with other CCD systems and telescopes. Since we were searching for systems of old stars with essentially no recent star formation, we required ; this is, of course, by itself, a necessary but not sufficient condition at redshifts for the absence of young stars, because of the possible effects of reddening. However, together with the constraint that , this color requires a sharp inflection in the spectrum consistent with the 4000 Å break for old stellar populations at .
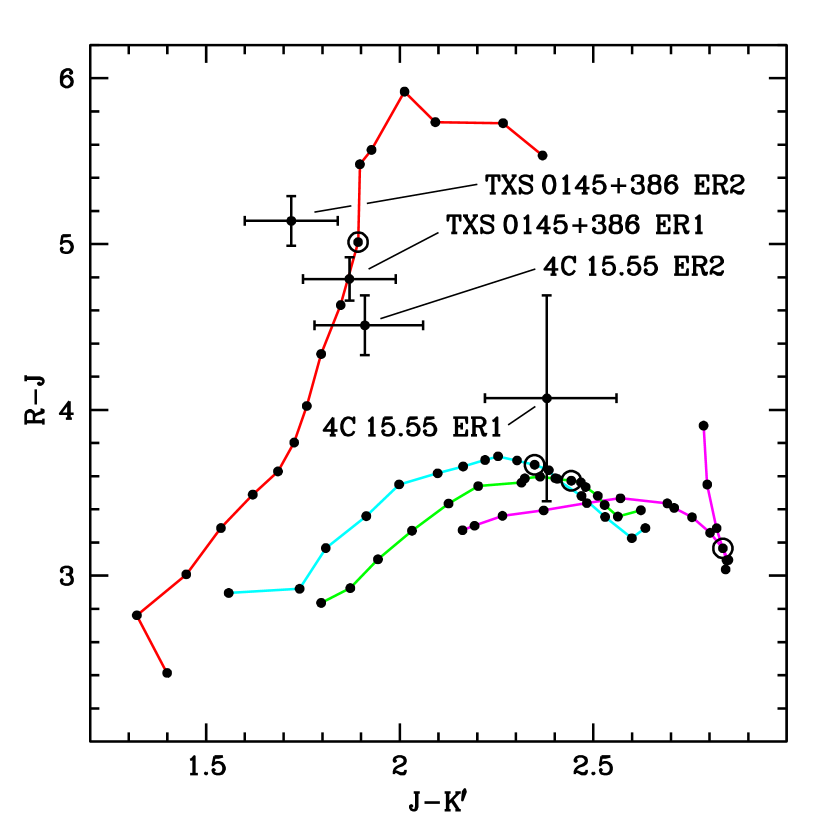
We show traces for an unreddened, passively evolving galaxy and for various models of heavily reddened galaxies as functions of redshift in the — diagram in Fig. 1, along with the positions in this diagram of the 4 objects discussed in this paper. The passively evolving galaxy, deliberately chosen to be an extreme case, is assumed to have formed all of its stars years after the Big Bang. Reddened starbursts are represented by constant-star-formation-rate models, with Calzetti et al. (2000) and Ferrara et al. (1999) reddening adjusted to give at . The reddening curve of Ferrara et al. (1999) used here is that of a pure disk with embedded dust and an inclination of 70° to the line of sight. Finally, we also show a model for continuous, exponentially decreasing star formation, with an -folding time of 5 Gyr and an age of 12 Gyr, again subjected to Calzetti et al. (2000) reddening to give at . The age of this model is of course unrealistic at the redshifts we are considering, but it serves as a proxy for a range of models for which there is a substantial old stellar component coupled with a relatively modest star-formation rate and high reddening.
We will present observations of the larger sample elsewhere. We restrict ourselves here to the TXS 0145+386 and 4C 15.55 fields because we have obtained more complete observations for these fields than for any of the others, including spectroscopy of one OG in each field with the Low-Resolution Imaging Spectrograph (LRIS; Oke et al. 1995) on Keck I and/or ESI on Keck II. The spectroscopy with LRIS always used a 1″ slit or slitmask with a 400 line/mm grating blazed at 8500 Å, and the ESI spectroscopy always used a 125 slit and the echellette mode. Other follow-up observations on the TXS 0145+386 and 4C 15.55 fields include deep imaging with the University of Hawaii 88-inch Telescope (UH88) and the United Kingdom Infrared Telescope (UKIRT), and adaptive optics (AO) imaging with the Canada-France-Hawaii Telescope (CFHT) and the Subaru Telescope (Kobayashi et al., 2000). For the galaxy morphology analysis from AO images, we have obtained PSF information from the closest sufficiently bright star in the field (12″ away for TXS 0145+386 ER1 and 9″ away for 4C 15.55 ER2). By mapping out the PSF variation with position from other stars in the field and from other fields obtained on the same nights, we confirm that there should be no significant change in the PSF over these distances on the nights of our AO observations.
A listing of all of the optical/IR observations relevant to this paper is given in Table 1.
| Date (UT) | Telescope | Instrument | Target | Filter | Exposure | Pixel Scale | Comments |
|---|---|---|---|---|---|---|---|
| 1998 Aug 17 | IRTF | NSFCam | 4C 15.55 Field | 540 s | 030 | ||
| 1998 Aug 17 | IRTF | NSFCam | TXS 0145+386 Field | 540 s | 030 | ||
| 1998 Aug 18 | IRTF | NSFCam | 4C 15.55 Field | 540 s | 030 | ||
| 1998 Aug 18 | IRTF | NSFCam | TXS 0145+386 Field | 540 s | 030 | ||
| 1998 Aug 19 | IRTF | NSFCam | 4C 15.55 Field | 540 s | 030 | ||
| 1998 Aug 19 | IRTF | NSFCam | 4C 15.55 Field | 1620 s | 030 | ||
| 1998 Aug 19 | IRTF | NSFCam | TXS 0145+386 Field | 1080 s | 030 | ||
| 1998 Aug 19 | IRTF | NSFCam | TXS 0145+386 Field | 1080 s | 030 | ||
| 1998 Sep 05 | UH88 | QUIRC | TXS 0145+386 Field | 3000 s | 018 | ||
| 1998 Oct 28 | UH88 | Tek2048 | TXS 0145+386 Field | 12000 s | 022 | ||
| 1998 Oct 29 | UH88 | Tek2048 | TXS 0145+386 Field | 14400 s | 022 | ||
| 1999 Aug 24 | CFHT | Pueo/KIR | TXS 0145+386 Field | 6000 s | 0035 | ||
| 1999 Oct 02 | Keck I | LRIS | TXS 0145+386 Field | 16200 s | 022 | ||
| 1999 Nov 03 | Keck I | LRIS | TXS 0145+386 ER1 | Spec | 16800 s | 022 | 1″ slit |
| 2000 Jun 05 | Keck II | ESI | 4C 15.55 ER2 | Spec | 18000 s | 015 | 125slit, echellette mode |
| 2000 Jun 05 | Keck II | ESI | 4C 15.55 ER1 | Spec | 3600 s | 015 | 125 slit, echellette mode |
| 2000 Oct 03 | Keck II | ESI | TXS 0145+386 ER1 | Spec | 21600 s | 015 | 125 slit, echellette mode |
| 2000 Oct 04 | Keck II | ESI | TXS 0145+386 ER1 | Spec | 19120 s | 015 | 125 slit, echellette mode |
| 2001 Aug 24 | Keck I | LRIS | TXS 0145+386 ER1 | Spec | 10800 s | 022 | slitmask |
| 2002 May 31 | Subaru | CISCO | 4C 15.55 Field | 1920 s | 011 | ||
| 2002 May 31 | Subaru | CISCO | 4C 15.55 Field | 960 s | 011 | ||
| 2002 Aug 07 | Keck II | ESI | 4C 15.55 Field | 2520 s | 015 | Ellis R filter | |
| 2002 Aug 17 | Subaru | IRCS/AO | 4C 15.55 Field | 2160 s | 0058 | ||
| 2003 Dec 05 | UKIRT | UFTI | TXS 0145+386 Field | 8400 s | 0090 |
The optical and IR imaging observations were processed through our standard IRAF reduction pipelines. The spectroscopic data needed more detailed and individual attention, both in the planning of the observations and the reduction, because of the faintness of the objects. For the longslit observations, both with LRIS and with ESI, we arranged a slit position angle that would allow a brighter object to be placed near one end of the slit while the actual target was more-or-less centered. After the individual spectra were flat-fielded, distortion corrected, and wavelength calibrated, the spectrum of the bright object could be used to register the spectra for coadding before extracting the spectrum of the target object. For the ESI observations, the bright object was also necessary to confirm that the echellette orders were properly normalized to each other in the overlap regions before they were combined to make a continuous spectrum.
2.2 X-Ray Observations
The purpose of the Chandra X-ray observations was to search for evidence for cluster gas surrounding the two quasars. The TXS 0145+386 and 4C 15.55 fields were observed with ACIS-I on Chandra on January 4, 2002 UT for 63 ksec, and on April 13–14, 2002 UT for 52 ksec, respectively. ACIS-I consists of four CCDs with a total field of view of , covering an energy range from 0.3 to 10 keV. At full resolution, the plate scale is 05 per pixel. The images were obtained in the VFAINT mode, which potentially offers better rejection of spurious events and therefore provides a lower background, at the possible expense of exacerbating pileup problems near bright sources. We analyzed both the pipeline-reduced images, which used the standard algorithm for grading events, and images we reprocessed using the VFAINT algorithm.
Using the Chandra Interactive Analysis of Observations (CIAO) software333http://cxc.harvard.edu/ciao/, we produced exposure maps for each observation which we then used to flat-field the images and convert to flux units. In order to simplify the calculation of the exposure map, we assumed a monoenergetic distribution of source photons for both observations. Ideally one would prefer to define a set of spectral weights for the image in order to more accurately determine the exposure map, which is a complicated function of energy. However, given that each of the sources are strongly peaked at energies of –1.3 keV, and that exposure maps produced at slightly higher and lower energies produced negligible difference in the final fluxed images, we are confident that the error introduced by using the monoenergetic approximation is small.
For each observation, source and background regions were chosen from the final fluxed image and then applied to the raw counts image. Several background regions were chosen for statistical robustness, and the dispersion in the background regions was found to be approximately 17% for TXS 0145+386 and 14% for 4C 15.55; these percentages are similar to the calculated Poisson errors. From the counts image, we calculated the Poisson upper and lower confidence limits for the background and source regions using the values given by Gehrels (1986) and Ebeling (2003).
We computed model PSFs for each source using the Chanda Ray Tracer (ChaRT) tool, which contains detailed information about the High Resolution Mirror Assembly (HRMA) on Chandra, and allows for highly accurate determinations of the PSF over a range of energies and off-axis positions. Using CIAO’s modeling and fitting program, Sherpa, we were able to model the spectrum of each source with a 1-D power law combined with photoelectric absorption. This spectrum was passed to ChaRT in order to determine the ray traces, which were then projected onto the ACIS-I detector plane, and converted to a FITS image using MARX. Both TXS 0145+386 and 4C 15.55 are bright sources and suffered from photon pileup; however, MARX allowed us to simulate the PSF both with and without pileup. We find that while pileup affects the innermost pixels in the PSF, the outer wings of the PSF (″) are essentially unaffected, even with the VFAINT processing, so that an accurate subtraction of the contribution from the PSF can still be obtained in the region relevant to our search for cluster emission.
3 Results
3.1 The TXS 0145+386 Field
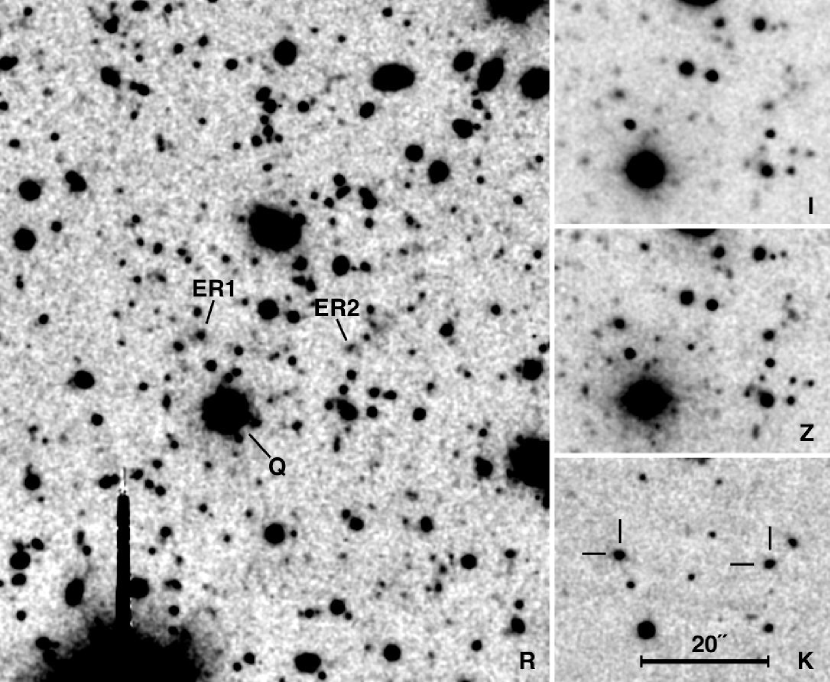
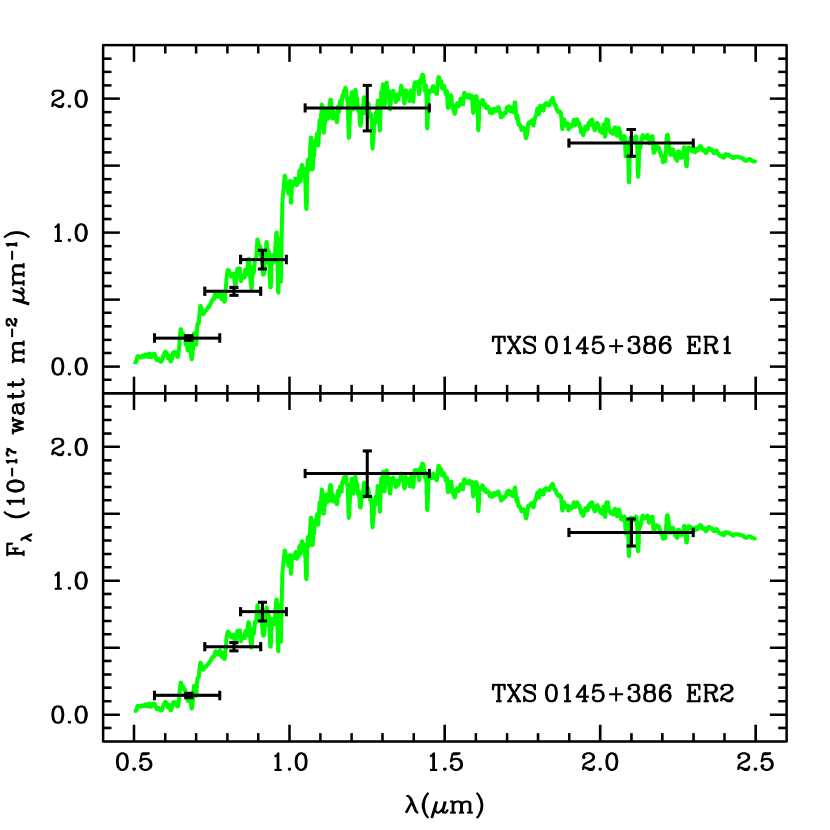
Images in several bandpasses of the TXS 0145+386 field are shown in Fig. 2. Two galaxies that meet our selection criteria are found in this field; these are labelled “ER1” and “ER2” in the figure. The spectral-energy distributions (SEDs) for these galaxies are shown in Fig. 3, along with a reference spectrum for a 3-Gyr-old solar-metallicity instantaneous-burst model (Bruzual & Charlot, 2003).
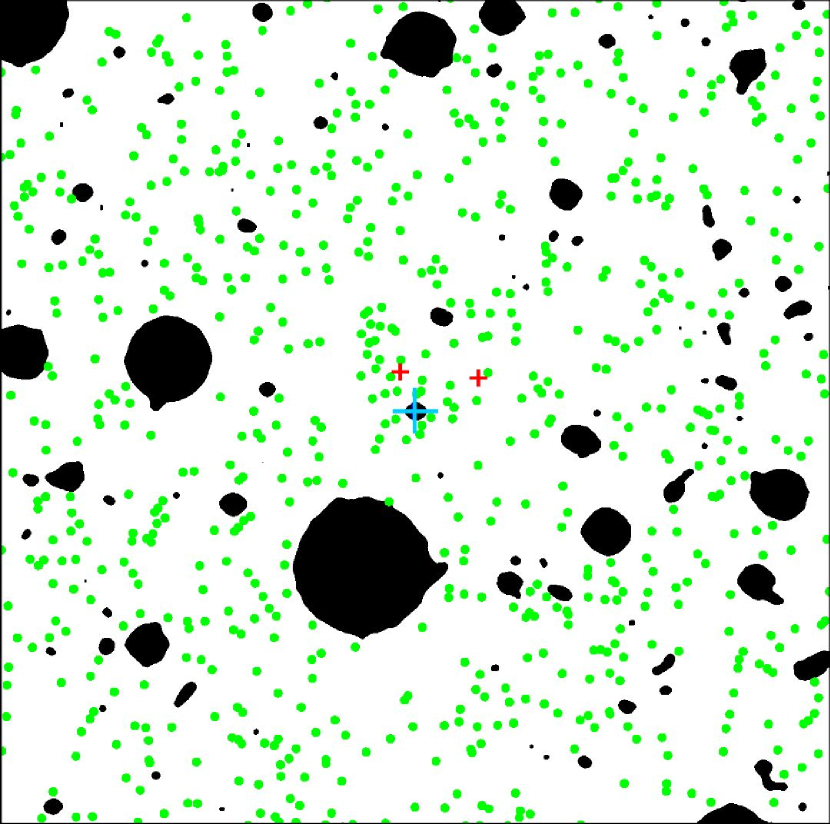
There appears to be an excess of faint objects in Fig. 2 surrounding the quasar and ER1. This impression is confirmed by Fig. 4, which shows a 43-square region centered on TXS 0145+386, with positions of all galaxies in a magnitude interval indicated.
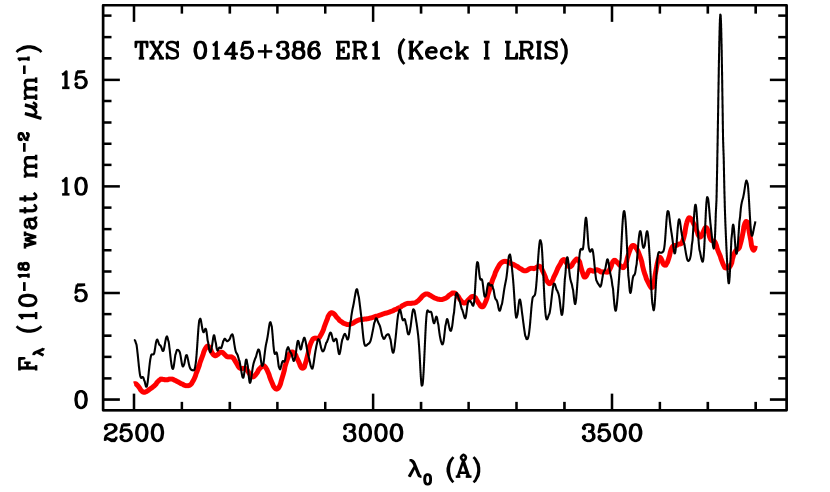
We have attempted to obtain spectroscopy of TXS 0145+386 ER1. Figure 5 shows that the spectrum is generally consistent with that expected for an old stellar population at the approximate redshift of the quasar. However, since the S/N ratio for this spectrum is not very high and because there are no strong absorption features in the available spectral range, it is also probably consistent with the average “dusty star-forming” spectrum of Cimatti et al. (2002, see their Fig. 2). The presence of significant star formation would seem, at least at first sight, to be corroborated by the presence of [O II] emission. However, spectra obtained at higher resolution with ESI on Keck II show that the emission has an intrinsic velocity width of km s-1, considerably higher than would be expected simply from ordered rotation or other gravitationally induced motions of star-forming regions in even the most massive galaxies. Such velocities could indicate the presence of wind, driven either by a hidden starburst or by a hidden AGN. On the other hand, as we describe in more detail below, there is no evidence for a point X-ray source that would indicate the presence of an AGN at this location in our deep Chandra ACIS images. The absence of obvious Mg II or [Ne V] emission also favors stellar excitation over an AGN origin. If the emission is due to recent star formation, the [O II] luminosity indicates a current star-formation rate (uncorrected for internal extinction) of yr-1, using the conversion given for high-redshift galaxies by Kewley, Geller, & Jansen (2004, eq. 19). This rate is very similar to the rate found by Cimatti et al. (2002) for their sample of dusty star-forming EROs.
In sum, the [O II] emission seems most reasonably interpreted as indicating a moderate degree of star formation (depending, of course, on the amount by which the [O II] emission is affected by internal extinction); the large velocity width remains a puzzle. However, the SED (Fig. 3), with its strong break at redshifted 4000 Å, clearly matches that of an old stellar population. We know of no way to reproduce a similar SED with any reasonable reddening of a stellar population whose rest-frame UV-optical luminosity is dominated by young stars. It seems safe to conclude that the observed-frame -band morphology of TXS 0145+386 ER1 is overwhelmingly dominated by light from old stars.
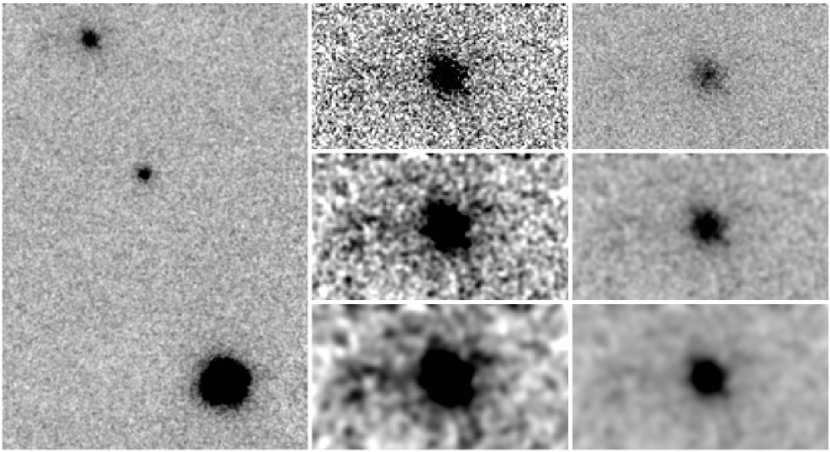
There is a mag 12 star about 1′ south of TXS 0145+386 ER1. Although this offset is rather larger than one would like, we were able to obtain AO imaging with PUEO on CFHT on a night during which the angular coherence was exceptionally good, as indicated by the round PSFs of the quasar and the nearly stellar galaxy between the quasar and ER1. The AO image is shown in Fig. 6. TXS 0145+386 ER1 itself shows an elliptical image with a high degree of symmetry, surrounded by some irregular structure at very low surface brightness.
Determining the radial surface-brightness profile for TXS 0145+386 ER1 from the AO image is complicated by the fact that there is an unresolved core present, which is offset from the centroid of the underlying galaxy by ( kpc). Because both the relative centroids and the amplitudes of the core and galaxy components vary slightly in different models, we have carried out independent modeling of the galaxy in terms of -law, exponential, and Sérsic profiles, using galfit (Peng et al., 2002). In each case, we included a PSF component as well to represent the star-like core, and we allowed the centers of the galaxy and PSF components to float freely. Figure 7 shows fits of PSF-convolved radial-surface-brightness plots for each of the models to the measured profile, after removal of the compact nucleus.
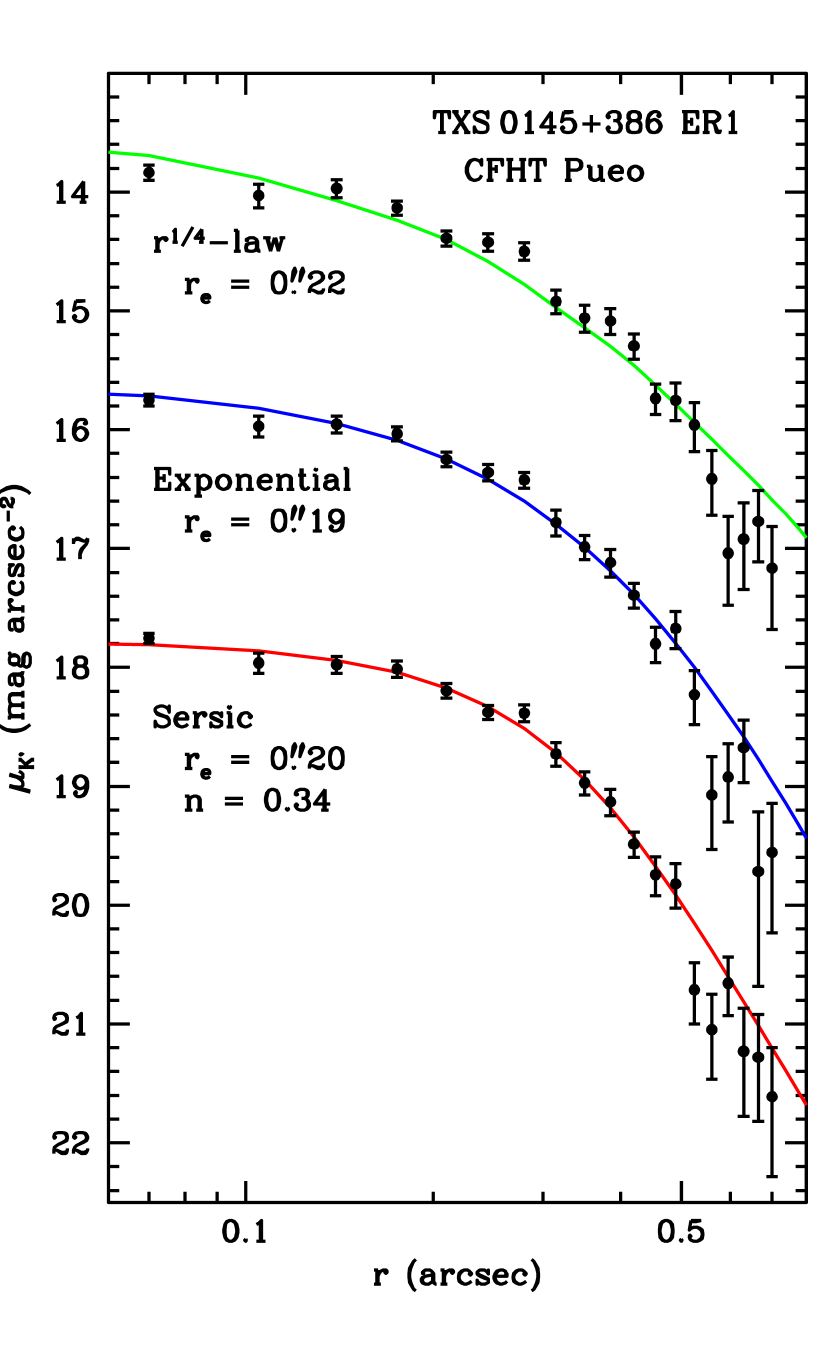
The best-fit Sérsic model has a quite low index of 0.34. Even so, the points at large radius still tend systematically to fall below the curve. The exponential model is nearly as good a fit, and the -law model is clearly worse, being too high at small and large radii and too low at intermediate radii. For the Sérsic model, the compact core comprises about 30% of the total light in the band.
We do not have AO imaging of TXS 0145+386 ER2; nevertheless, our best images show a somewhat asymmetric structure suggesting that this galaxy may be an ongoing or recent merger. If so, the fact that the SED is clearly that of an old stellar population with no hint of recent star formation indicates that the participating galaxies are likely to have been largely free of cold gas.
For the X-ray statistics, we chose to use an inner radius of 10″ and an outer radius of 30″ for our annulus around TXS 0145+386. The outer limit was chosen at this scale because of a nearby X-ray source that would have confused the statistics had we used a larger radius. This outer radius corresponds to a physical scale of 253 kpc at . After subtracting background counts and the modeled wings of the PSF in the annulus, we are left with an insignificant 3 (+12, 9) excess counts. In order to estimate what this result means in terms of limits on cluster X-ray emission, we assume a specific reasonable model: a modified King profile (so-called model) with , a core radius of 140 kpc, a metallicity of 0.4 solar, and a temperature keV (cf. Mullis et al. 2005), and centered on the quasar. Taking all of the flux out to 10 core radii, we find that the annulus contains 24.5% of this total, so the extrapolated total residual counts would be 12 (+49, 37). We use WebPIMMS444http://heasarc.gsfc.nasa.gov/Tools/w3pimms.html to calculate the total luminosity corresponding to a upper limit of approximately 150 counts ( counts s-1), assuming a Raymond-Smith model for the SED. This limit comes out to ergs s-1 for a rest-frame energy range from 0.5–8 keV. This limit is not a very strong constraint; for example, the cluster recently found by Mullis et al. (2005) at a similar redshift has erg s-1 over the 0.5–2 keV range, which, given the difference in energy range, is similar to our upper limit.
There is no significant evidence for X-ray emission from either TXS 0145+386 ER1 or TXS 0145+386 ER2. Formally, for ER1, we have counts per second, and, for ER2, counts per second. In contrast, for TXS 0145+386 itself, we have counts per second.
3.2 The 4C 15.55 Field
The field of the quasar 4C 15.55 is shown in Fig. 8. Again, there are two EROs in the field. However, our photometry (Fig. 9) indicates that ER1, though quite red (), does not show the strong break characteristic of an old stellar population (see also Fig. 1); we therefore classify it as a likely dusty star-forming galaxy. On the other hand, ER2 in this field clearly meets our criterion for an old stellar population. The rather large uncertainty shown for the -band photometry of ER1 in Fig. 9 results from having to correct for the effect of the blue object about 2″ south-east of ER1.
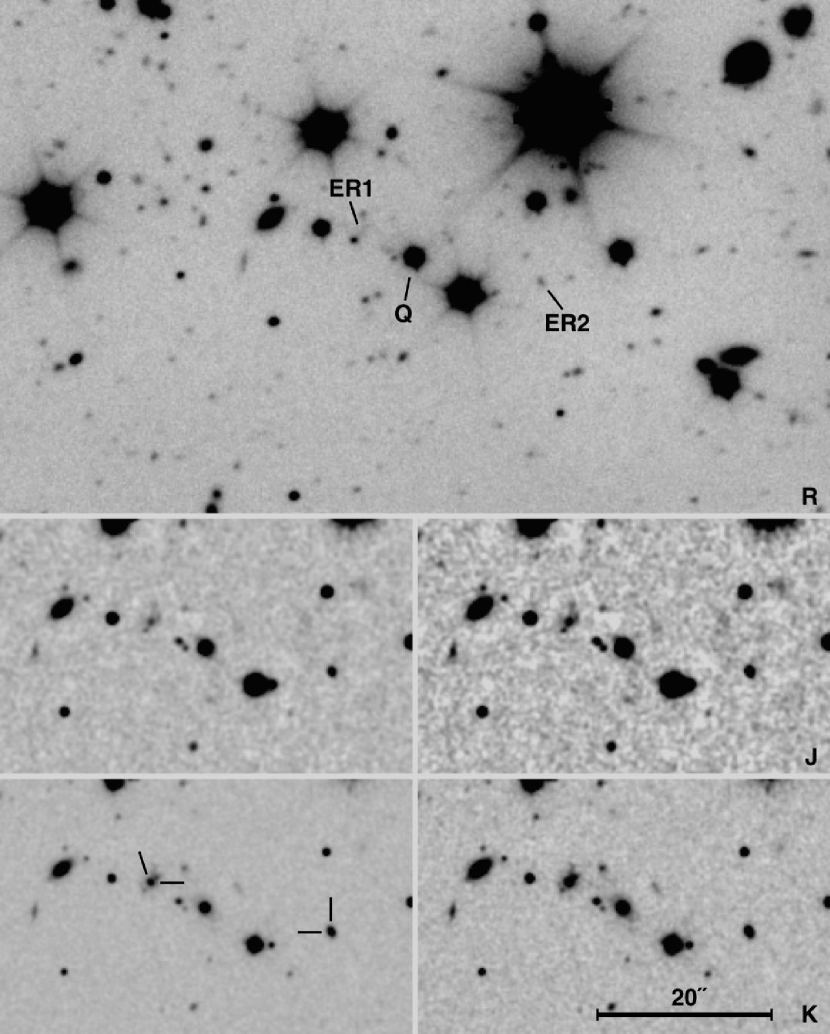
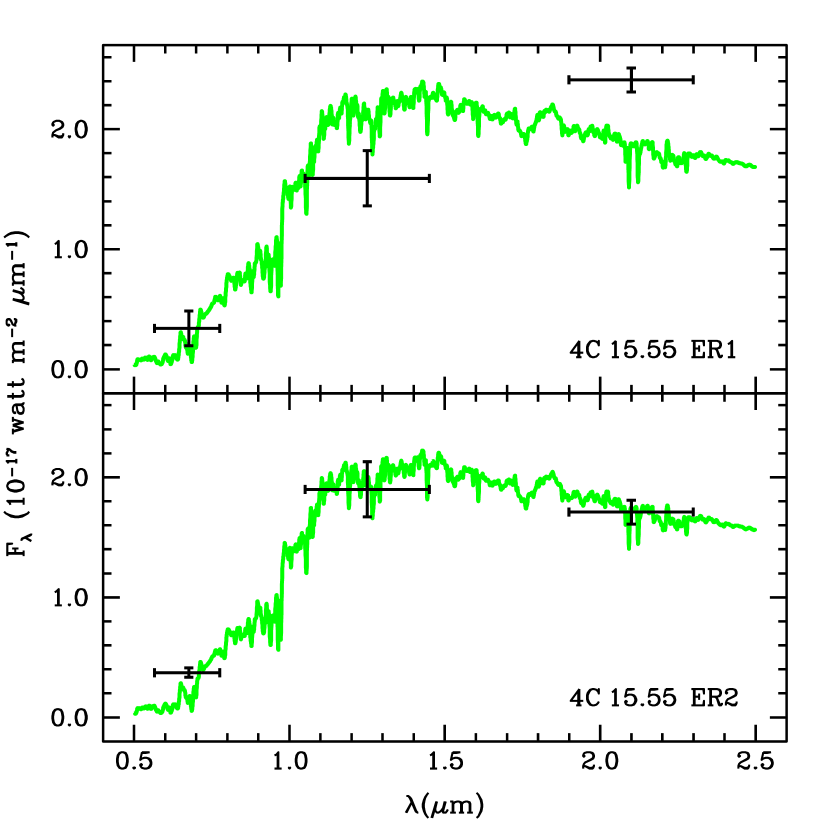
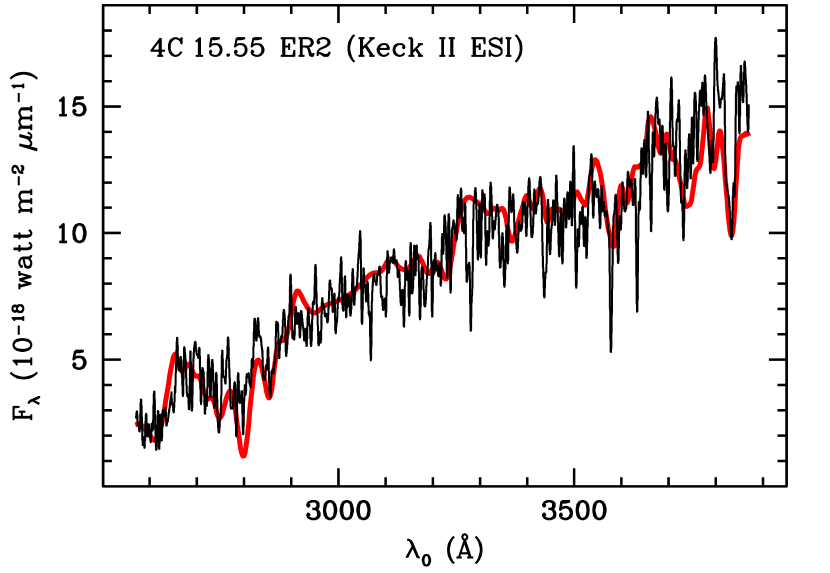
Figure 10 shows our spectrum of 4C 15.55 ER2, obtained with ESI on Keck II. The S/N of this spectrum is sufficiently high that we can see clear matches between absorption features in the spectrum and those in the 3-Gyr Bruzual & Charlot (2003) model. The galaxy has a redshift of 1.412, slightly higher than that of the quasar, which is given as 1.410 by Smith et al. (1978) and as 1.406 by Wills & Lynds (1978).
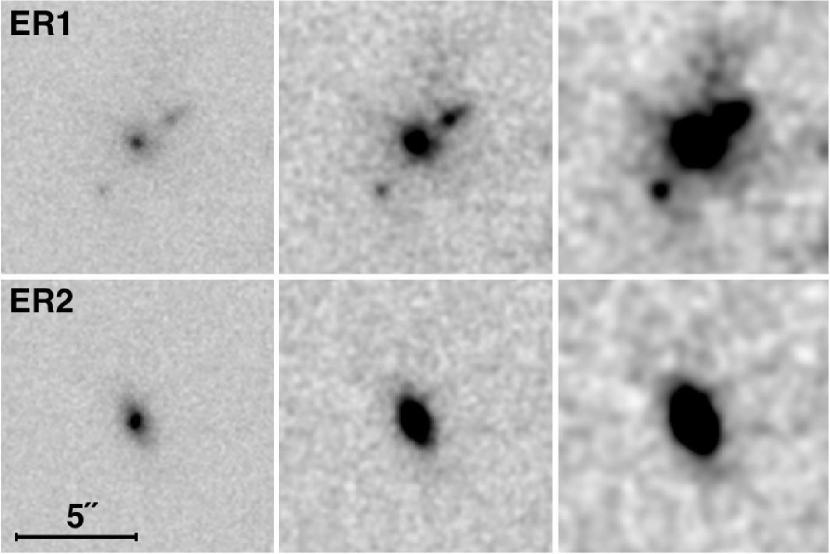
Our AO imaging of the 4C 15.55 field is shown in Fig. 11. In order to have a large enough field to image both EROs in this field, we used the 0058 pixel scale option. ER1, which we had inferred on photometric grounds to be a reddened star-forming galaxy, is clearly an interacting system, while ER2 shows a very regular, symmetric profile.
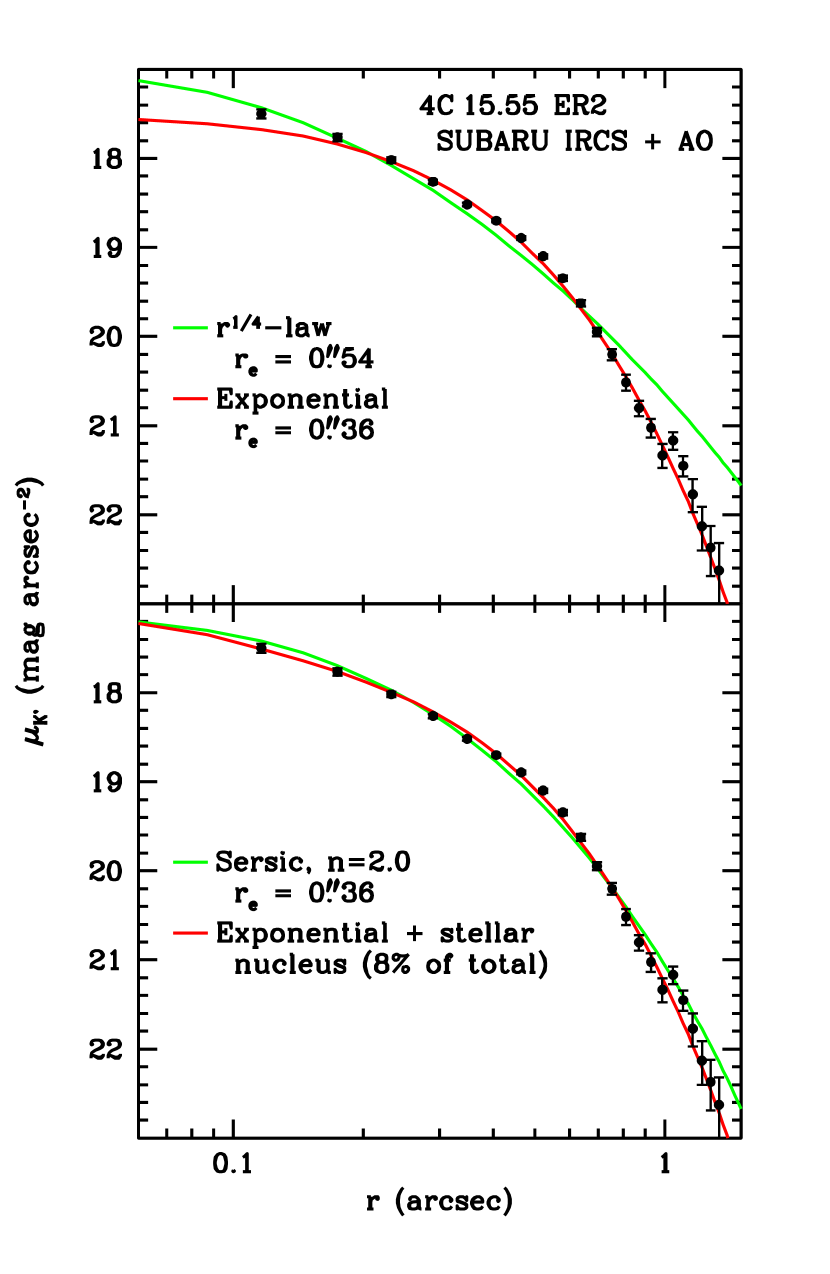
We have carried out two-dimensional, PSF-convolved modeling of the profile of ER2, using galfit and the STSDAS ellipse task. As Fig. 12 shows, a pure -law is a poor fit to the profile. An exponential model provides an excellent fit beyond a semi-major axial radius of about 02 but falls below the observed profile at the center. A Sérsic profile with comes reasonably close to fitting the points at all radii, although it is slightly above at both large and small radii and slightly below in the middle. Our best fit is achieved with a composite profile, comprising a dominant exponential with the addition of a small stellar component to the nucleus (this “stellar nucleus” could be a -law bulge or a nuclear disk with a small effective radius; in any case, the contribution to the total light from this compact central component is small).
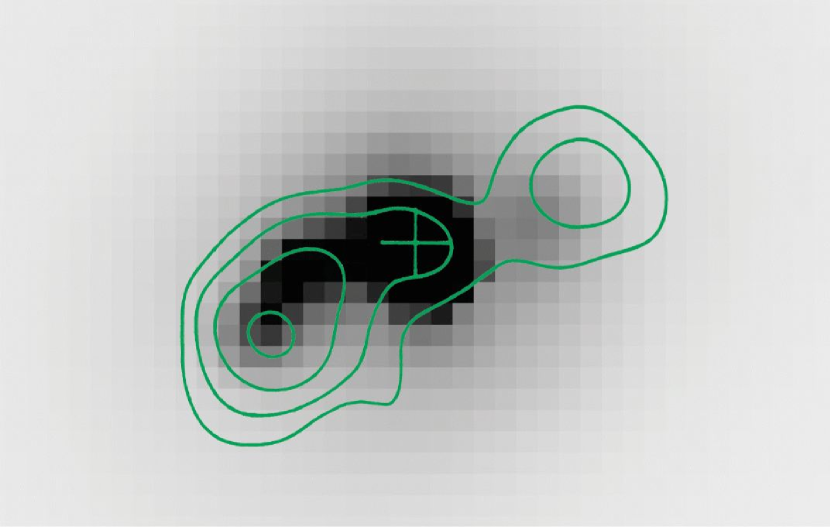
For the Chandra ACIS data for 4C 15.55, the analysis is made difficult by the presence of an X-ray jet associated with the QSO (see Fig. 13). This jet likely contributes to the extended emission around the QSO, but, while the contribution from the central PSF can be modeled, the jet’s full contribution cannot be known precisely. We therefore tried to avoid any region where jet emission would confuse the statistics. We chose a circular aperture of radius 50″ around the QSO (corresponding to 700 kpc at ), excluding an elliptical region with a semi-major axis also of 50″ and a semi-minor axis of 15″ and with a position angle of , corresponding to the observed jet position angle. We measured the flux in background regions using the same aperture and calculated the Poisson errors. After accounting for the contribution from the quasar’s PSF and subtracting the background, we find an excess of counts around the source. We note that the interpretation of this detection remains somewhat ambiguous, given the presence of the jet, but that an overdensity of events is clearly visible around the source in the original Chandra image.
On the assumption that this overdensity can be attributed to an extended cluster component rather than diffuse radiation associated with the X-ray jet, we estimate the X-ray luminosity of the cluster using the same assumptions as we did for obtaining an upper limit for the TXS 0145+386 field. In this case, extrapolating the counts in our aperture to 10 core radii gives a total of . Again using WebPIMMS, with the same parameters as before, we find a total luminosity of ergs s-1. This is again similar to the luminosity found by Mullis et al. (2005) for their non-AGN-related cluster at the slightly lower redshift of 1.39.
As for TXS 0145+386 ER1 and ER2, 4C 15.55 ER2 itself shows no evidence for point-like X-ray emission.
4 Discussion
The clustering amplitude of luminous galaxies comprising old stellar populations at high redshifts (Daddi et al., 2000; McCarthy et al., 2001; Brown et al., 2005) is similar to that of early-type galaxies at the present epoch. It is also comparable to that of powerful radio sources at similarly high redshifts, so it would not be surprising if these two classes were to have a considerable overlap in their spatial distribution. Hall et al. (2001) and Wold et al. (2003) have found an excess of EROs in radio-loud quasar fields that tends to corroborate such an overlap. Wold et al. (2003) suggested two possibilities for this excess: (1) a physical clustering of early-type galaxies around the quasars, and (2) massive clusters along the line of sight to the quasars, which bias the quasar catalogs via gravitational amplification. Our spectroscopic confirmation that at least one of the OGs in each of our fields has a redshift agreeing with that of the quasar to within a few hundred km s-1 supports the first interpretation.
Our attempt to detect direct evidence for clusters in the two fields we discuss in this paper has produced ambiguous results. While we clearly seem to find an enhanced surface density of faint galaxies in the field of TXS 0145+386, our Chandra ACIS observation of the same field gives only an upper limit to any diffuse X-ray emission from the cluster. On the other hand, in the field of 4C 15.55, we appear to have a X-ray detection of diffuse emission, but we cannot be absolutely sure that this emission is not associated with the X-ray jet from the quasar, in spite of our effort to excise any such emission. Neither the upper limit in the first case, nor the possible detection in the second, are inconsistent with the presence of a fairly massive cluster surrounding the respective quasars.
Both of the OGs for which we have AO imaging appear to have compact nuclear components. After removal of these nuclear components, both of these galaxies are well fit by exponential profiles (and not by -law profiles); however, the discrimination among profiles is much better for 4C 15.55 ER2 because of the much higher S/N of the Subaru image. For this galaxy, there is no significant doubt that the stellar distribution has close to an exponential profile; even if one were to prefer the Sérsic model (which eliminates the need to add a compact nucleus), it is only slightly different from an exponential beyond a radius of 02 ( kpc), and, to the extent it differs, it is a worse fit to the data. It is true (as the referee has emphasized) that elliptical galaxies in the present-day universe can have a wide range of Sérsic indices, including some as low as 2 (Caon, Capaccioli, & D’Onofrio, 1993; Khosroshahi et al., 2000). However, the same studies that have demonstrated this range have also shown that there is a strong positive correlation between the Sérsic index and both the central surface brightness and the total luminosity of the galaxy. Ellipticals with are, virtually without exception, galaxies with luminosities considerably below and with low central surface brightnesses (see, e.g., Table 2 of Caon, Capaccioli, & D’Onofrio 1993). There are good reasons to believe that they have had different formation histories than have luminous ellipticals (Khosroshahi et al., 2000), possibly involving secular evolution from disks. Such galaxies are in any case quite different from 4C 15.55 ER2, which is luminous () and has a high surface brightness.
Some massive galaxies strongly dominated by old stellar populations at high redshifts clearly show closely -law profiles (Bunker et al., 2003; Cimatti et al., 2004; Fu, Stockton, & Liu, 2005; Daddi et al., 2005); others just as clearly show essentially pure exponential profiles (Stockton, Canalizo, & Maihara, 2004; Fu, Stockton, & Liu, 2005; Daddi et al., 2005). The only reasonably large structures in the present-day universe that show exponential profiles are the disk components of spiral and S0 galaxies and the “pseudo-bulges” (e.g., Kormendy & Kennicutt, 2004) found in late-type spirals. The latter are not very massive, and they are produced over a significant fraction of a Hubble time via secular evolution from disks. For these reasons, they are almost certainly not models for the exponential profiles we see in high-redshift OGs. This means that the exponential profiles in these massive high-redshift systems are due either to disks or to some configuration that is not found among massive galaxies at the present epoch. In at least one case (Stockton, Canalizo, & Maihara, 2004), the galaxy has a small axial ratio and looks very much like a highly inclined disk.
If these really are massive () disks of old stars, then they are significantly smaller than most massive disks at the present epoch. For example, if we take from the study of a complete sample of nearby disks by van der Kruit (1987) those with disk (for our assumed km s-1 Mpc-1), the average exponential scale length is kpc, which corresponds to an effective radius kpc. In comparison, TXS 0145+386 ER1 and 4C 15.55 ER2 have kpc and 3.0 kpc, respectively. Even the larger of these is barely more than half as large as the smallest of the 12 luminous galaxies from the van der Kruit (1987) sample. Daddi et al. (2005) have similarly found that early-type galaxies at high redshifts are significantly smaller than their counterparts in the present-day universe. Eight out of their 9 examples were found to have morphologies consistent with spheroids, and only 1 appeared to be a disk of old stars. But it is perhaps significant that this disk-like galaxy, at , was by a fair margin the highest redshift galaxy in their sample. Daddi et al. (2005) point out that this galaxy is quite similar to the galaxy discussed by Stockton, Canalizo, & Maihara (2004), which is also at a similar redshift.
Such massive disks would carry certain implications for the early formation of massive galaxies:
-
1.
Such a disk must have formed quasi-monolithically and with strong dissipation. It is unlikely to have suffered any major mergers after a substantial fraction of the stars had been formed.
-
2.
Depending on the age of the stellar population in the examples observed so far, quite large and sustained star formation rates are required to form most of the stellar mass in a short time. At a minimum, star formation rates of a few hundred per year sustained for a few years are indicated. Note that similar constraints are indicated by the -element enhancement of the stellar content of massive ellipticals at the present epoch (e.g., Worthey, Faber, & González 1992; Worthey 1998).
-
3.
Since massive pure disks of old stars do not exist (or at least are extremely rare) at the present epoch, such galaxies must have a very high probability of being transformed into ellipticals via major mergers or into bulge-dominated S0s via less extreme encounters. This would not be surprising, given that our objects have been found in radio-source fields, which should be among the highest density regions in the early universe. At high redshifts, most of these regions will not yet have become virialized, so velocity dispersions in sub-clumps may well be conducive to merging activity. The fact that we suspect TXS 0145+386 ER2 to be an ongoing merger gives some observational credence to this line of reasoning. This scenario might also explain why, among the admittedly small number of OGs that so far have published high-resolution morphological data, spheroids seem to be more common at than at .
All of this fits in rather well with what we know or suspect about massive cluster ellipticals at the present epoch. Numerous lines of evidence (e.g., Peebles, 2002; Thomas, Maraston, & Bender, 2002; Thomas et al., 2005) point to early and rapid formation of the great majority of the stars in the most massive and luminous ellipticals, yet some simulations (e.g., Thomas & Kauffmann, 1999; Kauffmann & Haehnelt, 2000) suggest late ( between 1 and 2) assembly of the galaxies themselves. The only way these two conditions can be reconciled is if the assembly is done from galaxies that formed most of their stars at much earlier times and that are largely free of gas. Furthermore, the assembly process must be dominated by (at most) a few large such galaxies in order to preserve the well-known color-luminosity relation for ellipticals. Thus, early forming massive disks in which star formation has been driven to completion or truncated by the expulsion of remaining gas could plausibly act as reservoirs for the stars that eventually end up in present-day elliptical or cD galaxies.
References
- Barr et al. (2003) Barr, J. M., Bremer, M. N., Baker, J. C., & Lehnert, M. D. 2003, MNRAS, 346, 229
- Best (2000) Best, P. N. 2000, MNRAS, 317, 720
- Best et al. (2003) Best, P. N., Lehnert, M. D., Miley, G. K., & Röttgering, H. J. A. 2003, MNRAS, 343, 1
- Brown et al. (2005) Brown, M. J. I., Jannuzi, B. T., Dey, A., & Tiede, G. P. 2005, ApJ, 621, 41
- Bruzual & Charlot (2003) Bruzual, G. & Charlot, S. 2003 MNRAS, 344, 1000
- Bunker et al. (2003) Bunker, A., et al. 2003, in The Mass of Galaxies at Low and High Redshift, (ESO, Garching), p. 262
- Calzetti et al. (2000) Calzetti, D., Armus, L., Bohlin, R. C., Kinney, A. L., Kornneef, J., & Storchi-Bergmann, T. 2000, ApJ, 533, 682
- Caon, Capaccioli, & D’Onofrio (1993) Caon, N., Capaccioli, M., & D’Onofrio, M. 1993, MNRAS, 265, 1013
- Cimatti et al. (2002) Cimatti, A., et al. 2002, A&A, 381, L68
- Cimatti et al. (2003) Cimatti, A., et al. 2003, A&A, 412, L1
- Cimatti et al. (2004) Cimatti, A., et al. 2004, Nature, 430, 184
- Chapman et al. (2000) Chapman, S. C., McCarthy, P., & Persson, S. E. 2000, AJ, 120, 1612
- Chen & Marzke (2004) Chen, H.-W., & Marzke, R. 2004, ApJ, 615, 603
- Croom et al. (2001) Croom, S. M., Shanks, T., Boyle, B. J., Smith, R. J. Miller, L., Loaring, N. S., & Hoyle, F. 2001, MNRAS, 325, 483
- Daddi et al. (2000) Daddi, E., Cimatti, A., Pozzetti, L. Hoekstra, H., Röttgering, H. J. A., Renzini, A., Zamorani, G., & Mannucci, F. 2000, A&A, 361, 535.
- Daddi et al. (2004) Daddi, E., Cimatti, A., Renzini, A., Fontana, A., Mignoli, Pozzetti, L., Tozzi. P., & Zamorani, G. 2004, ApJ, 617, 746
- Daddi et al. (2005) Daddi, E., et al. 2005 ApJ, 626, 680
- Dey et al. (1999) Dey, A., Graham, J. R., Ivison, R. J., Smail, I. Wright, G. S., & Liu, M. C. 1999, ApJ, 519, 610
- Dunlop et al. (1996) Dunlop, J., Peacock, J., Spinrad, H., Dey, A., Jimenez, R., Stern, D., & Windhorst, R. 1996, Nature, 381, 581
- Ebeling (2003) Ebeling, H. 2003, MNRAS, 340, 1269
- Ferrara et al. (1999) Ferrara, A., Bianchi, S., Cimatti, A., & Giovanardi, C. 1999, ApJS, 123, 437
- Fu, Stockton, & Liu (2005) Fu, H., Stockton, A., & Liu, M. 2005, ApJ, 632, 831
- Gehrels (1986) Gehrels, N. 1986, ApJ, 303, 336
- Gilbank et al. (2003) Gilbank, D. G., Smail, I., Ivison, R. J., & Packham, C. 2003, MNRAS, 346, 1125
- Hall et al. (2001) Hall, P., et al. 2001, AJ, 121, 1840
- Hintzen, Ulvestad, & Owen (1983) Hintzen, P., Ulvestad, J., & Owen, F. 1983, AJ, 88, 709
- Iye et al. (2003) Iye, M. et al. 2003, ApJ, 590, 770
- Kauffmann & Haehnelt (2000) Kauffmann, G., & Haehnelt, M. 2000, MNRAS, 311, 576
- Kewley, Geller, & Jansen (2004) Kewley, L. J., Geller, M. J., & Jansen, R. A. 2004, AJ, 127, 2002
- Khosroshahi et al. (2000) Khosroshahi, H. G., Wadadekar, Y., Kembhavi, A., & Mobasher, B. 2000, ApJ, L103
- Kinney et al. (1996) Kinney, A. L., Calzetti, D., Bohlin, R. C., McQuade, K., Storchi-Bergmann, T., & Schmitt, H. R. 1996, ApJ, 467, 38
- Kobayashi et al. (2000) Kobayashi, N., et al. 2000, in Proc. SPIE 4008: Optical and IR Telescope Instrumentation and Detectors, ed. M. Iye & A. F. Moorwood, p. 1056
- Kormendy & Kennicutt (2004) Kormendy, J., & Kennicutt, R. C., Jr. 2004, ARA&A, 42, 603
- Liu et al. (2000) Liu, M. C., Dey, A., Graham, J. R., Bundy, K. A., Steidel, C. C., Adelberger, K., & Dickinson, M. E. 2000, AJ, 119, 2556
- McCarthy et al. (2001) McCarthy, P. J., et al. 2001, ApJ, 560, L131
- Moriando, Cimatti, & Daddi (2000) Moriando, G., Cimatti, A., & Daddi, E. 2000, A&A, 364, 26
- Mullis et al. (2005) Mullis, C. R., Rosati, P., Lamer, G, Böhringer, H., Schwope, A., Schuecker, P., & Fassbender, R. 2005, ApJ, 623, L85
- Oke et al. (1995) Oke, J. B., et al. 1995, PASP, 107, 375
- Peebles (2002) Peebles, P. J. E. 2002, ASP Conf. Ser., 283, 351
- Peng et al. (2002) Peng, C. Y., Ho, L. C., Impey, C. D., & Rix, H.-W. 2002, AJ, 124, 266
- Pozzetti & Mannucci (2000) Pozzetti, L., & Mannucci, F. 2000, MNRAS, 317, L17
- Röttgering et al. (2004) Röttgering, H., De Breuck, C., Daddi, E., Kurk, J., Miley, G., Pentericci, L., Overzier, R., & Venemans, B. 2004,
- Saracco et al. (2004) Saracco, P., Longhetti, M., Giallongo, E., Arnouts, S., Cristiani, S., D’Odorico, S., Fontana, A., Nonino, M., & Vanzella, E. 2004, A&A, 420, 125
- Sawicki et al. (2005) Sawicki, M., Stevenson, M., Barrientos, L. F., Gladman, B., Mallén-Ornelas, G., & van den Bergh, S. 2005, ApJ, 627, 621
- Smith et al. (2002) Smith, G. P., Smail, I., Kneib, J.-P., Davis, C. J., Takamiya, M., Ebeling, H., & Czoske, O. 2002b, MNRAS, 333, L16
- Smith et al. (1978) Smith, H. E., Burbidge, E. M., Baldwin, J. A., Tohline, J. E., Wampler, E. J., Hazard, C., & Murdoch, H. S. 1978, ApJ, 215, 427
- Soifer et al. (1999) Soifer, B. T., Matthews, K., Neugebauer, G., Armus, L., Cohen, J. G., Persson, S. E., & Smail, I. 1999, AJ, 118, 2065
- Spinrad et al. (1997) Spinrad, H., Dey, A., Stern, D., Dunlop, J, Peacock, J., Jimenez, R., & Windhorst, R. 1997, ApJ, 484, 581
- Stiavelli & Treu (2001) Stiavelli, M., & Treu, T. 2001, in Galaxy Disks and Disk Galaxies, ASP Conf. Ser., 230, ed. Funes & Corsini, (ASP, San Francisco), p. 603
- Stockton (2001) Stockton, A. 2001, in Astrophysical Ages and Timescales, ASP Conf. Ser., 245, ed. von Hippel et al., (ASP, San Francisco), p. 517
- Stockton, Canalizo, & Maihara (2004) Stockton, A., Canalizo, G., & Maihara, T. 2004, ApJ, 605, 37
- Stockton, Kellogg, & Ridgway (1995) Stockton, A., Kellogg, M., & Ridgway, S.E. 1995, ApJ, 443, L69
- Thomas & Kauffmann (1999) Thomas, D., & Kauffmann, G. 1999, in Spectrophotometric Dating of Stars and Galaxies, ASP Conf. Ser., 192, ed. I. Hubeny, S. R. Heap, & R. H. Cornett, p. 261.
- Thomas, Maraston, & Bender (2002) Thomas, D., Maraston, C., & Bender, R. 2002, in Reviews in Modern Astronomy, ed. R. E. Schielicke, v. 15, p. 219 [astro-ph/0202166]
- Thomas et al. (2005) Thomas, D., Maraston, C., Bender, R., & de Oliveira, C. M. 2005, ApJ, 621, 673
- van der Kruit (1987) van der Kruit, P. C. 1987, A&A, 173, 59
- van Dokkum & Ellis (2003) van Dokkum, P. G., & Ellis, R. S. 2003, ApJ, 592, L53
- Wills & Lynds (1978) Wills, D., & Lynds, C. R. 1978, ApJS, 36, 317
- Wold et al. (2003) Wold, M., Armus, L., Neugebauer, G., Jarrett, T. H., & Lehnert, M. D. 2003, AJ, 126, 1776
- Worthey (1998) Worthey, G. 1998, PASP, 110, 888
- Worthey, Faber, & González (1992) Worthey, G., Faber, S. M., & González, J. J. 1992, ApJ, 398, 69
- Yan et al. (2004b) Yan, L. et al. 2004b, ApJS, 154, 75
- Yan, Thompson, & Soifer (2004) Yan, L., Thompson, D., & Soifer, B. T. 2004, AJ, 127, 1274