Characteristics of geomagnetic cascading of ultra-high energy photons at the southern and northern sites of the Pierre Auger Observatory
Abstract
Cosmic-ray photons above 1019 eV can convert in the geomagnetic field and initiate a preshower, i.e. a particle cascade before entering the atmosphere. We compare the preshower characteristics at the southern and northern sites of the Pierre Auger Observatory. In addition to a shift of the preshower patterns on the sky due to the different pointing of the local magnetic field vectors, the fact that the northern Auger site is closer to the geomagnetic pole results in a different energy dependence of the preshower effect: photon conversion can start at smaller energies, but large conversion probabilities () are reached for the whole sky at higher energies compared to the southern Auger site. We show how the complementary preshower features at the two sites can be used to search for ultra-high energy photons among cosmic rays. In particular, the different preshower characteristics at the northern Auger site may provide an elegant and unambiguous confirmation if a photon signal is detected at the southern site.
1 Introduction
Substantial fluxes of cosmic-ray photons at ultra-high energy (UHE), above 1019 eV, are predicted by non-acceleration (top-down) models of cosmic-ray origin (for example, see [1]). At a smaller level, UHE photons are also expected to be produced in acceleration (bottom-up) models [2]. UHE photons can be detected through the particle cascades they initiate in the atmosphere. So far, upper limits on the photon flux were set [3, 4, 5, 6, 7]. The large exposure expected to be collected during the next years, in particular by the Pierre Auger Observatory [8], will enormously increase the sensitivity for detecting UHE photons [7].
Contrary to the case of hadron primaries, UHE photons around 1020 eV can interact with the magnetic field of the Earth before entering the atmosphere [9]. This process is commonly called geomagnetic cascading or preshower and leads to a dramatic change of the air shower development for primary photons [9, 10, 11, 12, 13, 14].
The probability of magnetic pair production (“photon conversion”) and, in case of conversion, the synchrotron emission by the produced electrons depend on the particle energy and on the transverse component of the local magnetic field [15, 14]. Photon conversion can occur at altitudes up to several thousand kilometers above the ground, i.e. well above the atmosphere (100 km altitude). A preshower consists mostly of the secondary photons emitted by the electrons. A secondary photon of sufficiently high energy may additionally convert in the magnetic field and produce another electron pair. The number of preshower particles depends on the specific conditions and can fluctuate strongly; it can range from a few particles to a few thousand. Nevertheless, as we demonstrate in this paper, the preshower formation can be fairly well inferred from characteristics of the observed extensive air shower. The spread of the preshower particles in transverse distance from the shower axis and in arrival time at the atmosphere is well below the resolution of current shower experiments [14]. Hence, also in case of geomagnetic cascading, the subsequent air shower would be observed as one event by the experiments.
Since the probability of photon conversion and the synchrotron emission spectrum depend on the local transverse magnetic field, characteristics of the preshower process (such as conversion probability, or the energy spectrum of the preshower particles) depend strongly on the specific trajectory through the magnetosphere. For a given experimental site, this leads to a large directional dependence of preshower characteristics within the local coordinate system of zenith and azimuth . In addition, as already noted in the work of McBreen and Lambert 25 years ago [9], a dependence is expected on the location of the experiment: experimental sites at different geomagnetic latitudes have different local magnetic field conditions, which can affect preshower characteristics for UHE photons.
The comparison of preshower characteristics of UHE photons expected at two sites located at different hemispheres of the Earth is of particular current interest due to the construction of the Pierre Auger Observatory. The southern part of the Observatory (“Auger South”) is situated near Malargue (Argentina) at 69.2∘ W, 35.2∘ S. The construction of Auger South is approaching completion and first results were obtained, including an upper limit to UHE photons [7]. To achieve full sky coverage, the northern site (“Auger North”) is planned in Colorado (USA) at 102.7∘ W, 37.7∘ N. At Auger South, the magnetic field of 24.6 points upward to . At Auger North, the magnetic field of 52.5 points downward from .111Azimuth is defined in this work counterclockwise from geographic East. For instance, means East, North etc.
Previous works in the literature focused rather on the directional dependence of preshower characteristics of UHE photons for one given site than comparing the conditions at different sites. Examples of magnetic field strengths at various sites were given in [11]. In that work, the observable of shower size (total number of electrons at ground) was studied. It was noted that azimuth regions of smaller (or stronger) preshower effect can be identified that may differ between the sites. In [12], the altitude dependence of the transverse component of the magnetic field was compared for the two Auger sites for a few directions, and preshower particle spectra were studied. E.g. in [13], it was pointed out that at Auger North, due to the larger magnetic field, the preshower effect starts at a lower energy. A particular focus of that work was the study of observables for the ground array, where differences in the detector signals for converted and unconverted primary photons were found.
In this work, making use of our PRESHOWER code [14] linked to CONEX, a fast shower simulation program [16], we perform a dedicated comparison of the preshower characteristics of UHE photons for the conditions of the Auger North and Auger South sites. The geomagnetic field in PRESHOWER is described by the IGRF model [17, 18]. We find that the transition range in energy from small to large conversion probabilities is larger at Auger North, starting at smaller but ending at higher energy. We study how the differences of the preshower characteristics between the two sites can be used to perform a complementary search for UHE photons. In particular, the situation may arise where a possible UHE photon signal detected at Auger South requires an independent cross-check. As will be shown, such a cross-check could come from Auger North. In fact, making use of the UHE preshower effect by observing from a different experimental site seems the most elegant and natural way for cross-checking an UHE photon signal claim.
While the study is performed for the specific case of the two Auger sites, the general findings hold for any two sites with sufficiently different local magnetic field conditions. The results shown for Auger North hold, to a good extend, also for the HiRes [19] and Telescope Array [20] sites, both of them being located in Utah.
The plan of the paper is as follows. In Section 2, preshower features are discussed, and in Section 3, the corresponding air shower features are studied. In Section 4, UHE photon scenarios and their observation at the two different sites are investigated. In particular, it is worked out how observations at the two sites can complement each other. Conclusions are given in Section 5. In Appendix A it is shown how the transverse component of the geomagnetic field in the IGRF model varies along different particle trajectories. In Appendix B we show a collection of conversion probability sky maps supplementing Section 2.1.
2 Comparison of preshower features at Auger South and North
2.1 Conversion probability
A key parameter to characterize the fate of an UHE photon in the Earth’s magnetic field is the conversion probability . Given the local differential probability of a photon to convert into an electron pair, results from an integration along the particle trajectory. Small values of indicate a large probability of the UHE photon to enter the atmosphere without conversion and to keep its original identity. In turn, UHE photons would almost surely undergo geomagnetic cascading for values of close to unity.
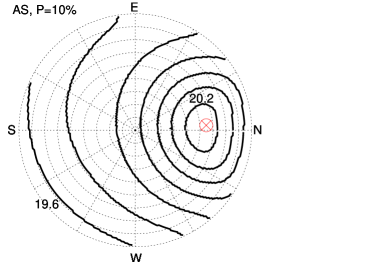
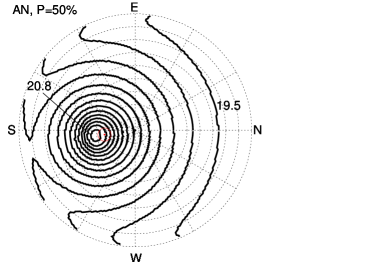
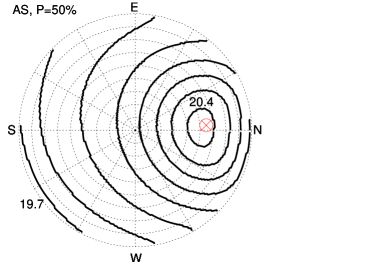
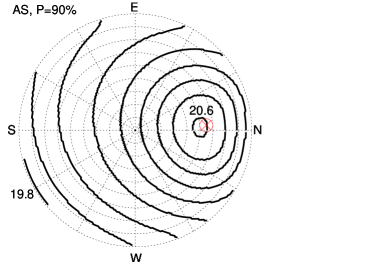
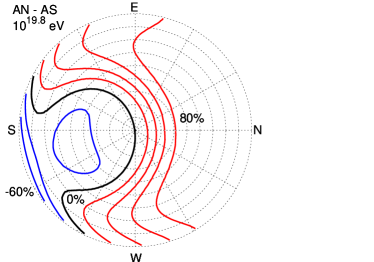
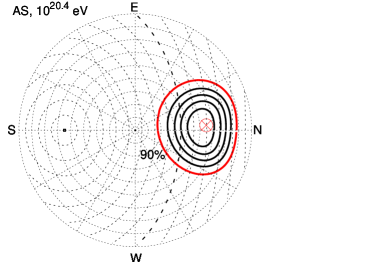
depends on the experimental site, the photon energy, and the direction of the particle trajectory in the local coordinate system of zenith and azimuth , site,). Thus, for a chosen site and a fixed primary photon energy, sky maps within the local coordinate system ) can be produced to study the pattern of UHE photon conversion.
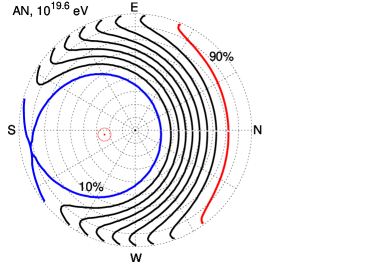

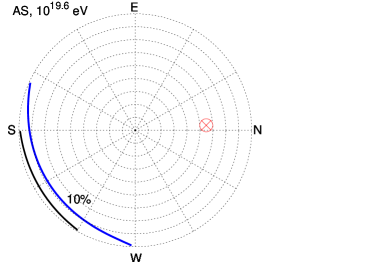


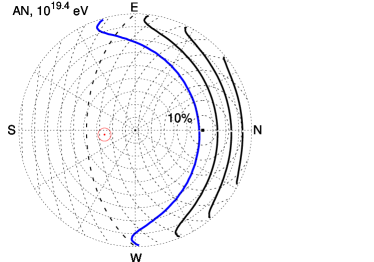
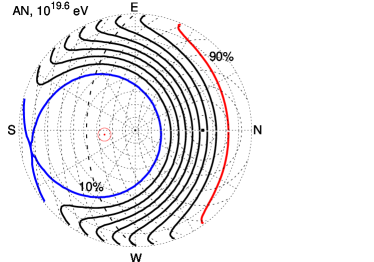
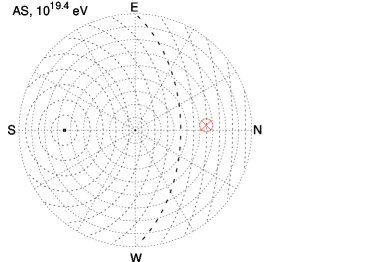
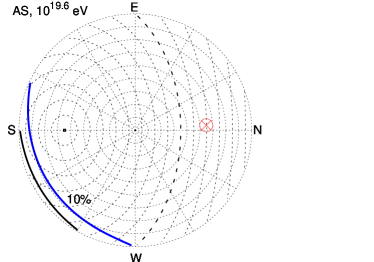
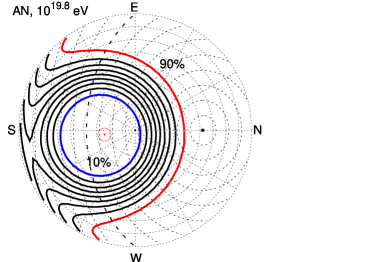
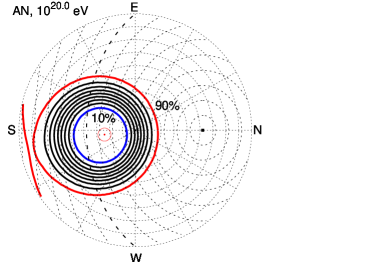
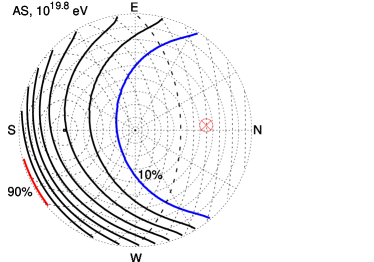
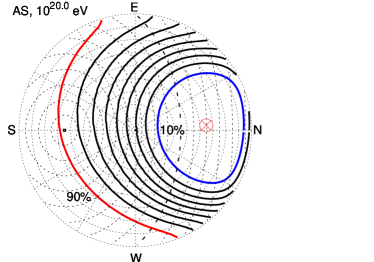
As an example, in Figure 1 sky maps are shown for two different energies eV)=19.6 and 20.0, corresponding to 40 EeV and 100 EeV, both for Auger North and South (sky maps at various energies between eV)=19.4 and 20.4 are collected in Appendix B). One can see that at 40 EeV, photon conversion is already important at Auger North for a large part of the sky. In contrast to this, at Auger South conversion is very unlikely for 40 EeV photons independent of their arrival direction.
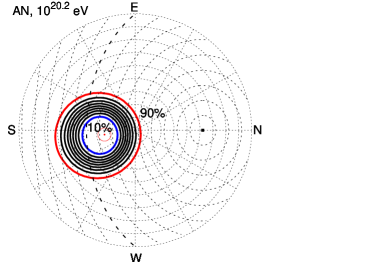
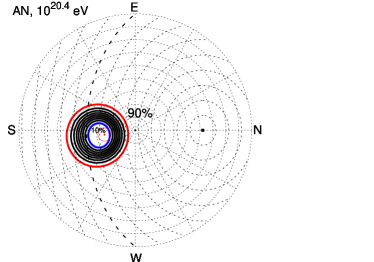
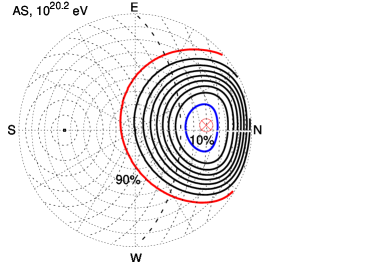
The energy above which photon conversion becomes important, is expected to be smaller at Auger North due to the larger local magnetic field strength. To quantify this, we show in Figure 2 a sky map of photon energies for a fixed conversion probability of . It can be seen that photon conversion starts at a factor 2 higher energy at Auger South compared to Auger North.
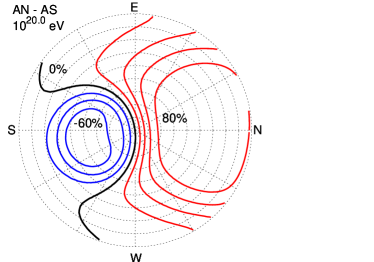
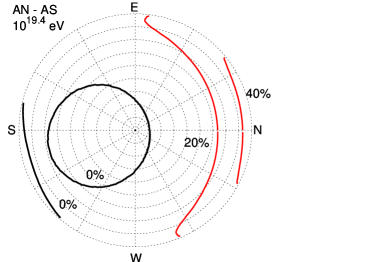
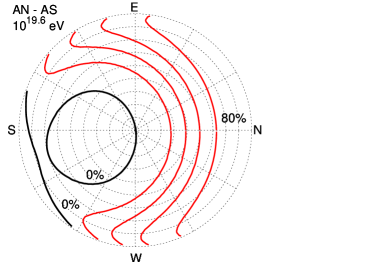
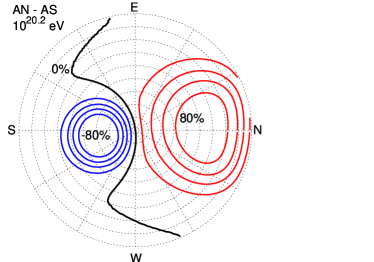
At energies of 100 EeV, also for Auger South photon conversion is important for a sizeable part of the sky (Figure 1, right). As expected, small conversion probabilities are found for sky regions around the pointing direction of the local magnetic field vector. Thus, we expect significant differences in between the two sites for a given direction in terms of local coordinates, with the difference being strongly dependent on the regions of the sky. Also shown in Figure 1 (bottom plots) are therefore sky maps of the difference in between Auger North and South for the two fixed energies. While for the larger part of the sky, is larger at Auger North (due to the stronger field), there is at 100 EeV a significant part of the sky where is larger at Auger South (due to the different pointing of the magnetic field vector).
It is clear from this that cuts on the local shower arrival direction can be introduced to select regions of the sky where is larger (or smaller) at one site compared to the other site. Applying the same cuts to data from the two sites, event sets with enriched (for the one site) and depleted (for the other site) fractions of converted (or unconverted) photons can be prepared. A possible photon signal could then show up with different signatures at the two sites for the same selection cuts. This will be studied in more detail in Section 4.
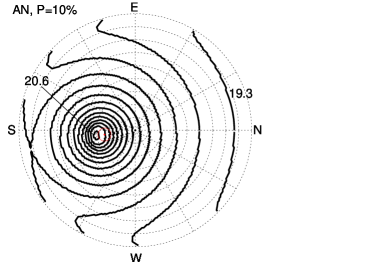

Another feature is showing up in Figure 2 where sky maps of energies are plotted for fixed . The range of energies covered (for the same value of ) is larger at Auger North than at Auger South. For instance, the energy at which is reached changes at Auger North by a factor 15 over the sky, at Auger South only by a factor 4. In other words, the sky pattern for geomagnetic cascading is more “inhomogeneous” at Auger North (larger transition range in energy from small to large conversion probability) than at Auger South.
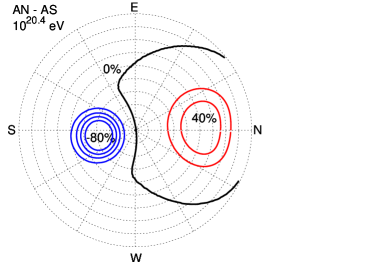
In fact, while the preshower effect starts at smaller energies for a larger part of the sky at Auger North, the transition range to full conversion extends to even higher energies at Auger North, see Figure 2 (bottom), sky map for . As an example, a 250 EeV photon (eV)=20.4) has a conversion probability for all directions at Auger South, while at Auger North a small window with still exists (see Figure 15).
At first glance this seems unexpected. As the magnetic field strength is a factor two larger at Auger North, one would rather expect photon conversion at smaller energies at Auger North. However, this feature is again related to the different locations within the geomagnetic field, with Auger North being considerably closer to the magnetic pole: in this case, the local magnetic field lines are less curved when following them from ground to higher altitudes. Correspondingly, the transverse projection of the magnetic field vector, which determines the local conversion probability, remains small out to considerably larger distances from the Earth compared to the situation at Auger South. Thus, the fact that Auger North is closer to the pole results in a larger transition region for photon conversion, starting at smaller energies compared to Auger South (due to the larger strength of the local magnetic field) and ending at higher energies compared to Auger South (due to the smaller bending of the magnetic field lines with distance).
To summarize, the different positions of the sites in the geomagnetic field translate into a spatial shift of the conversion patterns at the sky according to the pointing of the local magnetic field vector and into modifications of the transition energy range. The modifications of the transition energies are not a simple shift but also the size of the energy range is affected.
2.2 Particle energy spectra in converted showers
Here we check to what extent it is sufficient to consider only the difference in conversion probability when comparing the two sites. For a given energy, two different directions with the same integrated conversion probability correspond to different spatial trajectories through the magnetosphere. One could imagine in one case a relatively small transverse magnetic field extending over a larger distance, while in the other case relatively close to the Earth, a stronger magnetic field contributes. The same integrated conversion probability could be reached, but the spectrum of preshower particles may differ (for instance, the synchrotron emission spectrum gets harder with stronger magnetic field).
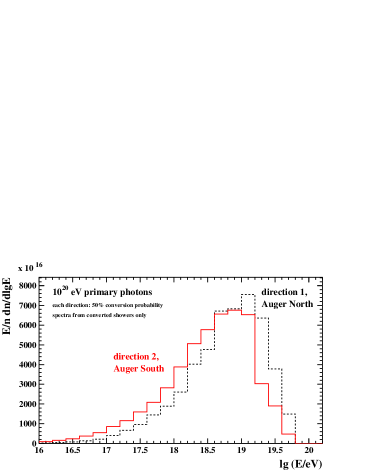
In Figure 3, averaged spectra of preshower particles at the top of the atmosphere are shown, weighted by the particle energy, for different directions at Auger North and South. In both cases, . One can see that both spectra look quite similar; most energy is carried by particles of eV. A shift between the distribution of about a factor 1.6 in energy can be noted, however. Performing air shower simulations for these two directions, a difference in the average depth of shower maximum of the converted events of g cm-2 is obtained. This difference is much below the shift in comparing converted and unconverted photon showers to each other (see next Section). For other directions of same integrated conversion probability, differences are typically smaller than shown here. For our purposes in this work, we conclude that the differences in conversion probabilities are a sufficient measure for the different preshower characteristics when comparing the two sites.
3 Air showers initiated by converted and unconverted photons
In this section, we study the basic features of air showers initiated by converted and unconverted photons, with particular emphasis on the differences between these two classes of events. The reasoning is that the differences between Auger South and North in the sky patterns for photon cascading, studied in the preceeding Section, translate into differences of the air shower features that are well observable.
It is well known that unconverted showers, contrary to converted, have a considerably delayed shower development due to the LPM effect [21]. Additionally, event-by-event fluctuations can be extraordindarily large due to a positive correlation of the suppression of the cross-section with air density (a photon traversing a certain depth without an interaction has a larger probability for traversing an additional due to the larger air density).
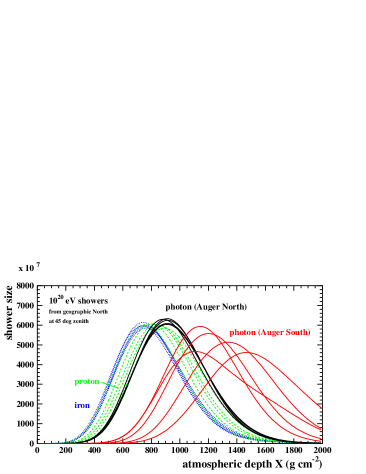
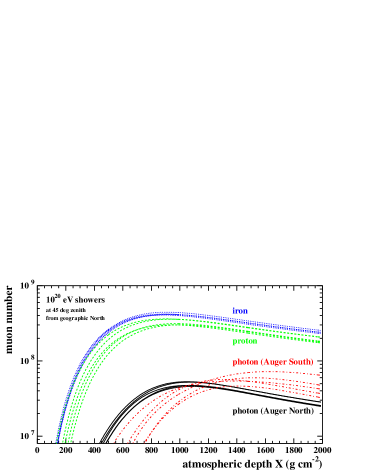
In Figure 4, examples of shower profiles are shown for eV primaries. Simulations are carried out with CONEX, which reproduces well CORSIKA [22] results. The extrapolation of the photonuclear cross section is based on the fit by the Particle Data Group [23]. All primaries arrive from the same local direction, in this case from geographic North at 45∘ zenith. The photon conversion probability is large at Auger North (%) and small at Auger South (0.4%). Consequently, most of the photons at Auger North convert and have a depth of shower maximum 200300 g cm-2 smaller than the (mostly unconverted) photon showers at Auger South. As expected, also fluctuations are much smaller at Auger North in this example. The corresponding distribution of depth of shower maximum from simulating 1000 events for the conditions in Figure 4 is shown in Figure 5 (upper panel). For the same local direction, the expected features of photon showers are very different at the two sites.
For comparison, also profiles for hadron primaries are added using the QGSJET 01 model [24]. Converted photons are more similar to protons, but still reaching at larger depths. More relevant for the present study are, however, the differences between converted and unconverted photons.
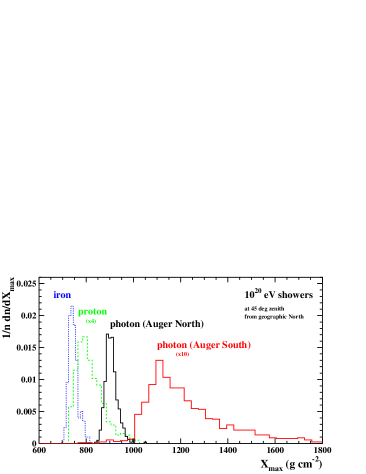
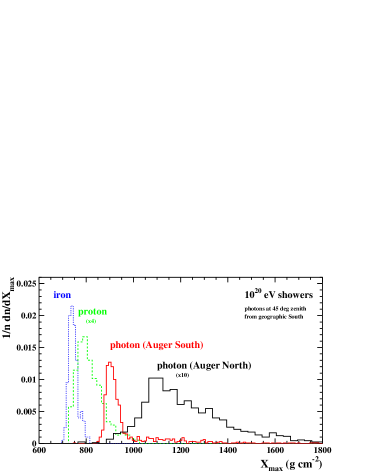
According to the results of the preceding Section, we expect the opposite behavior (larger at Auger North) for certain other directions. Results of simulations with the same conditions as in Figure 4 and in the upper panel of Figure 5, but with the azimuth changed by 180∘, are presented in the lower panel of Figure 5. The angle between this direction and the local magnetic field vector at Auger North is relatively small. As expected, the distribution of photons at Auger South is now peaked at smaller values, while the distribution at Auger North is dominated by the large values from unconverted events.
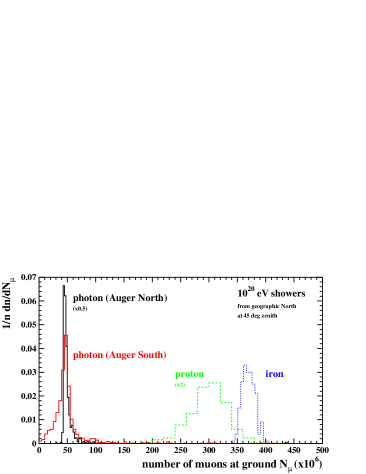
Another important quantity to distinguish photons from hadron primaries is the muon content of the air shower. It is well known that photon showers have less muons compared to hadron-initiated ones; important for the current investigations is whether a significant difference in the muon content exists between converted and unconverted photons. In Figure 6, for the same events shown in Figure 4, the longitudinal profiles of muons are displayed. One can see a shift between the muon profiles for Auger North (all converted here) and Auger South (all unconverted here). This shift is, to a large extent, connected to the shift in (Figure 4).
The distribution of the total number of muons at ground is given in Figure 7. As expected, fluctuations are larger in case of unconverted events, i.e. at Auger South in this example. However, average values are quite similar. Thus, differences between converted and unconverted photon showers in the number of muons are much less spectacular than in . Part of the differences can directly be related to . We conclude that the main difference between converted and unconverted photons, and thus the main difference that could be exploited by observing from two sites, can be characterized by the of the shower.
There are other observables from ground arrays that were shown (or are expected) to differ between converted and unconverted photons, namely the shower size (total number of electrons at ground) [11], the curvature of the shower front and the steepness of the lateral distribution of ground particles [13], or the risetime of the detector signal at a certain distance from the shower core [7]. The differences between these observables for the two classes of photon events are closely connected to the stage of shower development and, correspondingly, to . We therefore expect, firstly, that also data from ground arrays alone, even without a direct observation of such as from fluorescence telescopes, can be exploited to search for complementary photon signatures at the two sites. And secondly, a study of distributions (which provides a measure of the relative shower age at ground) provides us with most relevant information for investigating possible complementary features of both sites.
4 UHE photon scenarios and their observation at Auger South and North
We now give an illustration of how advantage could be taken of the complementarity between the preshower characteristics at Auger North and South. As examples, we consider a diffuse photon signal, a signal from a source region, and the absence of photons (i.e. determining upper limits).
4.1 Diffuse photon signal
In this example, we assume an isotropic primary flux with the all-particle energy power low spectrum with index -2.84. Such a spectrum is consistent with the first estimate from the Auger South Observatory [25]. It should be noted that a deviation from this power law, for instance a suppression of the flux above the energy of the speculated GZK cut-off, would result in a correspondingly modified all-particle flux at highest energies. The existence of such a hypothetic suppression will not affect the conclusions of this section: discussed differences between photon showers observed at Auger North and South depend only on the local geomagnetic field (see below for a quantitative example of applying a simple cut-off to the energy spectrum).
We assume protons and photons as primaries. The input fraction of photons as a function of primary energy follows the results from a topological defect model in [2]. More specifically, the photon fraction is 9%, 15%, 27%, and 48% for energies above eV) = 19.0, 19.3, 19.6, and 20.0, respectively (see also the curve labeled “TD” in Figure 8 in Ref. [7]).
For each Auger site, we simulated 1000 events above eV) = 19.6 with zenith angles between 3075∘ and random azimuth. We accounted for a detector resolution of 25 g cm-2 in and 10% in primary energy. The zenith angle range was chosen similar to that in the analysis of Auger data for the first photon limit [7]. In particular, near-vertical events are excluded in this example to reduce the fraction of photon events with below ground (see also discussion in Section 4.3). The simulated event number corresponds to an observation time of about 58 years of the completed Auger South ground array. For a similar data taking period, data statistics of the fluorescence detectors is reduced by a factor 7.
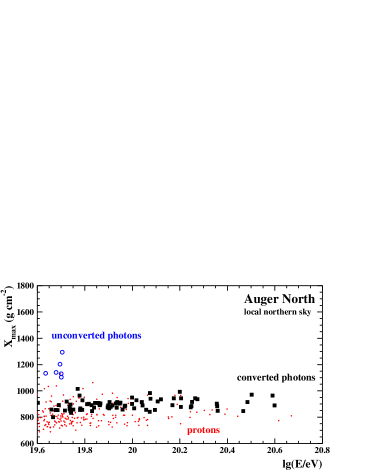
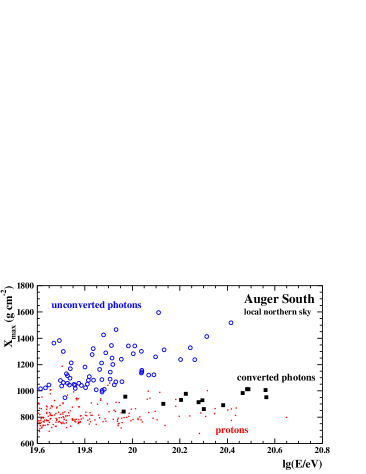
In Figure 8 we show, as a scatter plot, the versus primary energy. We restricted the azimuth range in this plot to the local northern sky by requiring an azimuth between 30150∘. In this region of the sky, photon conversion starts at Auger North at smaller energies than at Auger South. As can be seen from the Figure, there are considerably less events with large (e.g. exceeding 1000 g cm-2) at Auger North, for the same overall cuts applied to the data at both sites.
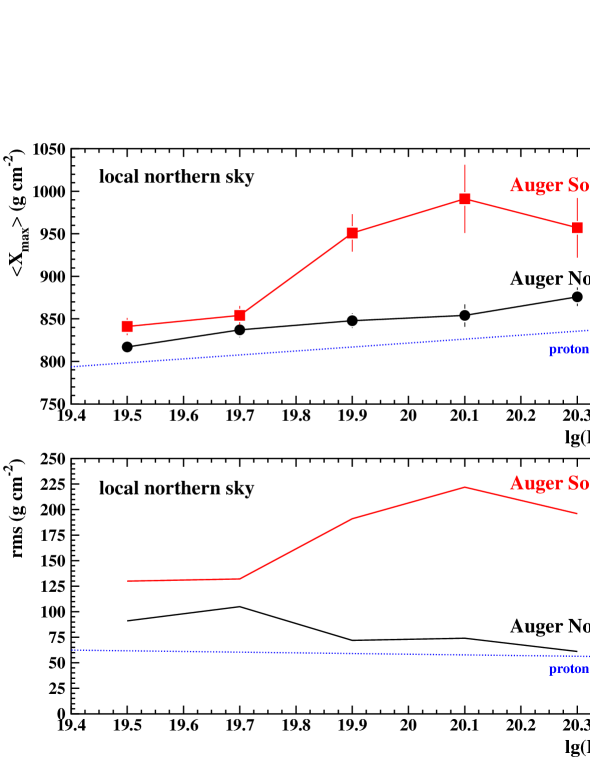
The corresponding average and the fluctuations as a function of energy are shown in Figure 9. Clear differences between the two sites can be noted. In particular, the larger average at Auger South is accompanied by significantly increased shower fluctuations.
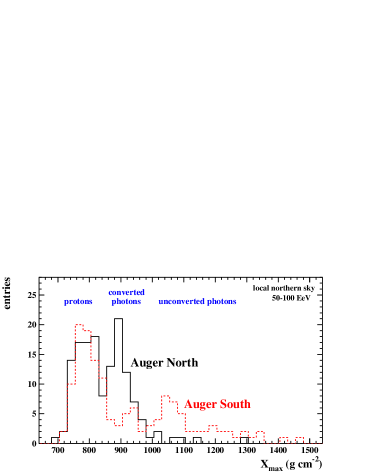
The distribution of events (as projected from the scatter plot shown in Figure 8) is given for 50100 EeV primary energies in Figure 10. At Auger North, the events with large (unconverted photons, present at Auger South), are mostly lacking. Instead, events accumulate at g cm-2 (converted photons). To see the effect of a hypothetic GZK suppression of the energy spectrum at high energies, we applied a simple cut-off at E = 80 EeV (eV) = 19.9) to the data set. As expected, all the characteristic peaks of the distribution remain at the same positions as in case of spectrum without cut-off plotted in Figure 10. The only difference is the heights of the peaks corresponding to converted and unconverted photons with respect to the proton peak: they decrease by 10-20% in case of spectrum with cut-off. This is due to the larger fraction of photons at higher energies in the assumed model.
An observation of such different characteristics at Auger North and South (signal at different values of , behaviour of average and fluctuations as a function of energy), would be an unambiguous confirmation of a photon signal detection.
So far, the local northern sky was studied. As expected, a similar but opposite behaviour is found for the local southern sky (not shown) when selecting, for instance, shower arrival directions from azimuth angles between 210330∘. Since this occurs at a somewhat higher energy, the event statistics is reduced in this case due to the steep primary flux spectrum.
4.2 Photon signal from a localized source region
Let’s now regard a hypothetical scenario of a photon signal coming from a certain source region. Localized hadron-accelerating sources are expected to produce photons at an energy typically 10 times smaller than the maximum energy of accelerated hadrons. Detection of the currently highest energy event at eV provides a motivation for the investigation of photons at not much lower energies produced by a localized source.
The sky region accessible to both Auger sites is limited to source declinations . Requiring a maximum zenith angle of for shower observations at both sites, the range of accessible declinations is .
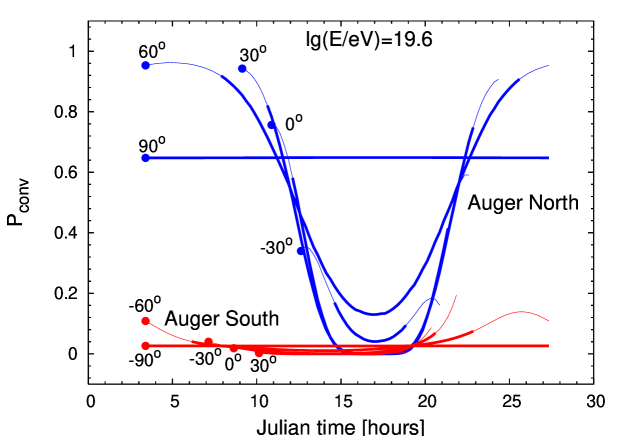
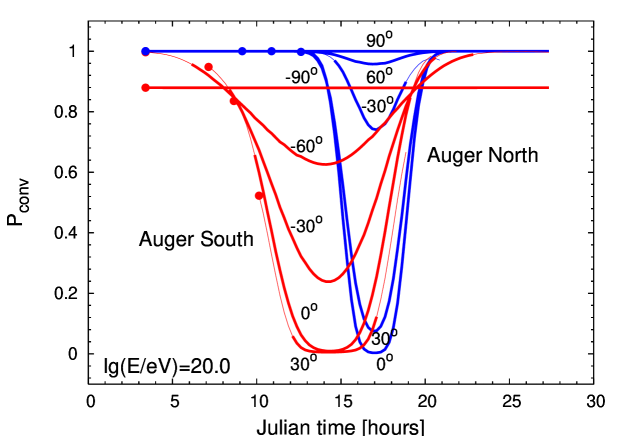
The conversion probability of UHE photons from the direction of a certain source can change with time even at one site only, depending on the source declination. Examples are given in Figure 11 for eV and eV photons. For instance, for a source at the celestial equator conversion probabilities between 075% are covered at eV at Auger North.
It is interesting to note that for the same conditions, the conversion probability is negligible at Auger South. Thus, characteristic differences when observing events from the same sky region exist that again could be used for a complementary study of UHE photons. A special case is the scenario of a source region observed at the same time from Auger North and South. Also here, differences exist in the instantaneous conversion probability of photons. This can be seen in Figure 11 by comparing the curves at Auger North and South for the same source declination as a function of time. For instance, the instantaneous difference in the conversion probabilities for eV photons from a source at the celestial equator can reach, in the extreme case, almost 100%. Differences exist also for sources at declinations , i.e. for the galactic center region (Figure 11).
4.3 Absence of photons
If the photon flux is below the detection limits of current experiments, upper limits are deduced by comparing the data to expectations for showers initiated by primary photons. The signatures from photon showers differ between Auger North and South due to geomagnetic cascading. Thus, even in case of observing no photons at both sites, differences arise in the analysis of the data since the photon hypothesis tested when deriving a limit is different at each site. Upper limits obtained at Auger South can, to some extend, be cross-checked this way at Auger North.
In photon limit studies, simulations are used to optimize the analysis cuts and to calculate the acceptance to photons. Due to the generally larger , the acceptance to photons can be smaller than that to nuclear primaries when requiring the to be above ground. Then, an efficiency correction to the photon limit may be needed. To keep the correction small, a fiducial volume cut was applied in [7], requiring a minimum zenith angle of 35-42 deg (depending on energy).
This condition could be relaxed at Auger North due to the onset of the preshower effect at smaller energies. On the one hand, the power of shower-to-shower discrimination is reduced for events from these arrival directions, as converted photon showers are more similar to proton-induced showers than unconverted ones. On the other hand, the result is a gain in instantaneous aperture at Auger North. The effective gain is largest at energies around eV)19.8 where for a sizeable part of the sky, photons already can convert at Auger North, contrary to Auger South. For identical experiments and requiring to be above ground, the aperture is increased at Auger North by 30% (20%) when allowing zenith angles up to 60∘ (75∘) at eV)19.8.
5 Conclusion
The difference of conversion probabilities is a convenient and effective parameter to estimate the complementarity between two sites for searching for UHE photons. Regarding the two sites of the Pierre Auger Observatory, Auger North and Auger South, significant differences in the preshower features of UHE photons exist. The sky patterns of the preshower features are shifted due to the different pointing directions of the local magnetic field vectors. In addition, Auger North is located closer to the magnetic pole. This leads to a larger transition range in energy from small () to large () conversion probabilities compared to Auger South. More specifically, photon conversion starts at Auger North at smaller energies due to the larger magnetic field, but conversion probabilities are reached for the whole sky at higher energies due to the smaller bending of the field line with distance.
These differences in the preshower characteristics result in different rates of (un-)converted photons from the same (both in local and astronomical coordinates) regions of the sky. Air showers initiated by converted and unconverted photons can be well distinguished by current experiments. The main difference is related to the position of depth of shower maximum , which is typically 200300 g cm-2 smaller for converted photons.
For a variety of UHE photon flux scenarios (diffuse photon flux; photons from source regions; absence of photons), the different preshower characteristics at the experimental sites can be used for a complementary search for UHE photons. Most important, a possible detection of UHE photons at Auger South may be confirmed in an unambiguous way at Auger North by observing the well predictable change in the signal from UHE photon showers.
Acknowledgements: This work was partially supported by the Polish State Committee for Scientific Research under grants No. PBZ KBN 054/P03/2001 and 2P03B 11024, by Polish Ministry of Science and Higher Education under grant N202 090 31/0623 and in Germany by the DAAD under grant No. PPP 323. Helpful remarks of the unknown referee, especially those concerning the motivation of Subsection 4.2, are kindly acknowledged. MR acknowledges support from the Alexander von Humboldt foundation.
Appendix A Transverse component of the geomagnetic field along various trajectories
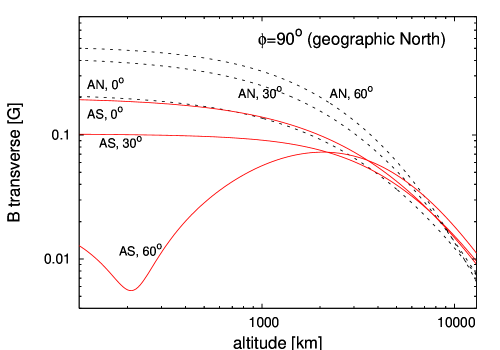
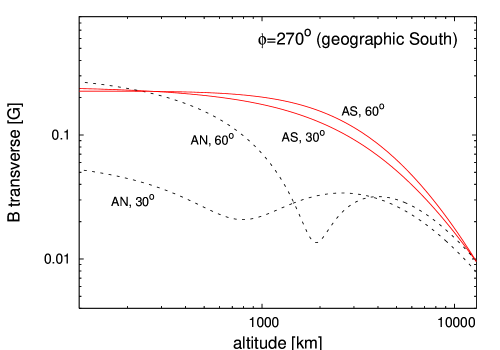
Appendix B Preshower sky maps

References
- [1] P. Bhattacharjee, G. Sigl, Phys. Rep. 327, 109 (2000); S. Sarkar, Acta Phys. Polon. B35, 351 (2004).
- [2] G. Gelmini, O.E. Kalashev, D.V. Semikoz, [arXiv:astro-ph/0506128].
- [3] M. Ave et al., Phys. Rev. Lett. 85, 2244 (2000); Phys. Rev. D65, 063007 (2002).
- [4] K. Shinozaki et al., Astrophys. J. 571, L117 (2002).
- [5] M. Risse et al., Phys. Rev. Lett. 95, 171102 (2005).
- [6] G.I. Rubtsov et al., Phys. Rev. D 73, 063009 (2006).
- [7] Pierre Auger Collaboration, submitted to Astropart. Phys.; [arXiv:astro-ph/0606619].
- [8] J. Abraham et al., P. Auger Collaboration, Nucl. Instrum. Meth. A 523, 50 (2004).
- [9] B. McBreen, C.J. Lambert, Phys. Rev. D 24, 2536 (1981).
- [10] F.A. Aharonian, B.L. Kanevsky, V.V. Vardanian, Astrophys. Space Sci. 167, 111 (1990); H.P. Vankov, P.V. Stavrev, Phys. Lett. B 266, 178 (1991); F. Halzen et al., Astropart. Phys. 3, 151 (1995); S. Karakula, W. Bednarek, Proc. 24th Intern. Cosmic Ray Conf., Rome, 266 (1995); A.V. Plyasheshnikov, F.A. Aharonian, J. Phys. G 238, 267 (2002); W. Bednarek, New Astronomy 7, 471 (2002); H.P. Vankov, N. Inoue, K. Shinozaki, Phys. Rev. D 67, 043002 (2003); P. Homola et al., Proc. 28th Intern. Cosmic Ray Conf., Tsukuba, 547 (2003); H.P. Vankov et al., Proc. 28th Intern. Cosmic Ray Conf., Tsukuba, 523 & 527 (2003); M. Ave et al., Phys. Rev. D 67, 043005 (2003); P. Homola et al., Acta Phys. Polon. B 35, 1893 (2004); M. Risse et al., Astropart. Phys. 21, 479 (2004); A.C. O’Neill and S. Westerhoff, HiRes Collaboration Proc. 29th Intern. Cosmic Ray Conf., Pune 7, 373 (2005); M. Risse et al., Czech. J. Phys. 56 (2006) A327, [arXiv:astro-ph/0512434].
- [11] T. Stanev, H.P. Vankov, Phys. Rev. D 55, 1365 (1997).
- [12] W. Bednarek (1999), [arXiv:astro-ph/9911266].
- [13] X. Bertou, P. Billoir, S. Dagoret-Campagne, Astropart. Phys. 14, 121 (2000).
- [14] P. Homola et al., Comp. Phys. Comm. 173, 71 (2005).
- [15] T. Erber, Rev. Mod. Phys. 38, 626 (1966).
- [16] T. Pierog et al., Nucl. Phys. B (Proc. Suppl.) 151, 159 (2006); T. Bergmann et al., [arXiv:astro-ph/0606564].
- [17] National Geophysical Data Center, USA, http://www.ngdc.noaa.gov.
- [18] N. A. Tsyganenko, National Space Science Data Center, NASA GSFC, Greenbelt, MD 20771, USA http://nssdc.gsfc.nasa.gov/space/model/magnetos/data-based/geopack.html.
- [19] T. Abu-Zayyad et al., HiRes Collaboration, Astropart. Phys. 23, 157 (2005).
- [20] M. Fukushima et al., Prog. Theor. Phys. Suppl. 151, 206 (2003).
- [21] L.D. Landau, I.Ya. Pomeranchuk, Dokl. Akad. Nauk SSSR 92, 535 & 735 (1953); A.B. Migdal, Phys. Rev. 103, 1811 (1956).
- [22] D. Heck et al., Reports FZKA 6019 & 6097, Forschungszentrum Karlsruhe (1998).
- [23] S. Eidelmann et al., Particle Data Group, Phys. Lett. B592, 1 (2004).
- [24] N.N. Kalmykov, S.S. Ostapchenko, A.I. Pavlov, Nucl. Phys. B (Proc. Suppl.) 52B, 17 (1997).
- [25] P. Sommers for the Auger Collaboration, Proc. 29th Intern. Cosmic Ray Conf., Pune, 7, 387 (2005); [arXiv:astro-ph/0507150].