2MASS J05162881+2607387: A New Low-Mass Double-Lined Eclipsing Binary111Based on observations obtained with the Hobby-Eberly Telescope, which is a joint project of the University of Texas at Austin, the Pennsylvania State University, Stanford University, Ludwig-Maximilians-Universität München, and Georg-August-Universität Gẗtingen.
Abstract
We show that the star known as 2MASS J05162881+2607387 (hereafter J0516) is a double-lined eclipsing binary with nearly identical low-mass components. The spectroscopic elements derived from 18 spectra obtained with the High Resolution Spectrograph on the Hobby-Eberly Telescope during the Fall of 2005 are km s-1 and km s-1, resulting in a mass ratio of and minimum masses of and , respectively. We have extensive differential photometry of J0516 obtained over several nights between 2004 January-March (epoch 1) and 2004 October-2005 January plus 2006 January (epoch 2) using the 1m telescope at the Mount Laguna Observatory. The source was roughly 0.1 mag brighter in all three bandpasses during epoch 1 when compared to epoch 2. Also, phased light curves from epoch 1 show considerable out-of-eclipse variability, presumably due to bright spots on one or both stars. In contrast, the phased light curves from epoch 2 show little out-of-eclipse variability. The light curves from epoch 2 and the radial velocity curves were analyzed using our ELC code with updated model atmospheres for low-mass stars. We find the following: , , , and . The stars in J0516 have radii that are significantly larger than model predictions for their masses, similar to what is seen in a handful of other well-studied low-mass double-lined eclipsing binaries. We compiled all recent mass and radius determinations from low-mass binaries and determine an empirical mass-radius relation of the form .
1 Introduction
| Name | Mass () | Radius () | Reference |
|---|---|---|---|
| V818 Tau B | Torres & Ribas (2002) | ||
| RX J0239.1-1028 A | Ribas (2005) | ||
| RX J0239.1-1028 B | Ribas (2005) | ||
| GU Boo A | Lopez-Morales & Ribas (2005) | ||
| GU Boo B | Lopez-Morales & Ribas (2005) | ||
| YY Gem AB | Torres & Ribas (2002) | ||
| NSVS0103 A | Lopez-Morales et al. (in prep) | ||
| NSVS0103 B | Lopez-Morales et al. (in prep) | ||
| TrES-Her0-07621 A | 0.4930.003 | 0.4530.060 | Creevey et al. (2005) |
| TrES-Her0-07621 B | 0.4890.003 | 0.4520.050 | Creevey et al. (2005) |
| BW3 V38 A | 0.440.07 | 0.510.04 | Maceroni & Montalbán (2004) |
| BW3 V38 B | 0.410.09 | 0.440.06 | Maceroni & Montalbán (2004) |
| CU Cnc A | Ribas (2003) | ||
| CU Cnc B | Ribas (2003) | ||
| CM Dra A | 0.23070.0010 | 0.25160.0020 | Lacy (1977) and Metcalfe et al. (1996) |
| CM Dra B | 0.21360.0010 | 0.23470.0019 | Lacy (1977) and Metcalfe et al. (1996) |
Binary stars offer the best opportunity for accurate measurements of the radii and masses of stars, measurements essential to verify stellar evolution theory and to determine the properties of other diverse objects such as white dwarfs, neutron stars, black holes, and extra-solar planets. These measurements rely on dynamical constraints from observed radial and rotational velocities, and geometric constraints from photometric time series observations. Using computer models of binary stars we can derive physical parameters (e.g. masses, radii, etc.). Understanding the structure and evolution of stars is a basic goal of stellar astronomy, and is required in most other branches of astronomy. Critical tests of evolution theory for stars other than the Sun can be made on a small set of eclipsing binary stars [see, Pols et al. 1997; Schröder et al. 1997]. In general, when accurate tests are available, the results of stellar evolution models compare favorably to data for main sequence stars with masses greater than one solar mass (Pols et al., 1997). In contrast, evidence has been growing that the models for stars on the lower main sequence have problems when confronted with precise data from eclipsing binaries. For example, Torres & Ribas (2002) showed that all available evolutionary models underestimate the radii of the components of the M-star YY Gem by about 20 and overestimate the effective temperatures by 150 K or more. Similar discrepencies are found in V818 Tau (Torres & Ribas, 2002), in CU Cnc (Ribas, 2003), and GU Boo (Lopez-Morales & Ribas, 2005). See Table 1 for a compilation of recent mass and radius determinations derived from low-mass eclipsing binaries.
The disagreement between the models and the data for these binaries is troubling since models for low mass stars are used to estimate the ages for open clusters and individual T Tauri stars by placing them in an HR diagram. Since the number of well-studied low-mass binaries is still relatively small, observations of additional low mass binaries would be extremely useful. The star known as 2MASS J05162881+2607387 (hereafter J0516) was discovered to be an eclipsing binary by Schuh et al. (2003), who noticed its variability during the course of an extensive campaign to monitor a pulsating white dwarf. The eclipse period was determined to be 1.29395(25) days. On the basis of a moderate resolution spectrum and photometric colors, Schuh et al. (2003) determined an effective temperature of 4200 K for the primary, corresponding to a spectral type of K7V. Assuming that the orbital period is the same as the eclipse period, Schuh et al. (2003) modelled the light curve and derived a mass ratio of , a radius ratio of , and a temperature ratio of . Based on their modelling results, Schuh et al. (2003) suggested that J0516 consists of a late K-type star paired with a brown dwarf. Schuh et al. (2003) also briefly considered the possibility that the orbital period of J0156 was twice the eclipse period (i.e. days). In that case, the primary and secondary eclipses are identical in their phased light curve. Our spectroscopic results clearly indicate that the orbital period of J0516 is in fact 2.58791 days.
We discuss below our observations of J0516, models of the light and velocity curves, and implications of our results.
2 Observations and Reductions
2.1 Differential Photometry

| Star | USNO Number | ||
|---|---|---|---|
| (U1125) | (J2000) | (J2000) | |
| 1 | 02245259 | 05 16 38.302 | 26 11 34.98 |
| 2 | 02244488 | 05 16 35.311 | 26 03 18.40 |
| 3 | 02244635 | 05 16 35.933 | 26 05 44.20 |
| 4 | 02243339 | 05 16 30.797 | 26 08 09.85 |
| 5 | 02243426 | 05 16 31.133 | 26 09 33.66 |
| 6 | 02245357 | 05 16 38.688 | 26 09 32.18 |
| 7 | 02248141 | 05 16 49.409 | 26 08 03.88 |
J0516 was observed extensively over 44 nights from January 2004 to January 2006 at the Mount Laguna Observatory (MLO, located in Southern California). We used the 1m telescope equipped with a Loral CCD (binned , yielding a pixel scale of 0.8 arcseconds per pixel) and standard , and filters. Typically, the integration times were 300-360 seconds, 240-300 seconds, and 180 seconds for , , and bandpasses, respectively, with each observing session lasting several hours per night. These observations were divided into two main epochs based on the source behavior, January - March 2004 (epoch 1) and October 2004 - January 2005, plus January 2006 (epoch 2). In epoch 1, there are 398 band images, 369 band images, and 137 band images. There were fewer band images because of the difficulty of obtaining quality images through the occasional clouds and periods of poor seeing. In the epoch 2, there are 678 band images, 588 band images, and 481 band images.
Standard IRAF222IRAF is distibuted by the National Optical Astronomy Observatory, which are operated by the Association of Universities for Research in Astronomy, Inc., under the cooperative agreement with the National Science Foundation tasks were used to remove the electronic bias and to perform the flat-fielding corrections. The IRAF task ‘imalign’ was used to remove the differences in the pixel locations of the stellar images and to place all the CCD images on the same relative coordinate system.
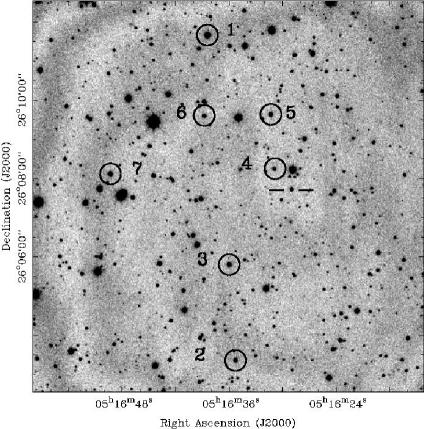
Differential light curves were derived using a two step process. Stable comparison stars were found using an automated script that utilizes Stetson’s programs DAOPHOT IIE, ALLSTAR, and DAOMASTER (Stetson 1987; Stetson, Davis, & Crabtree 1991; Stetson 1992a & 1992b). To do this, the point spread function (PSF) was determined from each image from fits to several isolated stars, and the instrumental magnitudes were computed using an aperture with a radius of 6 pixels. We identified seven stable stars that are relatively bright and isolated. The coordinates of these seven stars are given in Table 2 and a finding chart is shown in Figure 1. Then, the IRAF task ‘phot’ was used to perform aperture photometry on J0516 and the seven comparison stars using a sequence of 14 concentric apertures of radius 3-16 pixels. The IRAF implimentation of Stetson’s curve-of-growth technique (Stetson 1990) was used to derive optimal instrumental magnitudes corresponding to the largest aperture. Finally, the light curve of J0516 was found differentially by using the average instrumental magnitudes of the seven comparison stars. The phased differential light curves from both epochs are shown in Figure 2. The mean magnitudes of J0516 determined by Schuh et al. (2003) are , , and . We note that since the source is very red, the signal-to-noise is highest in and lowest in .
2.2 Echelle Spectroscopy
We have obtained 18 spectra () using the High Resolution Spectrograph (HRS, Tull 1998) and the Hobby-Eberly Telescope (HET, Ramsey et al. 1998). The instrument configuration consisted of a resolving power of 15,000, the central echelle rotation angle, the 316 groove mm-1 cross disperser set to give a central wavelength of 6948 Å, the 2 arcsecond science fiber, and two sky fibers. The source was observed by the HET staff in dark skies and good seeing conditions between 2005 October 10 and December 27. The exposure times were 1800 seconds each, split up into two 900 second parts to aid in the removal of cosmic rays. We also have the spectrum of the bright K7V star HD 28343 for comparison purposes, as well as ten spectra of six radial velocity standard stars selected by the HET staff from the list of Nidever et al. (2002).


The electronic bias was removed from each image. Then the pairs of 900 second exposures were combined using the ‘crreject’ option for cosmic ray removal. This worked very well, and the resulting spectra were largely free from cosmic rays. The echelle spectra were extracted and wavelength calibrated using the IRAF ‘echelle’ package. The signal-to-noise ratios of the extracted spectra generally lie in the range of about 10 to 20 per pixel. The HRS detector is a mosiac of two CCDs, and owing to the severe fringing on the “red” CCD, we have utilized only the portion of the spectra imaged on the the “blue” CCD, where the wavelength coverage is about 5100-6900 Angstroms.
The stability of the instrument was checked by cross correlating the spectra of the standard stars against each other using the ‘fxcor’ task in IRAF. The standard deviation of the differences between the velocities measured using fxcor and the velocities given in Nidever et al. (2002) was about 1.7 km s-1.
Radial velocities for the J0516 spectra were derived using the “Broadening Function” technique developed by Rucinski (1999). This technique for extracting radial velocities of double-lined binaries is often more robust than a simple cross correlation technique (Tonry & Davis 1979), especially when the velocity separation between the components is on the order of the spectral resolution. The spectrum of HD 28343 was used as the high signal-to-noise, sharp-lined reference spectrum. In preparation for the analysis, each echelle order was normalized to its continuum level using a three piece cubic spline. The normalized spectra were Doppler corrected to the heliocentric rest frame and the echelle orders were merged using a linear dispersion in the wavelength range Å with a pixel size of 0.1168 Å. In fifteen out of the eighteen spectra, the broadening functions (BFs) have two clear peaks, indicating that the spectrum is double-lined. The remaining three spectra happened to be taken at conjunction phases, and hence resembled single-lined spectra. Radial velocities were measured using Gaussian fits to the peaks in the BFs. Figure 3 shows representative BFs and the double Gaussian fits, and the corresponding cross correlation functions (CCFs) for comparison, where the spectrum of HD 28343 was used as the template spectrum. The peaks in the BFs are much better separated than the peaks in the CCFs, resulting in more reliable radial velocities. Figure 4 shows the radial velocities for both components folded on the period determined below.
The full widths at half maximum of the Gaussian fits to the J0516 broadening function peaks average about 16 km s-1, compared to an average of 11 km s-1 for the resulting peaks for the various sharp-lined radial velocity standard stars. This indicates that the rotational velocities of the stars in J0516 are marginally resolved (e.g. the resolving power corresponds to a velocity of km s-1), and are on the order of 16 km s-1.
We constructed “restframe” spectra for both stars by Doppler correcting each of the 18 individual spectra to zero velocity and averaging them together using ‘minmax’ rejection. This was done for the primary, which we define as the component that is eclipsed at HJD 2452251.5173 [the given in Schuh et al. (2003)] and then again for the secondary. The lines of the secondary appear to be removed from the restframe spectrum of the primary (and vice versa) reasonably well using the minmax rejection. Note, however, that the lines in a given restframe spectrum are diluted by the continuum from the other component. Figure 5 shows six different echelle orders of each restframe spectrum. Each order has been normalized to its continuum, smoothed using a running average of five pixels, and the spectrum of the secondary has been offset by 0.25 units for clarity. For the sake of the presentation, the J0516 spectra showing the Mg I b feature near 5180 Å have not been sky subtracted owing to the poor signal-to-noise in the object there. Also shown is the spectrum of the K7V star HD 28343 (obtained with the same instrumental configuration), which has been normalized to its continuum and scaled by 0.5 in order to account for the dilution of the lines in the restframe spectra. Although the signal-to-noise ratios in the combined “restframe” spectra are not terribly large, the two stars appear to have nearly identical line features, many of which resemble the lines seen in the K7V comparison. Thus the spectral type of K7V determined by Schuh et al. (2003) appears to be correct. The relative areas under the BFs give the “luminosity” ratio, , which is unity to within the errors.

There is, however, very noteable difference between the spectra of the J0516 components and the template spectrum: the stars in J0516 have no significant feature at H, either in emission or in absorption. In this regard, J0516 resembles some RS Canum Venaticorum and BY Draconis binaries that have “filled in” H line profiles (e.g. Fernandez-Figueroa, et al. 1994). Our photometric light curves, discussed below, also indicate that one or both stars in J0516 have relatively high levels of stellar activity. The equivalent width of the H absorption line in the K7V template star is about 0.55 Å, so presumably each star in J0516 would have to have an H emission line with an equivalent width of about 0.55 Å in order to produce a roughly featureless spectrum at H.
We examined the spectra near 6708 Å for an indication of the Li I doublet, which is sometimes used as an age indicator (e.g. Boesgaard & Tripicco 1986; Boesgaard & Budge 1988). There are no significant lines near this wavelength in either the primary restframe spectrum or the secondary restframe spectrum, down to an equivalent width of about 0.02 Å, which is roughly the noise level (see Figure 5).
There are more sophisticated deblending techniques to analyze the spectra of double-lined binaries, but these typically require a grid of template stars. Thus, we are limited since the only appropriate template spectrum we have is that of the K7V star HD 28343 (the radial velocity standards observed for us are all various subtypes of spectral class G). Nevertheless, we did construct an alternate restframe spectrum of the primary by scaling the normalized template spectrum by 0.5, Doppler shifting it to match the velocity of the secondary for each observation, subtracting it from each observation, Doppler shifting the difference spectra to remove the velocity of the primary, and finally, averaging the “difference spectra” to produce the final result. Apart from having absorption lines a factor of two stronger, this alternate restframe spectrum looked very similar to the spectrum shown in Figure 5. The noise levels in the continua are similar, and there is no feature at H.
3 Analysis
3.1 System Variablity
The light curves from epoch 1 are distinctly different than the light curves from epoch 2. As shown in Figure 2, the source was roughly 0.1 mag brighter in all three bandpasses during epoch 1 when compared to epoch 2. Although we do not have standard star observations, an inspection of the instrumental colors indicates that the system was mag redder in during epoch 1. Also, phased light curves from epoch 1 show considerable out-of-eclipse variability, presumably due to bright spots on one or both stars. In contrast, the phased light curves from epoch 2 show little out-of-eclipse variability. Asymmetries in the light curves seem to be a common feature of low-mass binaries (e.g. the GU Boo light curves shown by Lopez-Morales & Ribas 2005). However, the activity in J0516 seems to be at a much higher level compared to other well-studied low mass binaries, especially the increase on the system brightness observed in epoch 1. If this increase in brightness is due to bright spots, then one would need to have a substantial portion of the surface of one or both components covered with bright areas in order to have them visible at all phases.
3.2 Light Curve Modeling
We modeled the light curves using our ELC code (Orosz & Hauschildt, 2000) with updated model atmospheres for low mass main sequence stars and brown dwarfs (Hauschildt, private communication). Our “base” model has nine free parameters: the inclination , the mass of the primary , the -velocity of the primary , the radius of the primary , the temperature of the primary , the ratio of the radii , the ratio of the temperatures , the orbital period , and the time of primary eclipse . Note that for a given orbital period and inclination , specifying the primary mass and -velocity uniquely determines the ratio of masses and the orbital separation . We have found that in cases such this one, it is more efficient to explore the parameter space rather than the parameter space since the observed radial velocity curves give and a rough value of directly. We adopt a primary temperature of K (Schuh et al., 2003). The gravity darkening exponents were set according to the mean stellar temperatures according to the results of Claret (2000). “Simple” reflection was used (see Wilson 1990), assuming bolometric albedos of 0.5 for each star. We assume a circular orbit with synchronous rotation for both stars. We note, finally, that limb darkening coefficients are not needed since we have model atmosphere specific intensities tabulated at 99 emergent angles.
The light curves of close binary stars are sometimes asymmetric about the conjunction phases, and these asymmetries are often attributed to spots (either bright or dark) on one or both components. The spots in ELC are parameterized in the same way as in the Wilson-Devinney (1971) code. They are circular regions specified by four parameters: the “temperature factor” , the “latitude” of the spot center, the “longitude” of the spot center, and the angular radius of the spot. Bright spots have and dark spots have .
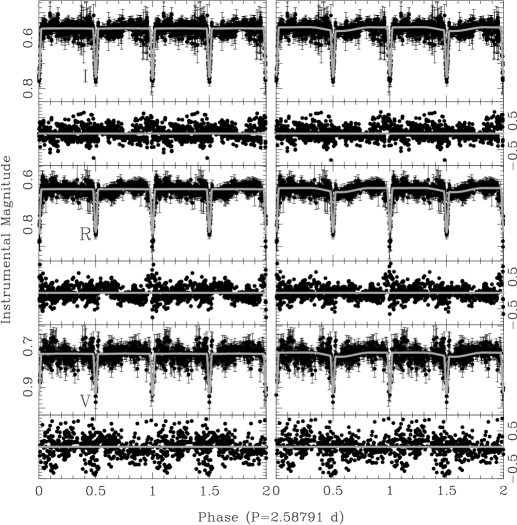
We began by modelling the Epoch 2 light curves since these light curves are better sampled and show very little out-of-eclipse variability. The best-fitting model (with no spots) was arrived at by iteration and brute force. Our “observables” are light curves in , , and , radial velocity curves for both stars, and a “luminosity ratio” of , taken to be in the -band. We ran ELC’s genetic optimizer several times to arrive at the best intermediate solution using liberal ranges for the free parameters. Using this solution, we scaled the error bars on the photometry and radial velocities to give for each data set separately. The median error bars after this scaling were mag for , mag for , mag for , km s-1 for the primary radial velocity curve, and km s-1 for the secondary radial velocity curve. The data sets with the scaled error bars were optimized again using the genetic optimizer and a simple “grid search” technique. The best-fitting spotless model is shown in the left panels of Figure 6.
| Parameter | Epoch 2 without | Epoch 2 with | Epoch 1 with |
|---|---|---|---|
| spot | spot on each star | with spot | |
| Period (days) | |||
| (HJD+2,450,000) | |||
| Inclination (deg) | |||
| (km s-1) | |||
| (km s-1) | |||
| (km s-1) | |||
| (km s-1) | |||
| (km s-1) | |||
| () | |||
| () | |||
| () | |||
| () |

We used the procedure outlined in Orosz et al. (2002) to find approximate 1, 2, and 3 confidence intervals. To estimate uncertainties on fitted and derived parameters we projected the 9-dimensional function into each parameter of interest. The 1, 2, and 3 confidence limits taken to be the ranges of the parameter where , , and , respectively. Since the genetic ELC code samples parameter space near extensively, computing these limits is simple. ELC saves from every computed model the of the fit, the value of the free parameters, and the astrophysical parameters (e.g., the primary star mass, the radii of the components, etc.). One can then select out the lowest at each value of the parameter of interest. The values and their uncertainties of various fitting and derived parameters for the best-fitting Epoch 2 spotless model are given in Table 3.
We then checked for systematic trends by searching for periodicities in the -band residuals (the -band light curve has the best signal-to-noise). The Lomb-Scargle periodogram (Lomb 1976; Scargle 1982) showed significant power at the orbital period. Indeed, a small modulation with an amplitude of about 1% is evident in the -band residuals when they are phased on the orbital period and binned into 50 phase bins (see Figure 7). There is also a small systematic problem with the model near primary eclipse.
We performed additional fits to the Epoch 2 light curves using models with spots. We had five different spot configurations: a spot on the primary only, a spot on the secondary only, two spots on the primary only, two spots on the secondary only, and a single spot on both the primary and secondary. All of the models with spots had values that are significantly lower than the spotless model (see Table 4). The phased and binned -band residuals for the spotted models look very similar to each other. Figure 7 shows the phased and binned residuals for two of the spot models. The low-level modulation near phase 0.5 is gone, but the feature near primary eclipse at phase 0 remains. Apart from some small differences in the derived radii of the stars, the model and derived parameters for the spotted models agree quite well with the spotless model. As an example, Table 3 gives the parameters for the model with a single spot on each star, and the panels on the right side of Figure 6 show this model.
The temperature of the primary is not constrained by our light curves alone. However, the ratio of the temperatures is quite well constrained by the light curves, and is quite close to unity (see Table 3), as we expected based on the spectroscopic results (i.e. the restframe spectrum of the primary looks the same as the restframe spectrum of the secondary to within the noise level).
In all of the modelling described previously, we used the observed “luminosity ratio” in the -band of as an additional constraint. Basically, we compute the quantity and add it to the total , which has the effect of selecting models that have . This is an entirely reasonable constraint since the spectroscopic results indicate that the primary star has the same spectral type as the secondary star, and that the two stars have nearly equal masses (i.e. ). In order to test for possible systematic errors, we did additional model fits to the epoch 2 light curves without the luminosity ratio constraint. For the baseline model with no spots, we found basically the same temperature ratio () as before. However, the ratio of the radii was , which yields a -band luminosity ratio of . It seems unlikely that two stars with nearly equal masses and temperatures should have such dissimilar radii, so we reject this model and only consider the models that have the luminosity ratio constraint imposed.
The most interesting astrophysical parameters are the masses and radii of the stars, and Table 4 gives these values for all of the Epoch 2 models. Formally, the model with a single spot on each star gives the best fit. While the derived masses depend mainly on the radial velocity curves, the light curves have some weak dependence on the scale of the binary since ELC uses model atmosphere intensities that are tabulated in temperatures and gravities. As a result, the derived masses for each of the models are not exactly the same. There is a maximum spread of for the mass of the primary and for the secondary, respectively, which is is less than the formal errors. Based on the best-fitting model, we adopt values of and for the primary and secondary masses, respectively. On the other hand, the derived radii show a bit more spread between the various models. There is a maximum spread of for the radius of the primary and for the radius of the secondary, respectively. Based on the best-fitting model, we adopt values of and for the primary and secondary radii, respectively. We caution that these values for the radii probably have systematic errors on the order of , given the spread in radii for the various models, the persistent feature in the residuals near phase 0 shown in Figure 7, and the need to impose the spectroscopically determined luminosity ratio.
| model | comment | |||||
|---|---|---|---|---|---|---|
| no spots | 1774 | |||||
| 1 spot each | 1551 | dark and bright spot | ||||
| 2 spots, primary | 1570 | dark spots | ||||
| 2 spots, secondary | 1576 | bright spots | ||||
| 1 spot, primary | 1603 | dark spot | ||||
| 1 spot, secondary | 1604 | dark spot | ||||
| epoch 1 | bright spot |
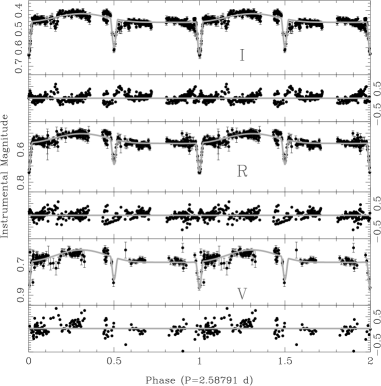
For completeness, we also fit the epoch 1 data using the same basic model as above and adding a single spot on the primary. The parameters are given in Table 3 and the phased light curves, the best-fitting models, and residuals are shown in Figure 8. The model fits reasonably well, and for the most part the fitted and derived parameters agree quite well with those found from the epoch 2 fits, in spite of the fact that the secondary eclipse is not well sampled in epoch 1, and, as noted above, there is considerable out-of-eclipse variability in epoch 1. The one noteable exception is the primary radius, which is from the epoch 1 model and from the epoch 2 model, a difference of nearly . Although the epoch 1 residuals have more scatter than their epoch 2 counterparts, the epoch 1 residuals show no significant power at the orbital period in a Lomb-Scargle periodogram.
3.3 Eclipse Timings

| Eclipse Time (HJD) | Epoch | (days) | Reference |
|---|---|---|---|
| 2452251.5164 | 0.0 | Schuh et al. (2003) | |
| 2452255.4007 | 1.5 | ||
| 2452263.1615 | 4.5 | ||
| 2452264.4599 | 5.0 | ||
| 2452265.7487 | 5.5 | ||
| 2452267.0450 | 6.0 | ||
| 2452586.6506 | 129.5 | ||
| 2452590.5304 | 131.0 | ||
| 2453018.8301 | 296.5 | This work | |
| 2453022.7100 | 298.0 | ||
| 2453048.6001 | 308.0 | ||
| 2453287.9700 | 400.5 | ||
| 2453304.8000 | 407.0 | ||
| 2453357.8401 | 427.5 | ||
| 2453388.8799 | 439.5 | ||
| 2453753.7800 | 580.5 |
We determined eclipse times by fitting a parabola to the -band observations near times of eclipse (the -band observations have the highest signal-to-noise). The timings and cycle counts are given in Table 5 and have typical uncertainties of about 10 minutes. The table also gives the eclipse times determined by Schuh et al. (2003) with updated cycle counts. Schuh et al. (2003) give no uncertainties in their eclipse timings, but from an inspection of their plotted light curves, it seems likely that their timings are more accurate than ours, so we assign their timing three times more weight than our timings. These timings are described by the linear ephemeris
(error in the last digit is in parenthesis). This period differs by from the spectroscopic/photometric period derived from the ELC modelling. An diagram is shown in Figure 9. The maximum deviation is on the order of 20 minutes, and there is no obvious trend.

4 Summary and Discussion
We have derived fairly accurate values of the masses and radii of the two stars in J0516. The masses are determined to 1.5% precision and the radii are formally determined to 1.9% precision, although there may be a systematic error of a few percent on the radius determinations. This high level of precision compares favorably to the precision achieved on the small number of other low-mass eclipsing binaries mentioned in Section 1. For low-mass stars with well determined masses and radii, the observed radii are consistently larger than what evolutionary models predict for their masses. The stars in J0516 are no exception. Figure 10 shows the stars in J0516 and those of other well-studied low-mass binaries in a mass-radius plot. We also show in Figure 10 theoretical mass-radius relationships with ages of 50 Myr, 100 Myr, and 300 Myr taken from the models of Baraffe et al. (2002). No single model passes through all of the observations, and all of the stars are above the 300 Myr model. We formed an empirical mass-radius relationship by fitting a parabola using weights on both the mass and radius through the other stars and the Sun (excluding J0516) and found the following equation
Compared to this empirical relationship, the J0516 primary agrees quite well, whereas the J0516 secondary is slightly too large.
Why is the secondary of J0516 so large for is mass? Ribas (2005) raises the possibility that the high level of stellar activity observed in the well-studied double-lined low-mass eclipsing binaries is what causes these stars to have radii that are larger than what is predicted. As we discussed earlier, J0516 is much more active than the other binaries, and the secondary’s deviation from the mass-radius relationship is the most extreme. It is not clear, however, if higher levels of activity would automatically lead to larger radii.
The Li I line is often used as an age indicator. An upper limit to the equivalent width of the Li I line at 6708 Å of 20 mÅ translates roughly to an abundance of , which translates into a lower limit on the age of the binary of about 150 Myr (Steinhauer 2003; Deliyannis private communication). The evolutionary models of Baraffe et al. (2002) indicate that a star takes about 70 Myr to contract and reach its “normal” main sequence radius. Taken at face value, the lower limit on the age of 150 Myr from the lack of lithium indicates that J0516 is well past its pre-main sequence phase, and that the unusually large radius of the secondary cannot be explained by youth.
The only practical way to establish the age of J0516 would be to associate it with a cluster or moving group. To do this, one would need good proper motions and distance for J0516 and a large number of stars in the nearby field. We know of no measurement of the proper motion of J0516 [for example, no proper motion measurement is given in the USNO-B catalog (Monet et al. 2003)]. The distance can be estimated from our model, but the result depends on the extinction and on the assumed temperatures of the stars. Schuh et al. (2003) determined a color excess of mag from their model of the spectral energy distribution. Assuming and (Cardelli, Clayton, & Mathis 1989), the -band extinction is mag. The absolute magnitude of the binary was found using filter-integrated surface brightnesses computed from NextGen models by France Allard (private communication), assuming the radii given in Table 3 and temperatures of K. The average apparent magnitude in the -band determined by the 2MASS survey is (see Schuh et al. 2003). We find a distance of pc. This distance is substantially larger than the distances to the other well-studied low-mass binaries mentioned earlier [e.g. pc in the case of GU Boo (Lopez-Morales & Ribas, 2005)].
J0516 is clearly a very important system in that it allows for further observational constraints for the lower main sequence. Owing to the enhanced variability, it would be worthwhile to obtain additional photometry to better define the “quiescent” phase and to better establish the eclipse profiles in quiescence. In addition, moderate resolution but high signal-to-noise spectroscopy would be useful in order to further investigate the apparent lack of an H feature in either star and to check for possible correlations between the profile of the H feature (if any) and the activity level.
References
- Baraffe et al. (2002) Baraffe, I., Chabrier, G., Allard, F., & Hauschildt, P. H. 2002, A&A, 382, 563
- Boesgaard & Tripicco (1986) Boesgaard, A. M. & Tripicco, M. J. 1986 ApJ, 302, 49
- Boesgaard & Budge (1988) Boesgaard, A. M. & Budge, K. G. 1988, ApJ, 332, 410
- Cardelli, Clayton, & Mathis (1989) Cardelli, J. A., Clayton, G. C., & Mathis, J. S. 1989, ApJ, 345, 245
- Claret (2000) Claret, A. 2000, A&A, 359, 289
- Creevey et al. (2005) Creevey, O. L., Benedict, G. F., Brown, T. M., Alonso, R., Cargile, P., Mandushev, G., Charbonneau, D., McArthur, B. E., Cochran, W., O’Donovan, F. T., Jimnez-Reyes, S. J., Belmonte, J. A., & Kolinski, D. 2005, ApJ, 625, L127
- Fernandez-Figueroa et al. (1994) Fernandez-Figueroa, M. J., Montes, D., de Castro, E., & Cornide, M. 1994, ApJS, 90, 433
- Lacy (1977) Lacy, C. H. 1977, ApJ, 218, 444
- Lomb (1976) Lomb, N. R. 1976, Ap&SS, 39, 447
- Lopez-Morales & Ribas (2005) Lopez-Morales, M. & Ribas, I. 2005, ApJ, 631, 1120
- Maceroni & Montalbán (2004) Maceroni, C. & Montalbán, J. 2004, A&A, 426, 577
- Metcalfe et al. (1996) Metcalfe, T. S. Mathieu, R. D., Latham, D. W., & Torres, G. 1996, ApJ, 456, 356
- Monet et al. (2003) Monet, D. G., Levine, S. E., Canzian, B., Ables, H. D., Bird, A. R., Dahn, C. C., Guetter, H. H., Harris, H. C., Henden, A. A., Leggett, S. K., Levison, H. F., Luginbuhl, C. B., Martini, J., Monet, A. K. B., Munn, J. A., Pier, J. R., Rhodes, A. R., Riepe, B., Sell, S., Stone, R. C., Vrba, F. J., Walker, R. L., Westerhout, G., Brucato, R. J., Reid, I. N., Schoening, W., Hartley, M., Read, M. A., & Tritton, S. B. 2003, AJ, 125, 984
- Nidever et al. (2002) Nidever, D. L., Marcy, G. W., Butler, R. P., Fischer, D. A., & Vogt, S. S. 2002, ApJS, 141, 503
- Orosz & Hauschildt (2000) Orosz, J. A., & Hauschildt, P. H. 2000, A&A, 364, 265
- Orosz et al. (2002) Orosz, J. A., Groot, P. J., van der Klis, M., McClintock, J. E., Garcia, M. R., Zhao, P., Jain, R. K., Bailyn, C. D., and Remillard, R. A. 2002, ApJ, 568, 845
- Pols et al. (1997) Pols, O. R., Tout, C. A., Schroder, K.-P., Eggleton, P. P., & Manners, J. 1997, MNRAS, 289, 869
- Ramsey et al. (1998) Ramsey, L. W., Adams, M. T., Barnes, T. G., Booth, J. A., Cornell, M. E., Fowler, J. R., Gaffney, N. I., Glaspey, J. W., Good, J. M., Hill, G. J., Kelton, P. W., Krabbendam, V. L., Long, L., MacQueen, P. J., Ray, F. B., Ricklefs, R. L., Sage, J., Sebring, T. A., Spiesman, W. J., & Steiner, M. 1998, Proc. SPIE, 3352, 34
- Ribas (2003) Ribas, I. 2003, A&A, 398, 239
- Ribas (2005) Ribas, I. 2005, astro-ph/0511431
- Rucinski (1999) Rucinski, S. 1999, IAU Coll. 170, eds. J. B. Hearnshaw and C. D. Scarfe, ASP Conf. Vol. 185, p. 82
- Scargle (1982) Scargle, J. D. 1982, ApJ, 263, 835
- Schröder et al. (1997) Schröder, K.-P., Pols, O. R., & Eggleton, P. P. 1997, MNRAS, 285, 696
- Schuh et al. (2003) Schuh, S. L., Handler, G., Drechsel, H., Hauschildt, P., Dreizler, S. Medupe, R., Karl, C., Napiwotzki, R., Kim, S.-L., Park, B.-G., Wood, M. A., Papar, M., Szeidl, B., Virghalmy, G., Zsuffa, D., Hashimoto, O., Kinugasa, K., Taguchi, H., Kambe, E., Leibowitz, E., Ibbetson, P., Lipkin, Y., Nagel, T., Ghler, E., and Pretorius, M. L. 2003, A&A, 410, 649
- Steinhauer (2003) Steinhauer, A. 2003, PhD Thesis, Indiana University
- Stetson (1987) Stetson, P. B., 1987, PASP, 99, 191
- Stetson (1990) Stetson, P. B., 1990, PASP, 102, 932
- Stetson (1992a) Stetson, P. B., 1992a, in ASP Conf. Ser. 25, Astronomical Data Analysis Software and Systems I, ed. D. M. Worrall, C. Biemesderfer, J. Barnes (San Francisco: ASP), 297
- Stetson (1992b) Stetson, P. B., 1992b, in IAU Colloq. 136, Stellar Photometry - Current Techniques and Future Developments, ed. C. J. Butler & I. Elliot (Cambridge: Cambridge Univ. Press), 291
- Stetson, Davis, & Crabtree (1991) Stetson, P. B., Davis L. E., Crabtree D. R., 1991, in ASP Conf. Ser. 8, CCDs in Astronomy, ed. G. Jacoby (San Francisco: ASP), 282
- Tonry & Davis (1979) Tonry, J., & Davis, M. 1979, AJ, 84, 1511
- Torres & Ribas (2002) Torres, G. & Ribas, I. 2002, ApJ, 567, 1140
- Tull (1998) Tull, R. G. 1998, Proc. SPIE, 3355, 387
- Wilson & Devinney (1971) Wilson, R. E., & Devinney, E. J. 1971, ApJ, 166, 605
- Wilson (1990) Wilson, R. E. 1990, ApJ, 356, 613