Discovery of twin kHz QPOs in the peculiar X-ray binary Circinus X-1
Abstract
We report the discovery with the RXTE/PCA of twin kHz QPOs in the peculiar X-ray binary Circinus X-1. At eleven different epochs we observed two simultaneous kHz QPOs with centroid frequencies of up to 225 and 500 Hz and significances of up to 6.3 and 5.5 for the lower and upper kHz QPO, respectively. The frequency range over which the twin kHz QPOs are seen is for the most part well below that of other sources, and extends down to centroid frequencies of 56 Hz and 230 Hz respectively for the lower and simultaneously observed upper kHz QPO. The strongly variable QPO frequencies and their observed correlations clearly indicate that the twin peaks are the kHz QPOs such as typically seen from low-magnetic field neutron stars, and not black-hole high-frequency QPOs. This confirms that Cir X-1 is a neutron star, as suspected since the detection of Type-I X-ray bursts from the field of the source 20 years ago. The kHz QPO peak separation varies over the largest range yet seen, 175–340 Hz, and increases as a function of kHz QPO frequency. This is contrary to what has been observed in other sources but in good agreement with predictions of the relativistic precession model and Alfvén wave models at these low QPO frequencies. Current beat-frequency models would require further modification in order to accommodate this. A total of 67 observations showed only a lower kHz QPO; this QPO can be followed down all the way to a centroid frequency of 12 Hz (0.5). Two observations showed only an upper kHz QPO near 450 Hz. In addition, a strong low-frequency quasi-periodic oscillation (LF QPO) is seen in the 1–30 Hz range, as well as two components above and below this QPO. The frequency-frequency correlations between the kHz QPOs and the LF QPO are in good agreement with those found previously in Z sources, confirming that Cir X-1 may be a peculiar Z source, and extend these correlations to frequencies a factor 1.5–2.3 lower. We suggest that the low frequency range over which the kHz QPOs occur in Cir X-1 and to a lesser extent in (other) Z sources, might be due to a stronger radial accretion flow relative to the disk flow than in other kHz QPO sources, possibly related to the nature of the companion star.
1 Introduction
Low-mass X-ray binaries (LMXBs) often exhibit quasi-periodic oscillations (QPOs) in their X-ray flux (van der Klis 2006 for a review). The properties of these QPOs vary as a function of the location of the source in the track it traces out in X-ray color-color and hardness-intensity diagrams (CD and HIDs). Among the low magnetic-field neutron-star systems, systematic differences in the CD/HID tracks and in the associated rapid X-ray variability allow to distinguish two subclasses: Z and atoll sources, named after the shapes of their tracks (Hasinger & van der Klis, 1989). Both in Z sources and in atoll sources, the QPO frequency tends to increase in the same direction as the mass accretion rate is inferred to be increasing, at least on short time scales (see van der Klis 2001).
In about 20 LMXBs containing a low-magnetic field neutron star, two kHz QPOs have been seen simultaneously (twin kHz QPOs) with a centroid frequency separation of a few hundred Hz that decreases typically by a few tens of Hz when the QPO frequencies themselves increase by hundreds of Hz (roughly, from 200 to 900 Hz and from 500 to 1200 Hz, respectively). If the spin frequency of the neutron star, , is known, then has always been found to be either roughly equal to , or to , depending on the source. The frequencies of the twin kHz QPOs (called the lower and the upper kHz QPO, or and , in order of increasing frequency) are tightly correlated to each other, following a relation that is the same across all sources (Psaltis et al., 1998; Psaltis, Belloni & van der Klis, 1999; van Straaten et al., 2005). Both kHz QPO frequencies also (e.g., Psaltis, Belloni & van der Klis 1999) correlate with the frequencies of other variability components such as, in atoll sources, the low-frequency quasi-periodic oscillation (LF QPO; a sharp QPO peak in the 1–60 Hz range designated – cf. van Straaten et al. 2005 for some of the terminology) and the break component (a broad noise component with a frequency in the 0.01–20 Hz range designated ). The components most similar to these in the Z sources (and suspected to be physically the same) are the horizontal branch oscillation (HBO) and the low frequency noise (LFN), but the correlations of the frequencies of these components with those of the kHz QPOs differ somewhat (van Straaten et al., 2003).
Twin kHz QPOs are a neutron-star signature. In some LMXBs containing a black hole, high-frequency quasi-periodic oscillations (HF QPOs) have been observed. These are different from kHz QPOs: they tend to recur near fixed frequencies that are different in each source, and when more than one HF QPO occurs in the same source the QPOs usually appear at different times and at frequencies often roughly consistent with a fixed 2:3 ratio (Strohmayer, 2001; McClintock & Remillard, 2006).
Numerous models have been proposed to explain the nature of the kHz QPOs and describe their correlations. Some refer to a blob orbiting inside the accretion disk, either self-luminous or scattering the X-rays, or producing a hot spot on the neutron-star surface by the infall of matter from the blob while it is orbiting at the inner edge of the disk. These models produce a rotating pattern of radiation causing a so-called ’beaming’ modulation of the observed flux. The orbital frequency of a particle in an equatorial circular orbit around a point mass with mass and angular momentum (approximating the spacetime metric around the neutron star by Kerr spacetime) is , where and . The corresponding radial epicyclic frequency in a slightly eccentric orbit and for negligible frame dragging () is .
In the relativistic precession model (Stella & Vietri, 1999) as well as in the sonic-point spin-resonance model (Lamb & Miller, 2003) the upper kHz QPO is identified with . The lower kHz QPO is interpreted in the first case as due to the periastron precession frequency , and in the second case as a beat between at the sonic radius and the spin frequency (at approximately or depending on conditions at the spin-resonance radius where the beat emission is generated). Kluźniak & Abramowicz (2001, 2003) suggest that QPOs occurring in neutron stars are similar to those seen in black holes and result from resonance frequencies in the disk, but in neutron stars are tuned away from the fixed frequencies seen in black holes by additional physical effects (but see also Belloni et al. 2005). Models related to orbital motion are in general more predictive of the frequencies of the QPOs than of their amplitudes and coherences, as constructing a model for the modulation mechanism or describing the damping of the oscillations is more difficult than explaining these frequencies as a (combination of) general-relativistic orbital and epicyclic frequencies. A maximum frequency according to such models would be the orbital frequency at the innermost (marginally) stable circular orbit (ISCO) of the compact object for Kerr spacetime or, under certain conditions, the orbital frequency at the marginally bound orbital radius. Both these frequencies scale inversely with mass. For an extensive review on timing features of LMXBs and QPO models see van der Klis (2006).
Circinus X-1 is a galactic X-ray source located in the galactic plane at a distance that has variously been reported to lie in the range 4–12 kpc (Goss & Mebold, 1977; Glass, 1994; Jonker & Nelemans, 2004; Iaria et al., 2005). The system is thought to have a 17-d highly eccentric () orbit leading to periodically enhanced mass transfer at periastron (Murdin et al., 1980). From optical and infrared observations a sub-giant companion star of 3–5 was suggested (Johnston et al., 1999). More recently, Jonker et al. (2006) found evidence for supergiant characteristics in the optical spectrum of the system which might indicate an even higher companion mass. So, Cir X-1 is formally a high-mass X-ray binary. However, its X-ray phenomenology corresponds to that of a low magnetic-field compact object such as more commonly found in LMXBs. The strong radio emission (see, e.g., Fender et al., 2005), highly relativistic jets (Fender et al., 2004), hard X-ray emission (Iaria et al., 2001; Ding et al., 2003) and very strong X-ray variability (Jones et al., 1974; Samimi et al., 1979; Oosterbroek et al., 1995), resemble properties generally more typical of black holes. However, type-I X-ray bursts seen in 1986 from the field of the source and most likely originating in Cir X-1 itself (Tennant et al., 1986) classified it as a likely neutron star, with later spectroscopic analysis (Maisack et al., 1995; Done & Gierliński, 2003) supporting this at least at a phenomenological level. No bursts were reported from the source since 1986. Low-frequency noise, a clear low-frequency QPO and a broad feature at 100–200 Hz were seen with EXOSAT (Tennant, 1987). At low flux levels Cir X-1 exhibited atoll-source behavior (Oosterbroek et al., 1995) including strong band-limited noise, while subsequent observations at higher flux on occasion, and in addition to a wide variety of non-Z-like patterns, showed a Z-source-like track in the HID (Shirey et al., 1999). On the horizontal branch of this track, Shirey et al. (1996, 1998) found the LF QPO to move between 1.3 Hz and 32 Hz, in strong correlation with the break frequency at lower frequencies and the frequency of the broad high-frequency feature, now seen to range from 20–100 Hz. Psaltis, Belloni & van der Klis (1999) interpreted this broad peak as a low-frequency, low-coherence version of the lower kHz QPO as seen in Z and atoll sources. They showed that its frequency fits on the relation seen in those sources between the frequencies of and , extending it down to an centroid frequency of 20 Hz and, interestingly, providing a link with black-hole phenomenology. No twin kHz QPOs were reported from Cir X-1 up to now.
In this paper, we concentrate on the high-frequency part of the power spectra of Cir X-1 and perform an extensive survey for kHz QPOs. We find that twin kHz QPOs do in fact occur in Cir X-1. We describe our methodology in Section 2, present our results in Section 3 and comment on consequences for phenomenological systematics and theoretical models in Section 4.
2 Observations and Analysis
We used the data on Cir X-1 obtained with the proportional counter array (PCA; Jahoda et al., 2006) on board the Rossi X-ray Timing Explorer (RXTE) from March 1996 till January 2005 listed in Table 1. This includes all data publicly available in February 2005 as well as the then proprietary data set 90025, and comprises about 2 Ms of data distributed over 21 RXTE programs in 9 RXTE Observing Cycles: a total of 497 RXTE observations each with typically 3–6 ks of useful data and identified by a unique RXTE Observation ID.
The source was observed with 13 different combinations of instrumental modes covering the full energy range (channels 0–249, effective energy range 3–60 keV), and one more starting from channel 8 (3.7 keV) with which 21 observations were taken in 2003 (Cycle 8), when the intensity was low (below 0.4 Crab) and from which we eventually did not report any power spectra. We divided each observation into continuous time segments of 16, 64, 128 or 256 s, depending on the time resolution such that they contained 220 points. The count rates from all of the PCA’s available Proportional Counter Units (PCUs) were summed and Fourier-transformed. The resulting power spectra were averaged to give one average power spectrum per observation.
Most of our power spectra (378 of the 497) either showed no appreciable broad-band power at all or only a broad plateau-like feature at low frequency ( Hz). These power spectra were inspected visually for high-frequency features, if necessary followed by fitting using the procedures described below in order to determine the significance of any features. Taking into account the number of trials inherent in this search, no significant high-frequency features were found. The most significant feature (at 721 Hz and with 8.5) had a single-trial significance of 3.8. More complex power spectra, containing a significant and narrow (1) LF QPO in the 1–50 Hz range and at least one more feature described well by a Lorentzian, were seen in the remaining observations. We performed a full analysis of these 119 power spectra using the multi-Lorentzian fit method described below.
Since this work concentrates on kHz QPOs, careful subtraction of the deadtime-modified Poisson-noise power is required. A full description of our approach is provided in Appendix A. We used the expression proposed by Zhang et al. (1995, 1996) to describe the Poisson spectrum, but with values of the event deadtime and VLE window of and based on direct fits of that model to our data. As explained in the Appendix, this method is slightly more conservative with respect to the significances of the twin kHz QPOs than the other methods used in previous work, and provides a consistent estimate of the deadtime-modified Poisson-noise power spectrum throughout our data.
After subtracting the noise, we renormalized the power spectra to source squared fractional rms amplitude and fitted them using standard chi-squared methods. We used a multi-Lorentzian fit function in the (, ) representation (Belloni et al., 2002), where the so-called characteristic frequency of the Lorentzian is given by with the Lorentzian’s centroid frequency and its HWHM, and where its quality factor is . A power law was added at low frequencies when needed. The fits were made without any reference to expected features, and include all significant (; all significances quoted herein are single-trial) Lorentzians that could be fitted. All errors quoted are 1- single-parameter ().
To recover the Lorentzian centroid frequency , we used the expression . Since all Lorentzians for which we applied this conversion are rather sharp-peaked (), the errors computed for are approximately the same as those for . For the twin kHz QPOs, we explicitly re-estimated the errors by refitting in centroid-frequency representation, and typically found the errors to differ by 5% (usually 1 Hz), and negligible differences in the parameters themselves. For the other fits we adopted the errors also for the centroid frequencies. In the following, all frequencies quoted are in terms of the characteristic frequency unless otherwise noted. Subscripts denote the variability component ( for upper kHz QPO, etc.); centroid frequencies are denoted with superscript as follows: .
We used the 16-s time-resolution Standard-2 mode to calculate X-ray colors as in Altamirano et al. (2005) but with bands as defined by Shirey et al. (1999). Dropouts were removed, background was subtracted and deadtime corrections were made. All active PCUs were used for this analysis. The energy bands chosen for colors and intensity are given in the captions to Figs. 3 and 4 – energy channels were interpolated to approximate the exact same bands in all data sets. In order to correct for the gain changes as well as the differences in effective area between the PCUs, we normalized all color and intensity estimates to the corresponding Crab values (Kuulkers at al., 1994; van Straaten et al., 2003) that are close in time but in the same RXTE gain epoch.
3 Results
In 80 of the 119 fitted power spectra we found a QPO which we interpret as a kHz QPO (see below). In 7 of these we found a significant () second kHz QPO. A second kHz QPO with a significance between 2.5 and 3 was found in 4 more cases. We discuss whether these are real or not in Section 3.1.
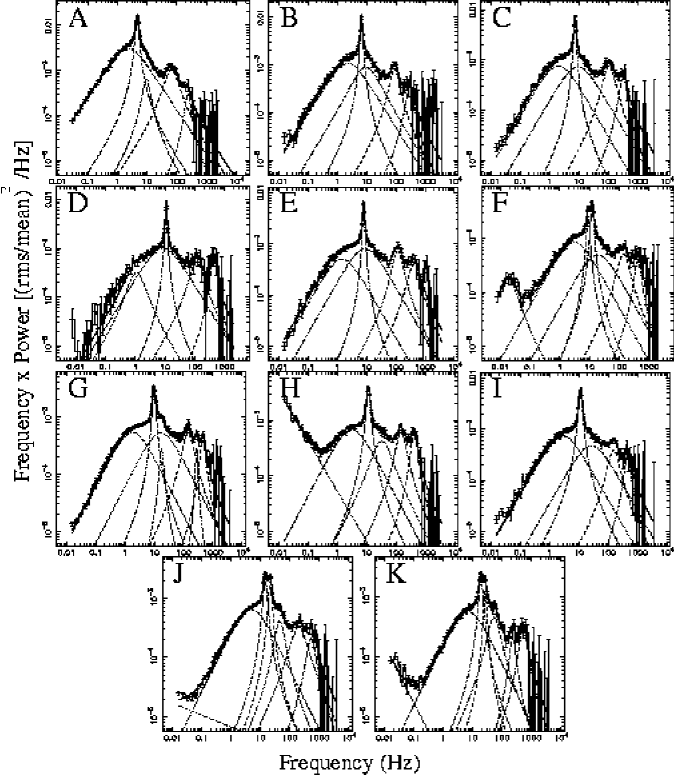
The best power spectrum exhibiting twin kHz QPOs (data set H; observation 20094-01-01-01) is shown in Fig. 1. Twin kHz QPOs, 6.3 and 5.5 significant, are clearly seen near 140 and 460 Hz, respectively, as well as a strong LF QPO near 10 Hz, broad noise, and a power law at low frequency. The power spectra of all 11 observations with twin kHz QPOs are shown in Fig. 2 together with all fitted components. The prominent narrow feature peaking somewhere between 1 and 30 Hz is the LF QPO . It is seen in all 119 observations, sometimes as a double peak, which may be due to averaging over a moving feature. When due to this it was necessary to fit the LF QPO with two Lorentzians, we adopted the frequency of the most significant (usually, the lower-frequency) of the two as that of the LF QPO in further analysis. A low-frequency noise or break component was seen below in all but three cases while an additional component was detected at or above in more than half (78) of the power spectra. The nature of this component is further discussed in Section 3.3. Power laws were needed in only nine cases, and always only produced appreciable power below 1 Hz.
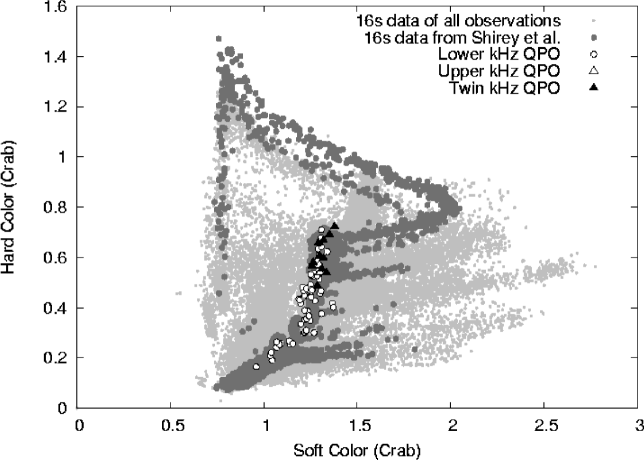
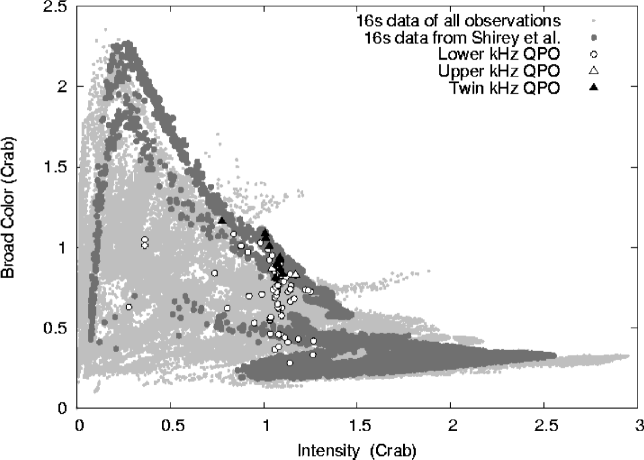
The average X-ray colors of each observation with kHz QPOs are plotted on top of a 16-s time-resolution color-color diagram (CD) of all Cir X-1 data in Fig. 3. The observations with twin kHz QPOs and single kHz QPOs are set out by different symbols, as are the 16-s data already reported by Shirey et al. (1999). Twin and single kHz QPOs occur over a range of colors; the frequency of the lower kHz QPO tends to increase towards both lower and higher colors, but the correlations are weak. A hardness-intensity diagram following the same conventions is provided in Fig. 4. Most of the observations showing twin kHz QPOs were within a quite narrow band of intensities between 2545 and 2770 c/s/PCU, or about 1.0–1.1 Crab (except data set H at 1991 c/s/PCU or 0.8 Crab, which is also the overall hardest kHz QPO observation; the uppermost black triangle in Figs. 3 and 4). Presumably related to this, we find no clear correlation between kHz QPO frequency and intensity, although there is some weak evidence for parallel tracks in frequency vs. intensity, as has been seen in other sources. Most kHz QPOs, and all twins, are found well above the Z tracks identified by Shirey et al. (1999) which are confined to Crab-normalized broad color , i.e., most QPOs are associated with a considerably harder overall spectrum than that in the Z tracks. Fig. 5 shows a long term light curve of the source where each data point is the average of one observation. It can be clearly seen that most of the observations with kHz QPOs, and all with twin kHz QPOs, occurred at relatively early epochs, when the average source flux was higher than later in time, and that most cluster near intensities of 1 Crab.
To investigate the relations between the frequencies of the power-spectral components we plot the characteristic frequency of all features vs. in Fig. 6. The points can be easily separated into five groups of correlated frequencies. The LF QPO (small filled circles) is the most significant feature in our power spectra. A dispersed group of points below the LF QPO (triangles) corresponds to the low-frequency noise or break component (see also Section 3.3). At a frequency between 1 and 3 times that of the LF QPO we see a group of points associated with a component (open circles) that is usually dominated by a harmonic to the LF QPO (see Section 3.3). Parallel to that and at somewhat higher frequencies there is an almost continuous series of points extending from 18 up to 380 Hz (large filed circles). Yet another group of points above these has similar characteristics, although less dense, and extends from 235 up to 580 Hz (squares). From the high frequencies to which they extend, and their frequency variability over more than an order of magnitude, we identify these latter two components as kHz QPOs. We conclude that the highest-frequency group (squares) corresponds to the upper kHz QPO () and the group below that (large filled circles) to the lower kHz QPO (). These components coincide with the lower kHz QPOs as tentatively identified by Psaltis, Belloni & van der Klis (1999, see Section 1), and are found here over a wider frequency range. Note that in accordance with previous work we use the term kHz QPOs for components that can have high frequencies, but are also seen down to a characteristic frequency as low as (in our case) 18 Hz.
3.1 Twin kHz QPOs
As noted in Section 3, Fig. 2 shows the power spectra of the observations exhibiting twin kHz QPOs that were both significant at 3 (up to 17 for and up to 5.5 for ), as well as those with a significance 3 for one and 2.5 for the other. From Figs. 3 and 4 we see that the points of the 2.5–3 group fall right among the 3 group. The QPO frequencies of the two groups are also in the same range, and the frequency correlations seem to hold for both groups of points (Fig. 6). We conclude that it is safe to include the four observations with a kHz QPO between 2.5 and 3 in our sample of twin kHz QPOs; of course they have somewhat larger statistical error bars. Weak features above visible in Fig. 2 (e.g. in power spectrum E), and in between and (e.g. in power spectrum G) are not significant. We remain thus with 11 twin kHz QPOs. Table 2 lists their best-fit centroid frequencies, coherences and fractional rms amplitudes, as well as the peak centroid separation and the centroid frequency ratio. Note that tends to increase with QPO frequency and that the frequency ratio is inconsistent with 2:3. This is further discussed in Section 4.
3.2 Single kHz QPOs
Apart from the 11 twin kHz QPOs we measured an additional 69 single ones. Their frequency shows a strong correlation with that of . As can be seen in Fig. 6, these single kHz QPOs are nearly all consistent with being lower kHz QPOs: the 11 lower kHz QPOs among the twin peaks are clearly part of the same group of points. Only the two highest-frequency single kHz QPO points (20094-01-01-00 and 20094-01-01-000) seem to diverge from this correlation (particularly in terms of centroid frequencies, not shown). Since these points seem instead to extend the relation for the upper kHz QPOs, and because a less significant feature is present in those power spectra at frequencies consistent with a lower kHz QPO, we classify these two QPOs as , with remaining formally undetected due to statistics. This is consistent with the decrease in lower kHz QPO amplitude with increasing frequency (Fig. 7). The best-fit power law for the lower kHz QPO points is Hz, with a of 17.8 for 76 degrees of freedom, clearly indicating the existence of non-statistical scatter in these frequencies; here and below the error bars quoted for power-law fit parameters were multiplied by to take account of this scatter. For , we similarly find Hz; for 11 degrees of freedom.
The quality factors of the kHz QPOs ranged up to 6 for and up to 2.5 for but were more often around 1. No clear trend was detected in the values as a function of QPO frequency. Averaging over a moving feature may in some cases have broadened the peak somewhat, but experiments with data subsets show this effect to be minor down to accessible time scales (5000 s). Only in two cases evidence was detected of a deviation from the standard Lorentzian profile strong enough to allow a significant additional component to be fitted. We used the results of a single Lorentzian fit also in these two cases.
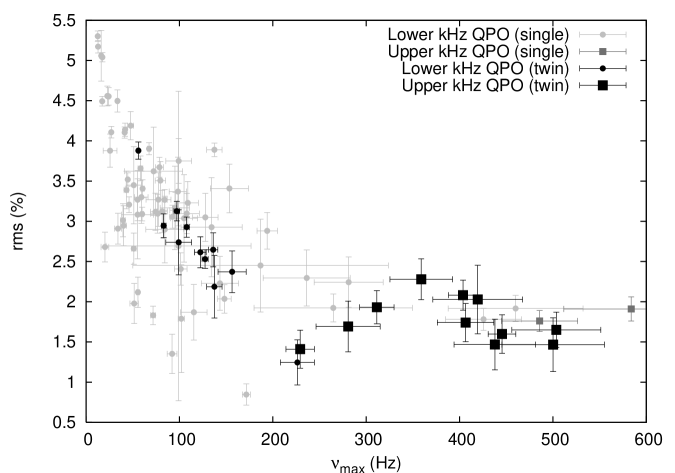
Fig. 7 shows the fractional rms amplitude of each kHz QPO as a function of its own characteristic frequency. Some general trends are seen, where the rms of monotonically decreases (but more rapidly below a of 200 Hz than above that frequency) and the rms of varies much less, but may first rise and then fall again. This is somewhat reminiscent of the amplitude variation of the kHz QPOs in the Z source GX 51 (Jonker et al., 2002) and different from what has been observed in a number of atoll sources (Méndez et al., 2001). Both QPOs appear to vary in amplitude gradually and tend to become undetectable when they fall below an rms amplitude of 1.5%.
3.3 Other power spectral components
The lower frequency power spectral components are not the prime objective of this work, but we briefly report here on a number of immediate findings concerning these components that emerge from our analysis.
The component above often is rather coherent (with Q up to 8), and when it is (for ), it has a centroid frequency twice that of the LF QPO (Fig. 8) to good precision, indicating that mostly this component is the harmonic of the LF QPO. However, when it is less coherent the component often appears to be dominated by broad structure around or just above the LF QPO. It can then have frequencies down to a characteristic frequency as low as that of (see Fig. 6), and to well below that component in terms of centroid frequency (see Fig. 8).
Although an increase in the break frequency of the low-frequency noise with is evident in Fig. 6, the scatter is large. The power spectra at low frequencies may be more complex than allowed in our fits, which mainly concentrate on kHz QPOs. Possibly, two parallel groups of points are present, indicating two break frequency components as observed in other sources ( and ; cf. van Straaten et al., 2003). This seems for example to be the case in power spectrum F. More work is needed to resolve this issue.
4 Discussion
We have discovered twin kHz QPOs in Cir X-1 in 11 separate RXTE/PCA observations. Among these 11 observations the centroid frequency of the upper kHz QPO ranged from 22918 to 50551 Hz and that of the lower kHz QPO from 56.11.3 to 22618 Hz. The lowest-frequency twin kHz QPOs observed so far, in the accreting millisecond pulsar XTE J1807294, had 127 and 353 Hz centroid frequencies (Linares et al., 2005); our Cir X-1 data extend to well below this. A total of 80 observations showed at least one kHz QPO, with centroid frequencies extending down to as low as 12.5 Hz. The centroid frequency separation of the twin kHz QPOs varies by a factor of two, spanning a range, 17318 to 34064 Hz, similar to that covered by all previous twin kHz QPO detections in other sources taken together.
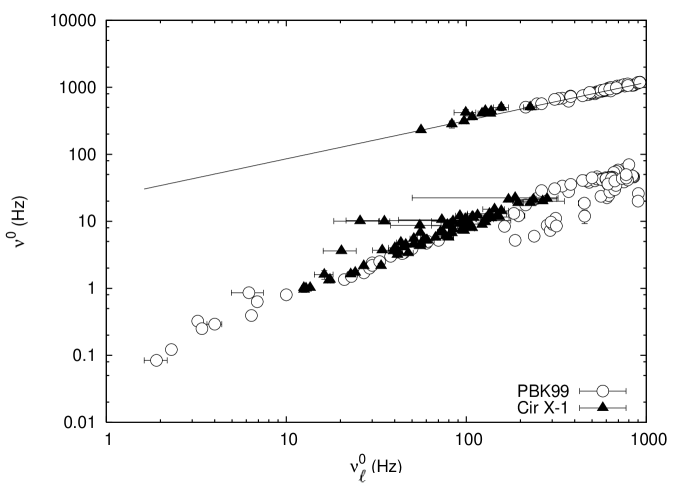
In order to further compare the kHz QPOs in Cir X-1 with those in other sources we examine the locus of these QPOs in two frequency-frequency correlation diagrams that have been considered in previous works. In Fig. 9 we plot and vs. in the Psaltis, Belloni & van der Klis (1999) diagram containing data for both neutron stars and black holes. The lower kHz QPO points of Cir X-1 had previously been used by these authors to suggest a link between the lower kHz QPO in Z and atoll sources above a of 200 Hz, and a broad feature in black holes and weak X-ray burst sources below a of 10 Hz (both plotted in Fig. 9 using open circles). This latter broad feature was dubbed by van Straaten et al. (2005), who based on the relations of amplitude and coherence with frequency, and on systematic shifts in the frequency-frequency correlations observed in some millisecond pulsars questioned the identification with (van Straaten et al., 2003, 2005). Our identification of the twin kHz QPOs in Cir X-1 confirms that at least in Cir X-1 this feature is indeed the lower kHz QPO as proposed by Psaltis, Belloni & van der Klis (1999). Our newly discovered upper kHz QPO points smoothly extend the vs. relation to frequencies a factor 4 lower than originally reported (Psaltis, Belloni & van der Klis 1999; upper track in Fig. 9). The best-fit power law to all points including Cir X-1 is Hz ( for 82 degrees of freedom). As can be seen in Fig. 9, this relation provides an excellent match to Cir X-1 as well as to the data on the other sources.
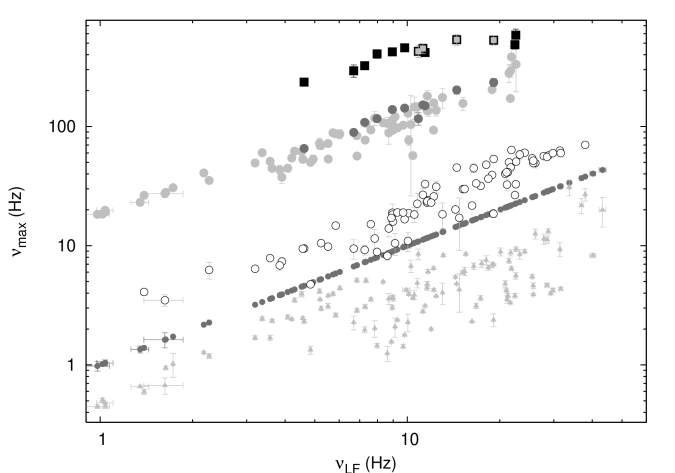
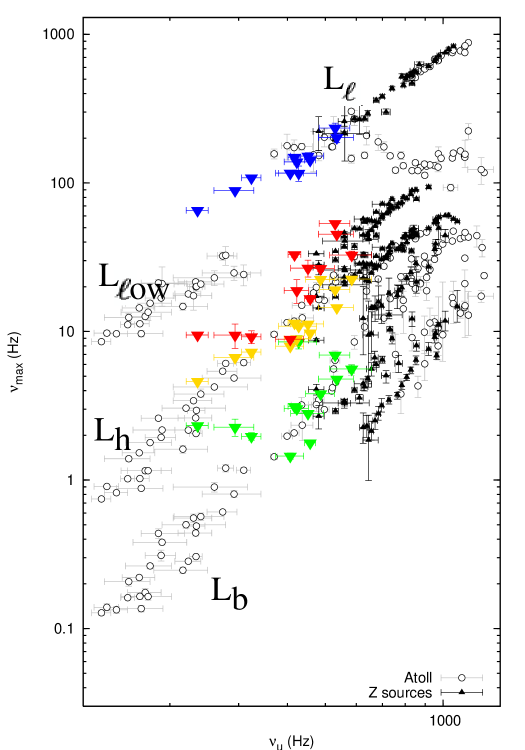
In Fig. 10 we plot the characteristic frequencies of all other power spectral components in the 11 twin kHz QPO power spectra vs. in a diagram originating with van Straaten et al. (2002) containing data for atoll sources, weak burst sources and Z sources. In this diagram it can be seen that the vs. relation, as smoothly extended with our Cir X-1 points, does not connect to the vs. relation, supporting van Straaten et al.’s suspicion that and may be different components. Further work on the other sources contributing to these correlations is required to definitively resolve this issue; this is beyond the scope of this paper.
The large range over which the twin kHz QPO frequencies vary, the strong deviation from a 2:3 ratio and the frequent simultaneous appearance of the two peaks are very different from what is seen in black hole high-frequency QPOs. Instead, the way in which the kHz QPO frequencies correlate to each other and to the frequencies of other variability components is consistent with what is seen in neutron stars. These observations therefore support the identification of Cir X-1 as a neutron star (cf. Section 1). In Fig. 10 it can be seen that the LF QPO in Cir X-1 fits well on the track in this diagram, but the low-frequency noise or break component does not match well to the track. Cir X-1 shares both these characteristics with the Z sources (van Straaten et al., 2003), giving further support to the proposal of Shirey et al. (1999) that Cir X-1 is a (peculiar) Z source. The low coherence, relative weakness, and low frequency range of our twin kHz QPOs as well as the detection of a LF QPO harmonic (such as also commonly seen in Z source HBOs) are also in accordance with a Z source classification. However, the band-limited noise can be much stronger (Oosterbroek et al., 1995), and the kHz QPOs can reach much lower frequencies in Cir X-1 than has been observed in any (other) Z source.
The extended range of kHz QPO frequencies in Cir X-1 allows unique tests of theoretical models. Perhaps most strikingly, the increase in the frequency separation with upper kHz QPO centroid frequency , which has only been observed previously, somewhat marginally, in GX 17+2 (Homan et al., 2002) and on a single occasion in 4U 172834 (Migliari et al., 2003), is in accordance with a prediction of the relativistic precession model (Stella & Vietri, 1999) for the behavior of at low QPO frequency.
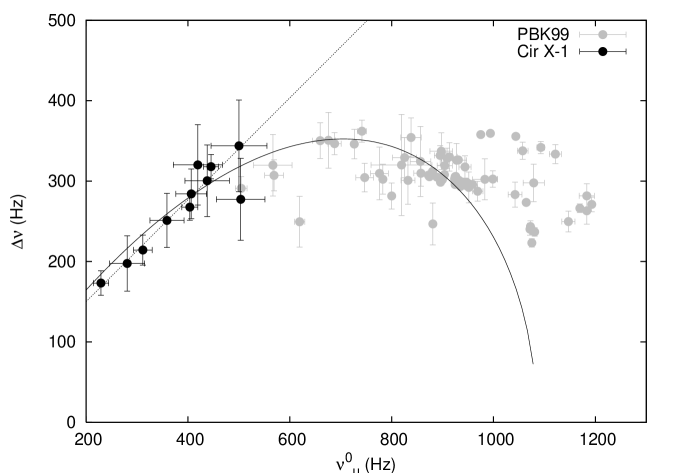
In Fig. 11 we show a plot of the centroid frequency separation vs. . From an F-test for additional term we find that in our data, is inconsistent with being constant at the 5.2 level; a linear fit yields a line with slope 0.60.1. The relation predicted by the precession model for negligible frame dragging, describes our data points well (drawn curve). The best fit to just our Cir X-1 points () gives a mass for the neutron star of . This is high, but agrees with inferences drawn from this model for other sources (Stella & Vietri, 1999), and indeed the best-fit curve passes through the cloud of scattered points corresponding to all other sources (which of course can be expected to have different masses). Note, however, that as already discussed by Stella & Vietri (1999), for some other individual sources no exact match to this model is possible without introducing additional physical assumptions. We further note, that Alfvén wave oscillation models (Zhang, 2004; Rezania & Samson, 2005; Zhang et al., 2005) which also predict to increase at low , can fit our data as well.
As is evident from the data presented in the rightmost column of Table 2, while the twin kHz QPO frequencies are clearly inconsistent with a 2:3 ratio, a 1:3 ratio is closer, although still formally inconsistent with the data at 99% confidence. A 1:3 ratio corresponds to one of the resonances that have been considered by Kluźniak & Abramowicz (2003). However, since that ratio would arise from a combination frequency of the main 2:3 resonance, the weakness of the main resonance (which is not significantly detected) would in such an interpretation remain unexplained. Beat-frequency models, based on a constant frequency separation related to the spin frequency, would have difficulties explaining the factor 2 change in frequency separation of the kHz QPOs of Cir X-1. The modified beat-frequency model proposed by Lamb & Miller (2001) to explain the modest decrease of with QPO frequency previously observed in a number of sources would need further modification to explain the considerable increase that we observe instead. The range of upper kHz QPO frequencies we observe (229–505 Hz) is nearly entirely below that expected in the sonic-point beat-frequency model (500–1200 Hz; Miller et al. 1998).
Although our discovery of twin kHz QPOs in Cir X-1, as well as the observed frequency-frequency correlations, put this system on a footing with the neutron-star LMXBs, the fact that frequency range over which the upper kHz QPOs are observed is mostly well below that of other sources further confirms the exceptional nature of the source. These low frequencies might be taken to indicate the presence of a massive neutron star, if for example the upper kHz QPO would derive from the orbital frequency at some radius set by general relativity, scaling like . However, when taken at face value the fact that the observed frequencies are strongly variable makes this interpretation unlikely. The possibility remains that the highest kHz QPO frequencies in a source derive through general relativity from , and the observed range of frequencies in turn derives from this maximum.
Most proposed models interpret the strong variations of the frequencies as due to variations in the inner radius of the Keplerian disk flow. This radius could be set by a number of different mechanisms, such as electromagnetic stresses (in which case the inner radius would be the radius of the magnetosphere), or alternatively radiative stresses (radial radiation force and radiation drag on the accreting matter; Miller et al. 1998). Within the framework of such ideas the low kHz QPO frequencies in Cir X-1 would then imply a relatively stronger magnetic field for the neutron star, or alternatively a larger ratio of radiation flux density to matter density at the inner disk edge. In the description proposed by van der Klis (2001) for the kHz QPO ’parallel tracks’ phenomenon, relatively larger radiative stresses might occur if a larger fraction of the accretion takes place not through the (thin) disk, but in a more radial inflow, leading to relatively more radiation, and hence more radiative stress, being produced at the inner disk edge per gram of accreting disk material. The existence of such a stronger radial inflow might possibly be related to the unusual systemic characteristics of Cir X-1, such as the periodic episodes of rapid mass transfer and/or the large companion mass and likely, radius.
It is interesting to note, that a tendency towards relatively low kHz QPO frequencies is already known to be one of the characteristics distinguishing Z sources from other neutron star LMXBs. As noted above, Cir X-1 shares several more characteristics with the Z sources. So, Cir X-1 may possess the same physical property that makes Z sources stand out, but more extreme. If that property would be a stronger magnetic field, as has been discussed before (e.g., Psaltis et al., 1995), then additional ingredients (such as smearing of rapid variability by scattering in material surrounding the neutron star) are required to explain why no coherent pulsations are observed. If instead a stronger (radial flow / disk flow) ratio causes the Z-source phenomenon (possibly, like in Cir X-1, related to systemic characteristics such as a larger companion radius), then the radiative transfer of the emerging radiation through this inflow may be what causes the spectral effects (the Z track), and the larger inner disk radius what causes some of the timing effects (lower kHz QPO frequencies) that set these sources apart.
References
- Altamirano et al. (2005) Altamirano D., van der Klis M., Mèndez M., Migliar S., Jonker P.G., Tiengo A., Zhang W., 2005, ApJ, 633, 358, astro-ph/0507097
- Belloni et al. (2005) Belloni T., Mèndez M., Homan J., 2005, A&A, 437, 209, astro-ph/0501186
- Belloni et al. (2002) Belloni T., Psaltis D., van der Klis, 2002, ApJ, 572, 392, astro-ph/0202213
- Fender et al. (2005) Fender R., Tzioumis T., Tudose V., 2005, ATel, 563, 1
- Fender et al. (2004) Fender R., Wu K., Johnston H., Tzioumis T., Jonker P., Spencer R., van der Klis M., 2004, Nature 427, 222, astro-ph/0401290
- Ding et al. (2003) Ding, G. Q., Qu, J. L., & Li, T. P. 2003, ApJ, 596, L219, astro-ph/0309173
- Done & Gierliński (2003) Gierliński & Done, 2003, MNRAS, 342, 1041, astro-ph/0211206
- Glass (1994) Glass I.S, 1994, MNRAS, 268, 742
- Goss & Mebold (1977) Goss W.M. & Mebold U., 1977, MNRAS, 181, 255
- Homan et al. (2002) Homan, J., van der Klis, M., Jonker, P. G., Wijnands, R., Kuulkers, E., Méndez, M., & Lewin, W. H. G. 2002, ApJ, 568, 878, astro-ph/0104323
- Hasinger & van der Klis (1989) Hasinger, G. & van der Klis, M., 1989, A&A, 225, 79
- Iaria et al. (2001) Iaria, R., Burderi, L., Di Salvo, T., La Barbera, A., & Robba, N. R. 2001, ApJ, 547, 412, astro-ph/0009183
- Iaria et al. (2005) Iaria R., Spanó M., Di Salvo T., Robba N.R., Burderi L., Fender R., van der Klis M., Frontera F., 2005 ApJ, 619, 503, astro-ph/0410259
- Jahoda et al. (2006) Jahoda, K., Markwardt, C. B., Radeva, Y., Rots, A. H., Stark, M. J., Swank, J. H., Strohmayer, T. E., & Zhang, W. 2006, ApJS, 163, 401, astro-ph/0511531
- Johnston et al. (1999) Johnston H.M., Fender R., Kinwah W., 1999, MNRAS, 308, 415, astro-ph/9904112
- Jones et al. (1974) Jones C., Giacconi R., Forman W., Tananbaum H., 1974, ApJ, 191, 71
- Jonker et al. (2002) Jonker P.G., van der Klis M., Homan J., Méndez M., Lewin W.H.G., Wijnands R., Zhang W., 2002, MNRAS, 333, 665, astro-ph/0202420
- Jonker & Nelemans (2004) Jonker, P. G., & Nelemans, G. 2004, MNRAS, 354, 355, astro-ph/0407168
- Jonker et al. (2006) Jonker, P. G., Nelemans, G., & Bassa, C. G. 2006, ArXiv Astrophysics e-prints, arXiv:astro-ph/0605497
- Klein-Wolt et al. (2004) Klein-Wolt M., Homan J., van der Klis M., 2004, NuPhS, 132, 381
- Kluźniak & Abramowicz (2001) Kluźniak W. & Abramowicz M., 2001, astro-ph/0105057
- Kluźniak & Abramowicz (2003) Kluźniak W. & Abramowicz M., 2003, astro-ph/0304345
- Kuulkers at al. (1994) Kuulkers E., van der Klis M., Oosterbroek T., Asai K., Dotai T., van Paradijs J., Lewin W.H.G., 1994, A&A, 289, 795
- Lamb & Miller (2001) Lamb, F. K., & Miller, M. C. 2001, ApJ, 554, 1210, astro-ph/0007460
- Lamb & Miller (2003) Lamb F.K. & Miller M.C., 2003, astro-ph/0308179
- Linares et al. (2005) Linares, M., van der Klis, M., Altamirano, D., & Markwardt, C. B. 2005, ApJ, 634, 1250, astro-ph/0509011
- Maisack et al. (1995) Maisack M., Staubert R., Balucinska-Church M., Skinner G., Doebereiner S., Englhauser J., Aref’ev V. A., Efremov V. V., Sunyaev R. A., 1995, AdSpR, 16, 91
- McClintock & Remillard (2006) McClintock J.E., Remillard R.A., 2006, in Compact Stellar X-ray Sources, W.H.G. Lewin and M. van der Klis (eds.), Cambridge University Press, p. 157
- Méndez et al. (2001) Méndez, M., van der Klis, M., & Ford, E. C. 2001, ApJ, 561, 1016, astro-ph/0006245
- Migliari et al. (2003) Migliari, S., van der Klis, M., & Fender, R. P. 2003, MNRAS, 345, L35, astro-ph/0309288
- Miller et al. (1998) Miller M.C., Lamb F.K., Psaltis D., 1998, ApJ, 508, 791, astro-ph/9609157
- Murdin et al. (1980) Murdin, P., Jauncey, D. L., Lerche, I., Nicolson, G. D., Kaluzienski, L. J., Holt, S. S., & Haynes, R. F. 1980, A&A, 87, 292
- Oosterbroek et al. (1995) Oosterbroek T., van der Klis M., Kuulkers E., van Paradijs J., Lewin W.G.H., 1995, A&A, 297, 141
- Psaltis et al. (1995) Psaltis, D., Lamb, F. K., & Miller, G. S. 1995, ApJ, 454, L137, astro-ph/9606096
- Psaltis et al. (1998) Psaltis, D., et al. 1998, ApJ, 501, L95, astro-ph/9805084
- Psaltis, Belloni & van der Klis (1999) Psaltis D., Belloni T. & van der Klis M., 1999, ApJ, 520, 262, astro-ph/9902013
- Revnivtsev et al. (2000) Revnivtsev M.,Gilfanov M.,Churazov E., 2000, A&A, 363, 1013, astro-ph/0007092
- Rezania & Samson (2005) Rezania, V., & Samson, J. C. 2005, A&A, 436, 999, astro-ph/0503011
- Samimi et al. (1979) Samimi J., Share G.H., Wood K., Yentis D., Meekins J., Evans W.D., Shulman S., Byram E.T., Chubb T.A., Friedman H., 1979, Nature, 279, 434
- Shirey et al. (1999) Shirey R. E., Bradt H.L., Levine A.L., 1999, ApJ 517, 472, astro-ph/9901003
- Shirey et al. (1996) Shirey R. E., Bradt H.L., Levine A.L., Morgan E.H., 1996, ApJ, 469, 21
- Shirey et al. (1998) Shirey R. E., Bradt H.L., Levine A.L., Morgan E.H., 1998, ApJ, 506, 374, astro-ph/9803278
- Stella & Vietri (1999) Stella L. & Vietri M., 1999, Phys.Rev.L, 82, 17, astro-ph/9803278
- Strohmayer (2001) Strohmayer, T.E., 2001, ApJ, 552, L49
- Tennant et al. (1986) Tennant A.F., Fabian A.C., Shafer R.A., 1986, MNRAS, 221, 27
- Tennant (1987) Tennant, A. F. 1987, MNRAS, 226, 971
- van der Klis (2006) van der Klis M., 2006, in Compact Stellar X-ray Sources, W.H.G. Lewin and M. van der Klis (eds.), Cambridge University Press, p. 39; astro-ph/0410551
- van der Klis (1997) van der Klis M., 1997, in Astronomical Time Series. ASSL, 218, 121
- van der Klis (2001) van der Klis, M., 2001, ApJ, 561, 943, astro-ph/0106291
- van Straaten et al. (2002) van Straaten, S., van der Klis, M., di Salvo, T., & Belloni, T. 2002, ApJ, 568, 912, astro-ph/0107562
- van Straaten et al. (2003) van Straaten S.,van der Klis M., Mendez M., 2003, ApJ, 596, 1155, astro-ph/0207646
- van Straaten et al. (2005) van Straaten S.,van der Klis M., Wijnands R., 2005, ApJ, 619, 455, astro-ph/0410505
- Wei (2006) Wei D., MIT senior thesis, in preparation
- Zhang et al. (1995) Zhang W., Jahoda K., Swank J.H., Morgan E.H., Giles A.B., 1995, ApJ, 449, 930
- Zhang et al. (1996) Zhang W., Morgan E.H., Jahoda K., Swank J.H., Strohmayer T.E., Jernigan G., Klein R.I., 1996, ApJ, 469, 29
- Zhang (2004) Zhang, C. 2004, A&A, 423, 401, astro-ph/0402028
- Zhang et al. (2005) Zhang, C. M., Kojima, Y., Yin, H. X., & Zhao, Y. H. 2005, ArXiv Astrophysics e-prints, arXiv:astro-ph/0502102
Appendix A The determination of the Poisson noise spectrum
For a high-frequency analysis an accurate description of the deadtime-modified Poisson noise power spectrum is required. In the RXTE/PCA this spectrum is mainly determined by the values of the event deadtime and the VLE-window111In our data only the 3rd VLE window setting appears (a.k.a. setting 2; 150 s) and for that reason this Appendix only refers to that setting. . The technical descriptions of RXTE give only approximate values for these parameters, =10 and =150 s, respectively (Zhang et al., 1996); values of 8.5s have also been used for (Revnivtsev et al. 2000, Klein-Wolt et al. 2004, Wei 2006), while a method using additional small shifts was introduced by Klein-Wolt et al. (2004) to compensate for deviation from the observations. Recently, a calibrated VLE window value of s was reported by Jahoda et al. (2006). Since these values could in principle vary and in some cases depend on source spectrum, and since the values mentioned above do not agree with our observations to high precision (see Fig. 12), we instead estimated the deadtime parameters directly, making good use of the large sample of data available for Cir X-1.
We used 84 representative RXTE observations of Cir X-1 distributed over all epochs and with count rates between 300 and 6000 c/s/PCU. No dependencies of the deadtime parameters on epoch or count rate were found. Observations with high time resolution were preferred but lower-resolution ones, as well as observations with extremely high resolution (Nyquist frequency 33 kHz) all gave consistent results. In order to avoid power contributions from known source variability components, we looked only at frequencies above 1.6 kHz (up to the Nyquist frequency). All observations used for this analysis covered the whole energy range (channels 0–249).
We used the function approximately describing the Poisson power spectrum according to Zhang et al. (1995, 1996):
where and were defined above, is the number of points in the time series, is the count rate per detector, is the VLE count rate per detector, and is the time bin width, so that is the Nyquist frequency. By using and as free parameters and fixing the other ones to their known values, we fitted this function to the power spectra above 1.6 kHz for each of the 84 observations. All fits represented the data well, without need for shifting, for a value spanning only a narrow range, while was also well determined. Based on these measurements of the deadtime parameters and their distributions we adopted the values =8.87s and =162s to use throughout our entire analysis. These numbers are in the range of values given by the RXTE team (Jahoda et al., 2006) and used by various other authors (Revnivtsev et al., 2000; Wei, 2006). Whether the above values accurately describe the deadtime values for other observations needs to be tested using sources with other spectral shapes and flux levels, as well as for the other VLE settings.
As a test we compared our fit results to those we would have obtained with other choices for the deadtime modified Poisson spectrum calculation. Deadtime parameters =10s, =170s gave a very bad match to many of our power spectra and in those cases produced no reasonable fits, but some previously used deadtime parameter values (near ) gave reasonable results. We refitted the power spectra for the observations showing twin kHz QPOs (Section 3.1) using and s and found no systematic deviations in the kHz QPO frequencies and coherences compared to fitting with our adopted values. This was also the case when using the method of shifting the Poisson noise spectrum to better match the power spectra at high frequencies. We did find that our adopted method tended to be slightly more conservative with respect to detecting high-frequency features than the shifting method, where occasionally an extra component was necessary at high frequencies which was not significant with our method (e.g., power spectrum E of Fig. 2). In any case, twin kHz QPOs reported as significant herein were also significant with these two previously used methods of estimating the deadtime modified Poisson noise spectrum.
| 10068-08, 10122-01, 10122-02, 10122-03 |
| 20094-01, 20095-01, 20097-01, 20415-01 |
| 30080-01, 30081-01 |
| 40059-01 |
| 50136-01 |
| 60024-01, 60025-01 |
| 70020-01, 70020-02, 70020-03, 70021-01 |
| 80027-01, 80114-01 |
| 90025-01, 90426-01 |
| Data | Obs-ID | rms | Q | rms | Q | ||||
|---|---|---|---|---|---|---|---|---|---|
| Set | (Hz) | (%) | (Hz) | (%) | |||||
| A | 10122-03-08-00 | 56.11.3 | 3.880.11 | 0.80.1 | 22918 | 1.410.24 | 2.11.2 | 17318 | 4.10.3 |
| B | 10122-01-15-01 | 83.12.5 | 2.940.15 | 1.30.2 | 28132 | 1.690.32 | 1.60.9 | 19832 | 3.40.4 |
| C | 20095-01-08-00 | 97.52.7 | 3.130.12 | 1.00.1 | 31120 | 1.930.21 | 1.80.5 | 21420 | 3.20.2 |
| D | 20097-01-32-00 | 10026 | 2.740.40 | 0.80.5 | 41948 | 2.030.43 | 2.61.6 | 31954 | 4.21.2 |
| E | 10122-01-18-00 | 106.52.5 | 2.930.13 | 1.20.1 | 35942 | 2.280.25 | 0.90.4 | 25242 | 3.40.4 |
| F | 10068-08-01-00 | 122.37.2 | 2.610.19 | 0.90.2 | 40733 | 1.740.24 | 1.80.7 | 28434 | 3.30.3 |
| G | 20094-01-01-030 | 127.63.6 | 2.530.12 | 1.00.1 | 44520 | 1.600.24 | 1.80.5 | 31720 | 3.50.2 |
| H | 20094-01-01-01 | 136.55.4 | 2.650.21 | 1.10.2 | 40417 | 2.080.19 | 1.90.5 | 26718 | 3.00.2 |
| I | 20095-01-11-00 | 137.45.4 | 2.190.39 | 1.10.3 | 43838 | 1.470.31 | 2.01.3 | 30129 | 3.20.3 |
| J | 20094-01-01-020 | 15722 | 2.370.26 | 0.60.2 | 49761 | 1.470.33 | 1.30.6 | 34064 | 3.20.6 |
| K | 20094-01-01-02 | 22618 | 1.240.28 | 1.81.0 | 50551 | 1.650.22 | 1.50.5 | 27954 | 2.20.3 |


Left: The Poisson spectrum according to the model of Zhang et al. (1995, 1996) using some previously suggested deadtime values (=8.5sec, =150 sec) (dotted) fails to precisely describe the power at high frequencies. With a shift (Klein-Wolt et al., 2004) to match the region (dashed), power at frequencies up to 2 kHz might be overestimated. The Poisson spectrum computed with the deadtime values adopted here and no shifting (drawn) follows the data better in the range Hz where no contribution from the source is expected, and is more conservative with respect to kHz features than the shifted power spectrum.
Right: The strong frequency dependence of the Poisson-noise power at very high frequencies (observed for high time resolution) cannot be described with the Zhang function (dotted) for the deadtime values mentioned above. The curve lies systematically above the data for several kHz, or partially above and partially below it when shifted (dashed), at frequencies where the data should purely be described with Poisson noise. Again the estimate with our adopted deadtime parameters (drawn) is better and appears slightly conservative with respect to possible high-frequency features.