The Spectral Energy Distribution of Dust Emission in the Edge-on Spiral Galaxy NGC 4631 as seen with Spitzer and JCMT
Abstract
We explore the nature of variations in dust emission within an individual galaxy using 3.6 - 160 m Spitzer Space Telescope observations and 450 and 850 m James Clerk Maxwell Telescope observations of the edge-on Sd spiral galaxy NGC 4631 with the goals of understanding the relation between polycyclic aromatic hydrocarbons (PAH) and dust emission, studying the variations in the colors of the dust emission, and searching for possible excess submillimeter emission compared to what is anticipated based on dust models applied to the mid- and far-infrared data. PAH emission at 8 m is found to correlate best with hot dust emission at 24 m on kiloparsec scales, although the relation breaks down on scales equal to hundreds of parsecs, possibly because of differences in the mean free paths between the photons that excite the PAHs and heat the dust and possibly because the PAHs are destroyed by the hard radiation fields in the centers of some star formation regions. The ratio of 8 m PAH emission to 160 m cool dust emission appears to be a function of radius. The 70/160 and 160/450 m flux density ratios are remarkably constant even though the surface brightness varies by a factor of 25 in each wave band, which suggests that the emission is from dust heated by a nearly-uniform radiation field. Globally, we find an excess of 850 m emission relative to what would be predicted by dust models. The 850 m excess is highest in regions with low 160 m surface brightness, although the strength and statistical significance of this result depends on the model fit to the data. We rule out variable emissivity functions or K dust as the possible origins of this 850 m emission, but we do discuss the other possible mechanisms that could produce the emission.
1 Introduction
Before the launch of the Spitzer Space Telescope (Werner et al., 2004), research into the 1 - 1000 m spectral energy distributions (SEDs) of nearby galaxies was greatly restricted by the angular resolution and signal-to-noise levels of far-infrared data. Most of the Infrared Astronomical Satellite (IRAS) and Infrared Space Observatory (ISO) data were only usable as global flux density measurements. In the few cases where galaxies were resolved at far-infrared wavelengths, the spatial information was limited. With Spitzer data, it is now possible to examine 1 - 1000 m SEDs for kiloparsec-sized regions in galaxies at distances up to 10 Mpc. These higher-resolution, higher-sensitivity data allow for new observational investigations into the properties of the polycyclic aromatic hydrocarbons (PAHs) and other dust across this large wavelength regime. In this paper, we will use Spitzer data to address two major issues related to dust emission that were not completely resolved using IRAS and ISO data.
The first major question that can be asked is how best to describe the SEDs of discrete regions within individual nearby spiral galaxies, particularly in the context of describing the dust emission between 60 and 2000 m. Studies combining IRAS and ISO results with submillimeter or millimeter data suggested that a range of simple one or two-component blackbodies modified with different emissivity laws could describe the data. The exact descriptions, however, were confusing and contradictory. The major point of debate was how to describe the emission at submillimeter or millimeter wavelengths that exceeded what is expected when extrapolating from the 60 - 200m regime using one or a series of - 30 K blackbodies modified by emissivity functions. Some studies have suggested that the power law describing the emissivity function varies among nearby galaxies (e.g Dunne et al., 2000; Bendo et al., 2003). Other studies found that the submillimeter or millimeter excess could be described by a cold blackbody modified by a emissivity law. This cold dust temperature component could have a temperature as low as K (e.g Krügel et al., 1998; Siebenmorgen et al., 1999; Galliano et al., 2003, 2005).
Regan et al. (2004) were among the first to examine this issue using Spitzer data. They examined the SEDs of the central starburst ring and outer disk of NGC 7331 and found the 70 - 850 m dust emission from the ring was consistent with dust in the - 25 K range with an emissivity law of . However, a limitation of the study by Regan et al. was the lack of significant submillimeter emission at a high signal-to-noise level outside of the ring. They therefore could not determine whether the description of the dust emission in the center of NGC 7331 applies throughout the galaxy’s disk.
This issue is particularly important in terms of modeling the dust emission and estimating the dust mass within nearby galaxies. If dust as cold as K is present, it will only be a significant source of emission at submillimeter wavelengths, but it may contribute substantially to the mass of the interstellar medium. If the dust emissivity is variable then dust models need to be adjusted to account for this variability. Without these results, the full picture of dust emission in nearby galaxies is incomplete.
The other major question is to determine how PAH emission, particularly the 7.7 m feature, is correlated with dust emission on scales of hundreds of parsecs. Results from ISO gave differing results. Förster Schreiber et al. (2004), among others, found a strong correlation between 7 and 15 m emission in galaxy disks, thus demonstrating a correlation between PAH and hot ( K) dust emission (which is commonly associated with transiently-heated very small grain emission but which may also represent emission from grains that are in thermal equilibrium at K). Haas et al. (2002), however, found that 8 m PAH emission was correlated more closely with 850 m emission from cool ( K) grains than with the 15 m emission from hot dust. Using Spitzer observations of NGC 300, Helou et al. (2004) found that 8 m emission originated from the rims of star formation regions within the galaxy whereas the 24 m emission was more strongly peaked in the centers of the star formation region, which suggested a correlation on kiloparsec scales but not on smaller scales. Dale et al. (2005), however, found that 8 m emission from kiloparsec sized regions within M 81, M 51, and NGC 7331 appeared to be more closely correlated with the total infrared flux than with the 24 m flux density. In a separate analysis of the Spitzer data for M 81, Pérez-González et al. (2006, in press) also found that the 8 m luminosity was closely correlated with the total infrared luminosity on kiloparsec scales, although they did not examine the relation between 8 and 24 m emission.
Identifying how PAH emission is correlated with dust emission will lead to a better understanding of how it can be used as a star formation indicator, as has been suggested by the results of Roussel et al. (2001) and Förster Schreiber et al. (2004) (although the contradictory results of Calzetti et al. (2005) should also be noted). If PAH emission is correlated with 24 m hot dust emission on scales of hundreds of parsecs or kiloparsecs, then it should be as effective a star formation indicator as 24 m emission on those spatial scales. However, if PAH emission is more closely correlated with 160 m cool dust emission, which may trace extended cirrus emission unrelated to star formation (e.g. Hinz et al., 2004), then the PAH emission should be used with greater caution as a star formation tracer.
Among the data available in the Spitzer Infrared Nearby Galaxy Survey (SINGS; Kennicutt et al., 2003), the data for NGC 4631 (catalog ) are optimal for studying the complete SED of the dust emission from mid-infrared to submillimeter wavelengths. NGC 4631 is a nearly edge-on (inclination ; Tully, 1988) Sd galaxy at a distance of 9.0 Mpc with an optical disk of (de Vaucouleurs et al., 1991). The edge-on nature of the galaxy makes it a high surface brightness source that is easier to detect at all wavelengths, particularly submillimeter wavelengths. However, the edge-on orientation adds a geometry effect to the observed surface brightness variations; regions may appear bright because they are intrinsicly luminous or because they represent regions with high column densities. Nonetheless, in terms of this study, the advantages of the edge-on orientation outweigh the disadvantages.
In addition to the Infrared Array Camera (IRAC; Fazio et al., 2004) and Multiband Imaging Photometer for Spitzer (MIPS; Rieke et al., 2004) data taken as part of the SINGS legacy program, deep archival SCUBA (Holland et al., 1999) 450 and 850 m data covering most of the optical disk (previously published in Alton et al., 1999; Stevens et al., 2005) are available for this galaxy. These data almost completely cover the extended dust emission in this galaxy and allow for extraction of 3.6-850 m SEDs from regions throughout the disk. Mid-infrared-to-submillimeter SEDs of this galaxy have been studied before (Bendo et al., 2003; Dumke et al., 2004; Stevens et al., 2005). However, these previous studies have relied on IRAS and ISO data that have lacked the resolution, the sensitivity, or the spatial coverage to study anything more than the global SED or the SED of the center of the object. With these new data, we can study infrared color variations across the entire optical disk of the galaxy and examine the SEDs within discrete regions throughout the disk. These results will lead to answers as to how to characterize far-infrared to submillimeter dust emission throughout a spiral galaxy and how PAH and dust emission at different wavelengths are interrelated.
In Section 2, we present information on the observations and data reduction for this galaxy. We briefly discuss the images in Section 3. In Section 4, we present simple color information from flux densities integrated over set apertures distributed throughout the plane of the galaxy. Then, in Section 5, we present the 3.6 - 850 m spectral energy distributions of the galaxy as a whole and of discrete regions within the galaxy. We then summarize the results in Section 6.
2 Observations and Data Reduction
2.1 IRAC (3.6, 4.5, 5.7, and 8.0 m) Data
The 3.6 - 8.0 m data were taken with IRAC on the Spitzer Space Telescope on 2004 May 23 and 26 in IRAC campaign 5. The observations consist of a series of dithered individual frames that are offset from each other. The two separate sets of observations allow asteroids to be recognized and provide observations at orientations up to a few degrees apart to ease removal of detector artifacts. Points in the center are imaged eight times in 30 s exposures. The full-width half-maxima (FWHM) of the point spread functions (PSFs) are for the four wavebands.
The data are processed using a special SINGS IRAC pipeline. First, a geometric distortion correction is applied to the individual frames. Data from the second set of observations are rotated to the same orientation as the first set of observations. Bias structure is subtracted from the data by subtracting a bias frame from each frame. This bias frame is made by median combining all data frames for the observations; the median filtering effectively removes any target signal from the data, leaving only the bias signal. Next, the image offsets are determined through image cross-correlation. Following this, bias drift is removed by determining the relative offset between overlapping regions of individual frames and subtracting the offset. Finally, cosmic ray masks are created using standard drizzle methods, and final image mosaics are created using a drizzle technique. The final pixel scales are set at . A final residual background is measured in small regions outside the target that are free of bright foreground/background sources, and then this residual is subtracted from the data. The uncertainty in the calibration factor applied to the final mosaics is 10%.
2.2 MIPS (24, 70, and 160 m) Data
The 24, 70, and 160 m data were taken with MIPS on the Spitzer Space Telescope on 2005 January 24 and 26 in MIPS campaign 18. The observations were obtained using the scan-mapping mode in two separate visits to the galaxy, which has the same benefits as for the IRAC data. As a result of redundancy inherent in the scan-mapping mode, each pixel in the core map area was effectively observed 40, 20, and 4 times at 24, 70, and 160 m, respectively, resulting in integration times per pixel of 160 s, 80 s, and 16 s, respectively. The FWHM of the PSFs are at 24 m, at 70 m, and at 160 m.
The MIPS data were processed using the MIPS Data Analysis Tools (Gordon et al., 2005) version 2.96. Since the processing for the 24 m data differed from the 70 and 160 m data, the 24 m data processing will be discussed separately from the 70 and 160 m wavebands.
First, the 24 m images were processed through a droop correction (that removes an excess signal in each pixel that is proportional to the signal in the entire array) and were corrected for non-linearity in the ramps. The dark current was then subtracted. Next, scan-mirror-position dependent flats (created from all SINGS MIPS off-target data from MIPS campaign 18) were applied to the data. Following this, scan-mirror-position independent flats (made from off-target data frames within each visit’s scan map) were applied. A correction to the offsets between the four channels reading out the 24 m detector data was applied to each data frame. Latent images from bright sources, erroneously high or low pixel values, and unusually noisy frames were also masked out. For background subtraction, the median background value as a function of time was determined for each scan leg and then subtracted. The data from both visits were then mosaicked together, and a final residual background offset was measured outside the optical disk of the galaxy and subtracted. We applied the S10 calibration factors in the MIPS Data Handbook111111http://ssc.spitzer.caltech.edu/mips/dh/ (Spitzer Science Center, 2006) to the final mosaics. The calibration factor has an uncertainty of 10%. Color corrections, which are smaller than the calibration uncertainties, are not applied to these data except for making comparisons to IRAS 25 m data.
For the 70 and 160 m data, ramps were fit to the 70 and 160 m reads to derive slopes. In this step, readout jumps and cosmic ray hits were also removed, and an electronic nonlinearity correction was applied. Next, the stim flash frames taken by the instrument were used as responsivity corrections. The dark current was subtracted from the data, an illumination correction was applied, and then short term variations in drift were subtracted from the data (which also subtracted the background). Following this, erroneously high or low pixel values were removed from the data. The data from both visits were then mosaicked together, and a residual offset measured in regions staggering the target was subtracted from the final maps. We applied the S10 calibration factors in the MIPS Data Handbook, which have uncertainties of 20%, to the final mosaics. These uncertainties can also be treated as encompassing the uncertainties from nonlinearity effects in the 70 m wave band. The color corrections are smaller than the calibration uncertainties and are not applied to these data. Note that the 70 m data were affected by a latent image effect that created negative streaks to the south of the central of the data. However, we will not be using this region in the analysis.
To check the accuracy of the flux density measurement at 24 m, we can compare the integrated flux density with the 25 m integrated flux density measured from IRAS data. The 24 m global flux density measured here is Jy. The MIPS Data Handbook suggests a color correction term of for blackbody emission from a 100-200 K source(Spitzer Science Center, 2006), which is what is anticipated for the dust emission that dominates the 24 m wave band. Dividing the observed flux density by this factor gives a color-corrected 24 m flux density of 8.4 Jy. Rice et al. (1988) published a measured 25 m flux density of Jy and a color-corrected flux density of 8.35 Jy. Given the uncertainties in the MIPS and IRAS measurements, the color-corrected flux densities are in good agreement with each other.
2.3 SCUBA (450 and 850 m) Data
The 450 and 850 m data were taken from the JCMT SCUBA archives maintained by the Canadian Astronomy Data Centre. The data used were taken in jiggle map mode. Each jiggle map consists of data taken in a region. During the observations, the secondary shifts through a 64-point pattern so that the bolometers may fully sample the image plane. Additionally, the secondary chops off-source so as to measure the background during the observations. In the data used here, the chop was - in the north-south direction. The FWHM of the PSFs are and at 450 and 850 m, respectively.
Data from projects with identification numbers U43 (5-6 Oct 1997), M98BU19 (8-9 Mar 1998), M99AI16 (14 May 1999), and M00BU51 (14 Jan 2001) were used to build the submillimeter images. These data consist of simultaneous observations at 450 and 850 m, although the data from 14 May 1999 and one frame of data from 14 Jan 2001 were not usable for constructing the 450 m map. Note that the SCUBA narrow-band filters were used for the 1997-1999 observations and the wide-band filters were used for 2001 data; except for some improvements in the signal-to-noise in the 450 m wide-band filter data, the two filter sets are otherwise functionally similar and treated that way in the data processing. All together, the data consist of 182 integrations (194 min) of on-target observations (of which, 149 integrations (159 min) were usable 450 m data).
The data were processed with the SCUBA User Reduction Facility (Jenness & Lightfoot, 1998). The data were first flatfielded and corrected for atmospheric extinction. Noisy bolometers were removed next, followed by spike removal. Then the background signal was subtracted using the signal from several bolometers at the north and south edges of each frame that were selected so as to avoid noisy pixels and any possible negative images (which are an artifact related to the chopping performed during the observations). The data were calibrated using observations of the planets Mars or Uranus or the submillimeter standard CRL 618 and then regridded onto the sky plane. An additional background subtraction was then performed to remove any residual offset. A border at the edge of the observed field was masked out so as to remove anomalously “hot” or “cold” pixels that are artifacts of the sky subtraction. These anomalous pixels are identifiable by the amplitude of the signal, which is greater than the signal from the target, and by the shapes of their radial profiles, which are narrower than the PSFs of true sources. Additional anomalous pixels were identified by eye and masked out. Negative pixels near the south edge of the map just east of the nucleus were identified as a negative image of the plane of the galaxy and masked out in the final map, and the region around a noisy bolometer at the west end of the 850 m map was masked out as well. Typical uncertainties in the calibration are % at 450 m and % at 850 m.
To test the data reduction, the flux densities can be compared to the 450 and 850 m flux densities measured in the same data by Stevens et al. (2005) and the 870 m flux density measured by Dumke et al. (2004) with the 19-channel bolometer array at the Heinrich-Hertz Telescope (HHT). The flux densities measured with the archival SCUBA data in this paper (without adjustments for CO, free-free, or synchrotron emission) are Jy at 450 m and Jy at 850 m. Stevens et al. (2005) measured statistically identical 450 and 850 m global flux densities (without any adjustments) from the same data, thus demonstrating that the data reduction techniques used here can accurately reproduce the data. Dumke et al. (2004) measured the 870 m flux density (without any adjustments) to be Jy. This is only a discrepancy between the SCUBA and HHT measurements. The SCUBA data, however, have a higher signal-to-noise ratio throughout the disk than the HHT data. The plane of the disk from east of the nucleus to west of the nucleus is detected at the level in the unsmoothed 850 m map presented here. In the smoothed 870 m data of Dumke et al., however, some regions inside the disk of the galaxy with signal-to-noise levels of less than are visible, particularly to the east of the center. In the central , where the signal-to-noise levels of both the SCUBA data and the Dumke et al. data are greater than , the two maps give results that agree with each other. We measure the flux density to be Jy within this region, whereas Dumke et al. obtained 1.8 Jy. Therefore, we conclude that the disagreement is for the flux density measurements in the outer disk. Because the signal-to-noise levels of the SCUBA data are superior to the Dumke et al. data, we will rely only on the SCUBA data for 850 m flux densities. (The signal-to-noise ratio of the 1230 m data in Dumke et al. are higher than throughout the disk, so these data should be more reliable. We will use these 1230 m data in constructing global SEDs.)
2.4 Convolution of the Data
To compare data between wavelengths of different resolutions on scales smaller than an arcminute, it is best to convolve the data with kernels that will match not only the FWHM of the PSFs but also the shapes of the PSFs. We are using convolution kernels that will convert an input PSF into a lower resolution output PSF using the ratio of Fourier transforms of the output to input PSFs. High frequency noise in the input PSF is suppressed when these kernels are created. See K. D. Gordon et al. (2006, in preparation) for details.
For comparing flux densities between two wave bands, we match the resolutions of the data to either the resolution of the 70 m data or the resolution of the 160 m data. In a comparison of PAH 8 m and 24 m maps in Section 4.2, we degraded the IRAC data to the resolution of the 24 m data. Note that the kernel for degrading the resolution of the 450 m maps to was not available at the time of this writing.
3 Images
The global 3.6-850 m images of these data are presented in Figure 1. The PAH and dust emission structures from 5.7 m to 850 m all appear very similar, and they do trace similar structures seen in the 3.6 and 4.5 m bands, which contains the Rayleigh-Jeans side of the blackbody starlight emission. Most of the emission lies on the major axis of the optical disk of the galaxy. No bulge is visible, even in the 3.6 and 4.5 m bands.
The brightest 3.6-850 m source is a central structure with a diameter of that looks like an edge-on ring. Magnified images of this structure are shown in Figure 2. Both the east and west lobes of this central structure as well as the nucleus are the three single brightest sources in the central region, although the relative brightness of the nucleus compared to the lobes varies. The nucleus is the brightest 3.6-24 m source, but the east lobe in the central structure is brighter at 70-850 m. Aside from this major variation in the colors, some other more subtle variations can be seen. Two knots of infrared emission to the west of the nucleus are stronger 24 and 70 m sources than the filamentary structure just east of the nucleus, but this filament to the east of the nucleus is a brighter 450 and 850 m source than the knots to the west of the nucleus. Despite these minor color variations, however, all wavebands effectively trace the same structure.
Outside of the nucleus, all wavebands from 5.7 to 850 m still trace similar structures. A series of knots loosely connected by some filamentary dust structures can be seen throughout the disk of this galaxy. The appearance of the disk is notably asymmetric. The infrared emission clearly decreases more sharply to the east of the nucleus than it does to the west. The knots to the west of the central structure all lie in a single line. The dust structures to the east, however, are more jumbled in appearance. Some of the emission above and below the major axis of the optical disk of the galaxy may origniate from outside the plane of the galaxy or near the edge of the stellar disk, but it is difficult to distinguish which interpretation is correct from these data alone.
The interacting elliptical galaxy NGC 4627 can be seen to the northwest of the center outside the plane of the galaxy. The infrared emission from this galaxy is mostly stellar; in these data, it is brightest at 3.6 m, and it generally decreases in brightness towards longer wavelengths. Faint emission is still vaguely visible at 24 m, but none is visible at 160 m. No significant dust structures connecting NGC 4627 and NGC 4631 are visible.
4 Color Variations across the Dust Disk
4.1 Measured Flux Densities within Discrete Regions
To study the infrared color variations within NGC 4631, we have extracted flux densities from a series of circular regions within the optical disk of the galaxy. These regions were selected by eye to include all the bright knots in the 24-70 m images as well as a few other prominent infrared structures. Two different diameters for the regions are used: (to approximately match the FWHM of the 70 and 850 m PSFs) and (to match the FWHM of the 160 m PSF). At a distance of 9.0 Mpc (Kennicutt et al., 2003), the and angular sizes of these regions correspond to diameters of 650 and 1700 pc. In these comparisons, the data are first convolved with the kernels described in Section 2.4 so that all the image resolutions match.
The regions in which the flux densities are measured are shown in Figure 3. Right ascensions, declinations, and flux densities are listed in Tables 1 and 2. Uncertainties in the calibrations are listed as percentages, and uncertainties from background noise (measured in off-source regions of the sky) are listed in Jy. Note that the uncertainties from the background noise is negligible compared to the calibration uncertainty except in the submillimeter bands. Also note that the uncertainties of the mean background levels (which are subtracted from each waveband) correspond to uncertainties in the flux densities that is negligible compared to the uncertainties from background noise. For comparing the ratios of flux density measurements from two individual wavebands, only the background noise is relevant. In plots of flux density versus the ratio of flux densities, changes in the calibration factors will have systematic effects on individual wavebands that will only change the offsets in the plots. Since the goal is simply to identify whether the ratio varies as a function of flux density, any offset introduced by a calibration uncertainty does not change the scientific results. For composing SEDs in Section 5, however, the calibration uncertainties will also be used, since changes in calibration factors could change the shapes of the SEDs as well as the models fit to the data and the physical interpretation of the results.
The IRAC measurements require the application of aperture corrections to account for a the scattering of light through the detector material (Reach et al., 2005), a problem which, among the data in this paper, is unique to the IRAC data. Note that this IRAC aperture correction is not the same as an aperture correction that accounts for the fraction of the PSF created by the optics of the telescope that falls outside a measurement region (which does not need to be applied if the data being compared are convolved to matching resolutions). Aperture corrections are not applied to the flux densities measured in the regions because the flux densities measured in these regions are used for only studying color variations (so aperture corrections would only offset the data points in the plots), because no definitive aperture corrections have been published at the time of this writing, and because preliminary work on IRAC aperture corrections implies that the aperture corrections will be approximately equal to or less than the calibration uncertainties (T. Jarrett, private communication). However, since the flux densities measured in the regions are used for modeling the SEDs (where precise calibration is more important), the “infinite” aperture corrections of Reach et al. (2005) have been applied to the flux densities measured in the regions. The flux densities listed in Table 2 include these corrections.
To use the 8 m band as a tracer of PAH emission, we need to subtract the stellar continuum emission. To do this, we will apply the formula
| (1) |
from Helou et al. (2004) to the measurements in Tables 1 and 2. We use the term “PAH 8 m” to indicate where the continuum has been subtracted. Note that this continuum subtraction only removes the contribution of starlight. In regions with low PAH emission, a significant fraction of the non-stellar emission may originate from hot dust (see Cannon et al., 2006, , for example). Therefore, the actual variations PAH emission may be stronger than what is represented by the continuum-subtracted “PAH 8 m”.
4.2 Comparison between PAH and Hot Dust Emission
First we will investigate how 8 m PAH emission and 24 m hot dust emission are interrelated.
Figure 4 shows how PAH 8 m and 24 m flux densities measured within the (650 pc) regions in Table 2 and the (1700 pc) regions in Table 2 are related to each other. The best fitting functions are
| (2) |
and
| (3) |
Note that the correspondence between the two wavebands is very good when the flux densities are measured within , but the relation begins to break down in . In both aperture sizes, the (PAH 8)/24 m flux density ratio does not vary significantly with the 24 m flux density. However, the standard deviation of the (PAH 8)/24 m flux density ratio is a factor of 2 higher in the data compared to the data, partly because more regions with higher (PAH 8)/24 m flux density ratios are probed by the regions. The map of the ratio of PAH 8 m to 24 m surface brightness in Figure 5 shows exactly why the data exhibit this scatter. The map reveals a significant amount of variation in the ratio within the disk of the galaxy on sub-kiloparsec scales. 24 m emission appears to peak more strongly than PAH emission in the centers of the dusty knots of star formation in this galaxy. The PAHs may be destroyed in the centers of these knots, whereas the hot dust emission rises because the dust is heated more strongly by the intense radiation fields in these knots. This phenomenon had also been reported for NGC 300 in Helou et al. (2004), and further Spitzer observations may reveal that this phenomenon is common among nearby galaxies.
To further examine the difference between the distribution of PAH and hot dust emission, we extracted the PAH 8 m and 24 m radial profiles of multiple individual regions: the center of the galaxy, the lobes at either end of the central structure, and the seven brightest sources outside the center. These radial profiles are shown in Figure 6. As can be seen in these figures, the PAH 8 m emission is clearly broader than the 24 m emission. The PAH 8 m data used to create these radial profiles have been convolved to match the PSFs of the 24 m data, but in several of the regions considered here, the PAH 8 m radial profiles extracted from unconvolved data are still broader than the 24 m radial profiles.
In summary, these data demonstrate that, on kiloparsec scales, PAH and hot dust emission are correlated, but on smaller scales, the two can be spatially separated from each other. The breakdown of the correlation on small scales can be physically interpreted in two ways. One possibility is that the primary source of heating for the dust that produces the 24 m emission may be ultraviolet light that is absorbed close to the centers of the star formation regions, but the PAHs can be excited by visible light (Li & Draine, 2002) that has a greater mean free path. The PAH emission would therefore appear to be more extended than the 24 m emission. The other possibility is that PAHs may be destroyed by the hard radiation in the centers of star formation regions (e.g. Madden et al., 2006), which is why the PAH 8 m emission does not appear to be as peaked as the 24 m emission. Either of these mechanisms would be an adequate explanation for the effects observed here, and both mechanisms may be involved in creating the observed color variations.
4.3 Comparison of PAH and Hot Dust Emission to Cool Dust Emission
Next, we will investigate how the PAH 8 m emission and 24 m hot dust emission are related to cooler dust emission at 70 and 160 m.
Figure 7 shows comparisons of hot dust emission at 24 m to the Wien side of the cool dust emission at 70 m and the Rayleigh-Jeans side of the peak of the cool dust emission at 160 m. Both plots show a general trend where the 24/70 m and 24/160 m flux density ratios increase with surface brightness. The functions that best fit these data are
| (4) |
and
| (5) |
Because of the edge-on nature of this galaxy, it is unclear as to whether this color variation is linked to variations in the dust heating with the intrinsic source luminosity (as anticipated, for example, by the models of (Dale et al., 2001) and (Li & Draine, 2001)) or if the variation simply demonstrates that locations with significant hot dust emission are associated with large column densities of cool dust. However, if the color variation is linked to the cool dust column densities, then the amount of dust integrated over the line of sight is not physically linked to the hot dust, so some significant scatter should be visibile in the relations between surface brightness and color. The absence of such scatter in Figure 7 implies that the color variations are more closely related to dust heating, although column effects may still play a significant role.
Note the two data points in the plot of the 24/70 m flux density ratio versus 70 m flux density that deviate from the general trend. The high surface brightness deviant data point represents the nucleus, and the other deviant data point represents the point-like source at right ascension 12:42:21.4 and declination +32:33:05 located above the major axis of the optical disk of the galaxy to the east of the center. These regions may deviate from the trend because the star formation in these regions is strong enough yet compact enough that the infrared colors deviate significantly from the rest of the disk, that something other than star formation (possibly an active galactic nucleus in the center, for example) is heating the dust, or that the surface brightness of stars is high enough that the stellar emission in the 24 m band is non-negligible. Also note that the extraplanar region may be a foreground/background source not associated with NGC 4631.
Figure 8 shows comparisons of PAH 8 m emission to the large grain emission at 160 m. For comparison with Haas et al. (2002), we also include a comparison of PAH 8 m emission to 850 m emission, although the 850 m wave band may not trace the same dust as the 160 m wave band (see Section 4.4). These data show that the (PAH 8)/160 m and (PAH 8)/850 m flux density ratios increase with surface brightness, which means that the PAH emission is higher in systems with higher surface brightnesses. The functions that best fits these data are
| (6) |
| (7) |
These trends clearly show that the PAH emission does not have a one-to-one correspondence with the 160 or 850 m emission in this galaxy, which contradicts the results of Haas et al. (2002). Note that Haas et al. observed variations in the PAH 8/850 m ratio of less than a factor of 2, whereas the ratios presented here vary by more than a factor of 10. At least on kiloparsec scales within this galaxy, PAH emission is more closely related to hot dust emission than to cool dust emission.
The variations in the ratio of PAH emission to large grain emission could arise from either luminosity effects (where infrared-luminous regions produce relatively more PAH emission) or radial effects (where fewer PAHs are found at larger radii). To investigate this further, we compared plots of the total infrared luminosity (calculated using the MIPS 24, 70 and 160 m data and equation 4 in Dale & Helou, 2002), the 24/160 m flux density ratio, and the (PAH 8)/160 m flux density ratio as a function of radius for all regions listed in Table 2 that lie along the major axis of optical disk of the galaxy. These radial plots are shown in Figure 9. The plots show that the 24/160 m and (PAH 8)/160 m flux density ratios both peak in the center, which is the most infrared-luminous region in the galaxy. Outside the center, however, a correspondence can be found between local peaks in the 24/160 m flux density ratio and local peaks in the total infrared emission, which indicates that variations in the 24/160 m flux density ratio are linked to infrared surface brightness. In contrast, the (PAH 8)/160 m flux density ratio monotonically decreases with radius. No local peaks in the (PAH 8)/160 m flux density ratio corresponding to local peaks in the total infrared emission are found. The variation in the (PAH 8)/160 m flux density ratio is therefore a radial effect.
At first, it appeared that the variations in the (PAH 8)/160 m flux density ratio may be related to metallicity since metallicity also generally varies with radius. Variations in the strength of PAH emission with metallicity have been found previously in observations of the integrated SEDs of galaxies (Thuan et al., 1999; Dale et al., 2005; Engelbracht et al., 2005; Galliano et al., 2005). However, Otte et al. (2002) find variations in the nitrogen abundance in this galaxy that are smaller than the variations in the (PAH 8)/160 m flux density ratio found here, though the examined region does not span the entire optical disk of the galaxy. Moreover, based on the data of Engelbracht et al. (2005), the variation between PAH and dust emission is expected to look like a step function, not a smooth gradient, although the edge-on orientation could be responsible for smoothing out the emission so that this step function disappears. Therefore, we are hesitant to indicate that the radial variations in the (PAH 8)/160 m flux density ratio are connected to metallicity. The cause of the radial variations needs to be examined further.
4.4 Variations in Large Grain Emission
Color variations in the large grain emission from 70-850 m show how the color temperatures of the large grains vary with surface brightness and may also reveal hints of where the coolest dust emission is located within the galaxy.
Figure 10 shows how the 70 m, 160 m, and 450 m emission are interrelated. The functions that best fit these data are
| (8) |
and
| (9) |
Functionally, this is an indicator of the heating of the large dust grains. Virtually no variation in the 70/160 m or 160/450 m colors is apparent, even though the flux densities vary by more than an order of magnitude. At first, this appears to contradict the results of dust models such as the semi-empirical dust models of Dale et al. (2001) and the physical dust models of Li & Draine (2001), which anticipate that these colors should vary dramatically with changes in the radiation fields or surface brightnesses of the regions. However, the absence of variations in the 70/160 m and 160/450 m flux density ratios could indicate that the interstellar radiation field that heats the large grains does not significantly vary throughout the disk of this galaxy. The cause of the variations in surface brightness would therefore be related to variations in the mass of the dust producing the infrared radiation. However, since this galaxy is viewed edge-on, the color variations in the disk may be averaged out along the line of sight, although we may still expect some differences between infrared-bright and infrared-faint regions.
For comparison, ISO observations of targets such as M 51, M 101 (Hippelein et al., 1996), NGC 6946 (Tuffs et al., 1996), and the disk of M 31 (Haas et al., 1998) show that far infrared colors do not vary with surface brightness. However, some Spitzer observations of nearby galaxies such as M 81 (Pérez-González et al. 2006, in preparation), M 51, NGC 7331 (Dale et al., 2005), and NGC 55 (Engelbracht et al., 2004) do show variations in the 70/160 m color with surface brightness. In light of these results, the invariance of the 70/160 m colors found here might be unusual. More observations of far-infrared color variations within other galaxies are needed to interpret the galaxy-to-galaxy differences.
Figure 11 shows how 850 m emission varies with the large grain emission at 70 m, 160 m, and 450 m. The functions that best fit these data in logarithm space are given by
| (10) |
| (11) |
and
| (12) |
If the 160 m, 450 m, and 850 m emission sample the Rayleigh-Jeans side of K dust emission and if the emissivity law does not vary, then the 160/850 m and 450/850 m flux density ratios should remain constant. Furthermore, since the 70 m, 160 m, and 450 m surface brightnesses are well correlated, the dust heating should be uniform, and the ratio of 850 m emission to emission at shorter wavelengths should not change significantly. Despite these expectations, strong variations in 850 m relative to 70-450 m emission is visible in these data. As the surface brightness of the regions decreases, the 850 m emission increases relative to the 70-450 m emission. These trends suggest that the 850 m emission cannot also be described as originating entirely from dust with a temperature of K and an emissivity of .
4.5 Conclusions on Color Variations
In summary, this comparison of flux densities measured in different wavebands has yielded interesting results. The PAH 8 m and 24 m hot dust emission are found to be correlated on kiloparsec scales, but the correlation breaks down on the sub-kiloparsec level. The 24 m hot dust emission is found to increase relative to the 70 and 160 m cool dust emission as the far-infrared surface brightness increases, as had been anticipated based on previous dust models. The PAH 8 m emission is also found to increase relative to the 160 and 850 m wave bands as the far-infrared surface brightness increases, partly because of variations with radius. The 70/160 m and 160/450 m flux density ratios are invariant relative to infrared surface brightness, which suggests that the radiation field that heats the cool grains is relatively invariant. However, the 850 m emission decreases relative to 70-450 m emission as the far-infrared surface brightness increases, which suggests that the 850 m emission may originate partially from a source other than K dust with a emissivity.
5 Spectral Energy Distributions
5.1 Global Spectral Energy Distribution
To examine the global SED, we will use the global flux density measurements published by Dale et al. (2005) with some adjustments. The 3.6 - 8.0 m IRAC measurements did not include aperture corrections to account for the scattering of light through the detector material; we have applied the “infinite” aperture correction of Reach et al. (2005) to those data. The 450 and 850 m flux density measurements were repeated for this paper. The SCUBA observations cover almost all of the infrared-bright regions in the plane of the galaxy as is revealed when comparing the SCUBA images to the 24 m images, so a direct measurement of the flux densities from the images within the optical disk (a ellipse) defined in the Third Reference Catalogue of Bright Galaxies (de Vaucouleurs et al., 1991) should be accurate. The uncertainties related to missing extended emission will probably be less than the the submillimeter calibration uncertainties.121212Note that Dale et al. (2005) applies correction factors of 1.27 and 1.17 to the 450 and 850 m observations, respectively. The correction factor is calculated from the fraction of the integrated flux density in the 70 and 160 m bands that falls outside the region covered by the 450 and 850 m images. In the case of NGC 4631, the 70 and 160 m emission falling outside the region observed in the 450 and 850 m regions is dominated by extended emission above and below the plane of the galaxy that may represent the outer regions of the PSF from the central structure and other bright sources in the plane of the galaxy. The regions not covered in the 450 and 850 m maps above and below the plane probably do not contain any true sources that contributes significantly to the integrated flux density of the galaxy. The 450 and 850 m PSF is effectively truncated in the north-south direction because the observations include chopping to the sky outside the plane of the galaxy, so emission from the wings of the PSF would not be present. Therefore, the 450 and 850 m flux densities have probably been overcorrected in Dale et al. (2005). We apply no correction to the data for the analysis here.
Additionally, we will combine these results with JHK data from the 2MASS Large Galaxy Atlas (Jarrett et al., 2003); 12, 60, and 100 m integrated flux densities from IRAS (Rice et al., 1988); and the 1.23 mm measurements from Dumke et al. (2004) to fill out the spectral energy distribution from 1 to 2000 m. (The 25 m flux density from Rice et al. (1988), the 870 m flux density from Dumke et al. (2004), and the 450 and 850 m measurements from Stevens et al. (2005) are discussed in the context of checks on the 24, 450, and 850 m measurements presented here rather than included as redundant flux density measurements; see Section 2.) Additionally, CO, free-free, and synchrotron emission (calculated in Dumke et al. (2004)) have been subtracted from the 850 and 1230 m flux densities (although the correction is less than 10%).
The results are presented in Table The Spectral Energy Distribution of Dust Emission in the Edge-on Spiral Galaxy NGC 4631 as seen with Spitzer and JCMT and Figure 12. This global SED is typical for nearby spiral galaxies. Stellar blackbody radiation is seen shortward of 4.5 m, PAH and hot dust emission are seen from 5.7 to 24 m, and large cool grain emission is seen longward of 70 m. The large cool grain emission has the highest flux density of any source within the 1-1000 m range, as is typical for normal nearby galaxies.
The slope of the 160-1230 m emission is shallower than what is expected from blackbody emission modified by a emissivity law for a single temperature component of dust (discussed in more detail in Section 5.1.1). This is consistent with the results found by Bendo et al. (2003) and Dumke et al. (2004) although the latter only found excess emission at 1230 m. CO, free-free, and synchrotron emission have already been subtracted from the 850 and 1230 m flux densities, so none of these other emission mechanisms can account for the observed excess emission. Either a dust component in the 5-15 K range must be present or the dust that dominates the 850 - 1230 m regime must have an emissivity that does not vary as . We examine the possibilities further in the following section.
As a test of the models, we are searching for models that give gas-to-dust ratios similar to the ratio of for the Milky Way, which was calculated by examining the depletion of elements in the gas phase of the ISM (Li, 2005). Models with significantly higher or lower dust mass predictions are probably implausible. This test assumes that the ISM in NGC 4631 is similar to the Milky Way’s. However, the metallicity of NGC 4631 is solar metallicity (Otte et al., 2002). If the gas-to-dust mass ratio varies with metallicity, then the expected ratio for NGC 4631 may be higher than the Milky Way’s ratio.
5.1.1 Simple Modified Blackbody Fitting
The simplest way to describe the large grain emission longward of 70 m is to fit the data with one or two blackbodies modified with an emissivity function that scales as a function of , where is the emissivity index. This approach is useful just for approximating the temperature and emissivity of the bulk of the far-infrared dust emission within the galaxy, which can then be used to estimate the mass of the dust.
The first fit is with a blackbody modified by a emissivity law. This emissivity law is what is suggested by simple physical models for far-infrared absorption by small particles (e.g. Draine, 2004). Figure 13a shows this fit applied to only the 70 - 450 m data, which are the data best fit by this single thermal compoment. The component has a temperature of K. Excess emission at 850 and 1230 m is clearly visible in the figure. Note that if a single thermal component is fit to the 70 - 1230 m data, the function significantly overestimates the 160 and 450 m flux densities while still underestimating the 1230 m flux densities, which is what is expected if the emission at 850 and 1230 m is in excess above the thermal emission expected when extrapolating from shorter wavelengths.
The mass of this dust can be calculated using
| (13) |
where is the distance to the galaxy, is the flux density, represents the absorption opacity of the dust (given by Li & Draine (2001)), and is the blackbody function, with the best-fit dust temperature. Using the 450 m data, we estimate the dust mass to be M⊙. For comparison, the total gas mass in this galaxy is M⊙ (Kennicutt et al., 2003). The gas-to-dust ratio implied by this simple modified blackbody fit is 290, which is within a factor of 2 of the Milky Way’s ratio. The mass of the hot dust is not included in this calculation, but the additional mass from hot dust should bring the gas-to-dust ratio closer to the Milky Way’s ratio.
The results show that, to account for the emission at 850 and 1230 m, either a second thermal component with a cooler temperature is needed or the emissivity law must be shallower than . If the source of the excess 850 and 1230 m emission is a new dust component that produces negligible emission at shorter wavelengths, then this new component should not be significantly more massive than the 23 K dust (i.e. the new dust component should not increase the dust mass by a factor of 10 or more). The 23 K dust alone can account for at least half of the dust mass expected for this galaxy.
The next fit is with a single blackbody modified by an emissivity law in which the emissivity index is a variable fit to the data. This fit, applied to the 70 - 1230 m data, is shown in Figure 13b. The fit has a temperature of K and an emissivity index of . Note that this accounts for the excess seen at 850 and 1230 m. However, the slope between the 160 and 450 m data is only marginally consistent with such an emissivity function. Since the dust emissivity index is treated as variable, the absorption opacities may deviate away from the Li & Draine (2001) values by an uncertain amount. However, if the Li & Draine absorption opacities are still applicable in this fit, the corresponding dust mass is M⊙ and the gas-to-dust ratio is 420. This is close to the value derived when the emissivity index was fixed to -2, although the result with the fixed emissivity are slightly closer to the ratio for the Milky Way.
Another possibility is that the dust should be represented with two blackbodies, each of which is modified by emissivity law. To perform this fit properly on dust at temperatures near the temperature of the cosmic microwave background (CMB), we cannot use because it may give temperatures colder than TCMB. Instead, we start with an equation that represents the thermal emission from both the CMB and dust in the galaxy
| (14) |
where is the optical depth of the dust. When the background is subtracted, the equation is rewritten as
| (15) |
| (16) |
Since is proportional to (which we are assuming to be proportional to ), we can fit
| (17) |
to the data. Figure 13c shows the sum of the two thermal components with this modification applied to the 70 - 1230 m data. The two thermal components have temperatures of and K. Even though the two components are fit simultaneously to the 70 - 1230 m data, the results show that the warmer component represents the majority of the 70 - 450 m emission and that the colder component only contributes a significant amount of emission at 850 and 1230 m. This very cold dust emission is physically implausible because of the implied dust masses. If the dust emissivities in Li & Draine (2001) apply to this cold dust component, then the dust mass of the 3.5 K dust is enormous. Based on the fit, approximately half of the 850 m emission comes from this cold dust. Inserting this result into equation 13, we calculate the mass of the 3.5 K dust to be M⊙. This implies a gas-to-dust ratio of , which, when compared to the ratio of for the Milky Way, is too low to be believable. Therefore, we conclude that 3.5 K dust with an emissivity index of -2 cannot give rise to the excess emission observed at 850 - 1230 m.
All together, these results show that, using simple blackbodies modified by emissivities that scale with wavelength, the excess emission at 850 - 1230 m can be represented in two ways. The scenario with 3.5 K dust, however, must be rejected because of the implausibly high dust masses needed to produce the emission. Further analysis on the SEDs of smaller regions within the plane of the galaxy will allow us to further examine whether the variable emissivity index scenario is an appropriate descriptions for the 70 - 850 m emission.
5.1.2 Semi-Empirical Model Fitting
Another option for modeling the dust in this galaxy is to apply the semi-empirical model of Dale et al. (2001) to the data. This model is built using a series of PAH, very small grain, and large grain SEDs. These SEDs are illuminated by a range of radiation fields with relative contributions described by the equation
| (18) |
where U is the radiation field. The two variables fit to the data are and a scaling term. A low indicates relatively strong dust heating, whereas a high indicates the predominance of cooler dust. This is presented as a more complex way to model the dust emission than the simple modified blackbody fit.
The top part of Figure 14 shows the semi-empirical model from Dale et al. (2001) that best fits the 5.7 - 850 m data. This model has an of . This fit does not change significantly if the model is fit to only the 3.6 - 850 m data or the 70 - 850 m data. Of interest here is whether this model describes the dust emission longward of 20 m. The model accurately fits the 70 - 450 m data, but it underestimates the 850 - 1230 m emission. The large grain emission in the Dale et al. (2001) model is represented by a series of blackbodies modified with an emissivity function that scales as , where is a function of the radiation field (see equation 2 in Dale & Helou, 2002). The inability of this model to reproduce these observed results demonstrates that the summation of a range of such modified blackbodies cannot reproduce the excess 850 - 1230 m emission seen here. Either additional dust components or modifications to the emissivity function are needed to reproduce the excess submillimeter emission.
This model can be used to determine the dust mass of the galaxy using the analysis in Section 5.2 of Dale & Helou (2002). First, we calculate the dust mass predicted for a blackbody modified by a emissivity law with a variable index fit to the 70 - 450 m data. (We will not use the 850 or 1230 m data because the model does not adequately describe the emission at those wavelengths.) The best fitting modified blackbody has a temperature of K and a of . Note that this fit statistically differs little from the blackbody modified by the emissivity function fit to the 70 - 450 m in Section 5.1.1. Next, we use the 160 m flux density and the absorption opacities from Li & Draine (2001) in equation 13 to calculate a dust mass, which is found to be M⊙. We then apply the appropriate correction factor from Figure 6 in Dale & Helou (2002). For a model with , the correction factor is . This gives the total dust mass as M⊙, and the gas-to-dust mass ratio as . This is still within a factor of five of the ratio of for the Milky Way, but it is higher than expected, especially in light of NGC 4631’s metallicity. Nevertheless, the dust emission shortward of 450 m is able to account for all of the expected dust mass. This further implies that the modifications that should be applied to this model to explain the excess 850 and 1230 m emission should not substaintially increase the total dust mass.
5.1.3 Physical Modeling
As a third option, we have fit the physical model of Li & Draine (2001) as updated by Draine & Li (2006, in preparation) to the global SED. This model is designed to reproduce the wavelength-dependent dust extinction and emission within the Milky Way and the Magellanic Clouds. The model treats the dust as a mixture of PAHs, amorphous silicate grains and carbonaceous grains with a size distribution ranging from tens of atoms to greater than 1 m. A fraction of the dust mass is illuminated by a range of radiation fields described by the power law in equation 18 but with the exponent fixed to -2 and the maximum fixed to multiplied by the local interstellar radiation field given by (Mathis et al., 1983). This can be thought of as the mass fraction of dust in photodissociation regions. The remainder of the dust mass is modeled as a cool cirrus component heated by a single radiation field equal to the minimum of the range of radiation fields described by the power-law. Five parameters are fit to the data: the minimum value for the illuminating radiation fields, the fraction of the total mass in PAH molecules that are smaller than carbon atoms, the starlight continuum intensity in the IRAC bands, , and the overall dust mass. This model is designed to simultaneously represent the starlight that dominates at 4.5 m and shorter wavelengths, the PAH emission in the the 5.7 and 8 m wave bands, the 12 and 24 m hot dust emission, and the 60-1230 m cool cirrus emission.
The bottom part of Figure 14 shows the physical model that best fits the 1.0-1230 m data. This physical model is able to reproduce the observed 850 m flux densities to within the calibration uncertainty of 10%. Furthermore, it is able to account for % of the total 1230 m emission. In contrast, the single blackbody modified with the emissivity and the semi-empirical model both could account for only -60% of the 850 m and 1230 m emission. Unfortunately, the physical model does not accurately reproduce the steep slope of the dust emission between 160 and 450 m. The model overestimates the 450 m flux density by %, although note that this is only times larger than the 25% uncertainty in the 450 m measurement. In summary, it appears that this physical model can fit the 160-1230 m data points to within . This could be interpreted as marginally successful, although the nature of the mismatch between the model and observations implies that the model underpredicts the 1230 m emission or overpredicts the 450 m emission.
Unlike the single thermal component or the semi-empirical models, the physical model is able to accurately describe the emission at 850 and 1230 m because the colors and scale of the 160-1230 m emission can be adjusted independently of the hot dust emission at shorter wavelengths. In contrast, the single thermal component model treats the emission between 70-450 m as originating from a single temperature when some of the emission at 70 m may be from warmer dust, and the semi-empirical models assume that the colors of all dust emission between 5.7 and 1000 m are interdependent.
The dust mass of the best-fitting model is M⊙. This suggests a gas-to-dust mass ratio of , which is very close to the ratio of for the Milky Way. The dust mass is only a factor of higher than the dust mass predicted by the 23 K blackbody modified by the emissivity given in Section 5.1.1. This is because the temperature of most of the dust in this model is -18 K, which implies, according to equation 13, a mass that is a factor of greater than that calculated using 23 K. Note that this factor is significantly lower than the correction factors of given for the far-infrared or submillimeter bands by Figure 6 in Dale & Helou (2002). Also note that the minimum temperature predicted by this model is K. A very cold ( 10 K) dust component that constitutes approximately 50% or more of the global dust mass may not necessarily be needed to explain the 850 or 1230 m emission.
Among the other parameters in the fit, the term (the mass fraction of dust in the photodissociation regions) yields the most interesting information. The determined in the fit is 0.015 (or 1.5%), which indicates that most of the mass of the dust in the galaxy is heated by a weak baseline radiation field in diffuse cirrus emission. The model also predicts that the small fraction of dust in photodissociation regions produces % of the total dust emission.
The other parameters from the physical model fit are the PAH mass fraction, which is 0.034, and the minimum value of the illuminating radiation field, which is 2.0 times the local interstellar radiation field.
5.2 Spectral Energy Distributions in Discrete Regions
The SEDs of discrete regions within this galaxy will reveal where the excess 850 m emission is present in the galaxy. This will provide additional clues on where the submillimeter excess arises from, which can then be used to better understand the nature of the excess. We composed SEDs for individual regions throughout the disk using the data for the regions in Table 2 but excluding locations where either 450 or 850 m data were not available. Below, we will attempt to describe the data with both simple and complex models of the emission.
5.2.1 Simple Modified Blackbody Fitting
First, we will fit the 70-450 m data with a single blackbody modified by a emissivity law. Example plots of the fits for the central structure, bright knots in the disk, and faint regions in the disk are shown in Figure 15. The parameters for these fits and the difference between the measured 850 m flux density and the fits (henceforth referred to as the excess 850 m emission) is presented in Table 4. Additionally, Figures 16 and 17 show how the temperature and excess 850 m emission from these fits vary with the total infrared luminosity (calculated using the MIPS 24, 70 and 160 m data and equation 4 in Dale & Helou, 2002).
These results show that the function fit to the 70 - 450 m data represents those data very well. As seen in Figure 16, very little variation in the temperature is present, as was expected from the invariance of the 70/160 m and 160/450 m colors in Section 4.4. Additionally, these results provide us with two pieces of evidence that suggest that the excess 850 m emission cannot be explained simply by an emissivity function that deviates from the law given by Li & Draine (2001). First are the results from the fits to the 70 - 450 m data that show that dust with an emissivity index of -2 is adequate for describing the dust emission. Second is the elbow-like bend in the SEDs from 160 to 850 m found in many of the SEDs. This bend cannot be produced by varying the emissivity index for the 70-1000 m dust emission. If the emissivity index is variable, it only varies longward of 450 m. It is possible, however, that some constituent of the interstellar medium other than large solid grains contributes to the emission at 850 m.
The variations in the excess 850 m emission in Figure 17 show that the excess becomes more prominent in the 850 m emission from infrared-faint regions. In the infrared-bright regime, the contribution of the excess to the total emission is only %. This is close to the calibration uncertainties from SCUBA as well as other similar submillimeter data. The excess therefore becomes statistically indistinguishable from the K dust emission found within the waveband. In infrared-faint regions, however, the excess 850 m emission can contribute % of the total 850 m flux density.
Note that the excess 850 m emission observed here (and in Sections 5.2.2 and 5.2.3) as well as the variations in the 70/850, 160/850, and 450/850 m flux density ratios is unlikely to be produced by either a background offset or a calibration error. If the background were incompletely subtracted, the excess 850 m emission listed in Table 4 would be constant. However, the excess 850 m emission instead varies significantly, with low excess values generally more likely to be found in infrared-faint regions (although the trend between the 850 m excess emission and the infrared luminosity is statistically weak). If the calibration of the 850 m emission was incorrect, then the trend in Figure 17 would be flat. Moreover, since the 450 and 850 m data were processed using the same software, calibration standards, and background regions, any offset in the 850 m data should also manifest itself in the 450 m data. Since the 450 m data are consistent with expectations based on shorter wavelengths but the 850 m data are not, we conclude that the excess 850 m emission is real and not an artifact of the data processing.
5.2.2 Semi-Empirical Model Fitting
Next, we have fit the 5.7 - 450 m data with the semi-empirical model of Dale et al. (2001). Example plots of these fits are shown in Figure 18, and parameters from the fits are shown in Table 5. We did attempt fits that included the 850 m data points, but the match to the 850 m data did not improve significantly despite its inclusion, and the fits failed to converge on appropriate values in some situations. We therefore excluded the 850 m data from the fits.
As with the single blackbodies modified with the emissivity laws, these fits still reveal the presence of excess 850 m emission. Plots of how the excess 850 m emission derived from these model fits vary with total infrared luminosity are shown in Figure 19. Again, the fraction of 850 m flux density from the excess increases as the total infrared luminosity decreases. In terms of determining the presence and magnitude of the excess 850 m emission, few differences exist between using these semi-empirical model and using single blackbodies modified with emissivity laws.
The parameter does show a correlation with total infrared luminosity, as shown in Figure 20. Given that the 70/160 m flux density ratio does not vary for these regions but the 24/160 m does vary, the increase in heating must be reflected primarily in changes in the amount of hot dust emission. Again, this is somewhat consistent with the results of Dale et al. (2001), which showed that the 24 m emission would vary most strongly with dust heating. The large grain emission responsible for the 70 and 160 m emission, however, must be relatively unaffected.
5.2.3 Physical Modeling
Finally, we present the physical models that have been fit to the 3.6 - 850 m data. Example plots of these fits are shown in Figure 21. The parameters from the fits are given in Table 6 and the 450 and 850 m excess flux densities are given in Table 7. Unlike the single blackbody fits and the semi-empirical model fits, these physical models perform much better at describing the 850 m data. However, a significant fraction of the 850 m flux density (up to 30%) can still be identified as in excess above the model predictions. Moreover, as seen in Figure 22, this ratio of the excess to total 850 m flux density still varies with the infrared luminosity. Table 7 also shows that the model overestimates the 450 m flux density in the same infrared-faint regions where it underestimates the 850 m emission. (The overestimates are expressed as negative 450 m excess emission.) The overestimates of the 450 m emission may reach up to % in some locations. Nonetheless, these mismatches only reach a maximum of significance within individual regions. So, we conclude that these physical models perform marginally well in explaining the 450 and 850 m emission but that excess 850 m emission may still be present.
The PAH mass fraction determined for the subregions do show a variation with radius. This is shown in Figure 23. The monotonic decrease in the PAH mass fraction with radius is similar to the variation with radius seen in the (PAH 8)/160 m flux density ratio in Figure 9. Again, no local peaks in the PAH mass fraction corresponding to local peaks in the total infrared surface brightness are seen outside the center of the galaxy, at least on the kiloparsec scales of the regions. This additional analysis demonstrates that variations in PAH emission in this galaxy are a function of distance from the center, not infrared surface brightness.
Also of interest are the variations in (the mass fraction of dust in photodissociation regions) with radius. This is shown in Figure 24. Note that this parameter stays at the level of 0.01 - 0.02 except in the central structure, where it reaches up to . This shows that the relative mass of dust in photodissociation regions is twice as high as in the central structure, although it is still a relatively small amount of the total dust mass.
5.3 Discussion
In summary, the SED results show that the far-infrared / submillimeter dust emission is somewhat unusual in two respects. First is the invariance in the color temperature of dust emission in the 70 - 450 m range. This result is unusual in comparison to other recent Spitzer observations of galaxies. However, this invariance could be explained if the bulk of the dust emission originates from dust outside of regions with strong heating by young stars, which may be consistent with the relatively low mass fraction of dust in photodissociation regions found when the physical model was fit to the global SED. The increase in infrared luminosity would then primarily be tracing an increase in dust mass integrated along the line of sight rather than an increase in dust heating. Note that, because this is an edge-on galaxy, increases in the integrated dust mass can be achieved if the line of sight passes through either a greater fraction of diffuse dust distributed evenly throughout the galaxy’s disk or massive individual dust clouds within the galaxy.
The other unusual result from these observations is the slope of the dust emission between 160 and 1230 m. The single modified blackbody fits and the semi-empirical model fits reveal the presence of 850 and 1230 m emission in excess of what is anticipated from models of thermal dust emission. The physical models describe the data better, but the results from the fits imply that such an excess at 850 and 1230 m may be present.
The characteristics of the source of the excess emission - if it is present - are complex. First, if it originates from dust, then the modifications that need to be applied to the models to explain the excess emission should not substantially increase the total estimated dust mass. This is because both simple modified blackbodies and more sophisticated models fit to the 5.7 - 450 m emission give dust masses that suggest dust-to-gas mass ratios similar to what is measured in the Milky Way. Second, if the excess emission represents variability in the emissivity index of the dust emission, the variation only occurs longward of 450 m, as explained in Section 5.2.1. Third, the 850 m excess appears to be found throughout the disk. However, if the excess is present in the brightest infrared regions, it is relatively weak compared to 20-25 K large grain dust emission at 850 m. Finally, the 850 m excess also diminishes in strength in infrared-faint regions, although it may still contribute 30-80% of the 850 m emission.
Klaas et al. (2001), Dunne & Eales (2001), and Bendo et al. (2003) had reported a degeneracy in trying to represent the far-infrared to submillimeter dust emission either as one blackbody modified by an emissivity power law with a variable index or as multiple blackbodies modified with fixed emissivity laws. The results here have shown that the variable emissivity index scenario cannot accurately describe the 70-850 m emission of discrete regions within a galaxy, so the approach should not be applied globally. The 850 m excess is best described as a component of the SED that is separate from the thermal dust emission seen at 70-450 m. However, the 850 m excess should not be described as a very cold thermal dust component because the implied dust masses are too high.
Some previous observations, such as Regan et al. (2004), may have missed similar excess 850 m emission from nearby galaxies because of the nature of the observations. Most global SEDs will be dominated by a few bright regions. If SEDs for subregions are extracted, the subregions are usually of the brightest sources within the targets. The results for this galaxy demonstrate that excess submillimeter and millimeter emission is small compared to the K large grain emission and cannot be easily detected. However, the excess becomes easier to detect in fainter regions in the disk, as it may constitute 80% of the emission in some regions. Therefore, we suggest that the search for excess submillimeter or millimeter emission in other galaxies should not be performed with global or nuclear SEDs but instead should be carried out in fainter regions with galaxies’ optical disks.
Through a process of elimination, only a couple of options are available for describing the 850 and 1230 m excess if it is indeed present. One possibility is that the excess emission originates from dust grains with high submillimeter emissivities relative to their absorption cross sections. Such grains, such as the fractal grains proposed by Reach et al. (1995) for the Milky Way and Dumke et al. (2004) for NGC 4631, may be able to maintain relatively low temperatures, so they would be only detectable at submillimeter wavelengths. This scenario, however, may be physically implausible (Li, 2005). Another possibility, also considered by Reach et al. (1995) for the Milky Way, is the possibility that the emissivity of the -25 K large grains is enhanced above what is expected by Li & Draine (2001) by resonances in the dust grains caused by impurities. Further physical modeling as well as more observations of submillimeter excesses will be needed to better understand this phenomenon.
6 Conclusions
The primary results from this research can be summarized as follows:
1. PAH emission at 8 m is closely related to hot dust emission at 24 m. The relation holds on 1.7 kpc scales but begins to break down at 650 pc scales. Furthermore, the PAH emission is not as centrally peaked as the hot dust emission on scales of hundreds of pc.
2. Variations in the strength of PAH emission relative to cool dust emission and in the fraction of dust mass in PAHs depend primarily on radius, not infrared surface brightness.
3. The 70 - 450 m color temperature does not appear to vary with surface brightness in this galaxy, even though the 24/70 m and 24/160 m flux density ratios do vary with surface brightness. This implies that a substantial part of the dust emission in this wavelength regime may originate from a cool, diffuse cirrus component.
4. The 850 and 1230 m emission in this galaxy is found to exceed what is anticipated from either the 23 K blackbody modified by a emissivity law or the semi-empirical model that describes the emission shortward of 850 m. The physical dust models marginally describe the data, but they leave open the possibility that excess emission at 850 m is present. If present, the 850 m excess is highest in regions of moderate infrared brightness and constitutes the greatest fraction of the 850 m emission in infrared-faint regions.
Two major implications for using PAH emission as a star formation indicator arise from this research. First, these results demonstrate that the spatial correlation between PAH emission and 24 m dust emission breaks down on scales of hundreds of parsecs. This implies that PAH emission cannot be used as an accurate star formation tracer on such scales (if 24 m emission primarily traces star formation regions). Second, these results suggest that the ratio of PAH to dust mass varies radially, although the reason for the radial variation needs further study. If PAH emission is to be used as a tracer of dust or star formation, then these radial effects need to be taken into account. Further comparisons using 8, 24, and 160 m data of nearby galaxies are needed to understand how PAH emission relates to dust emission in other galaxies and to understand the radial variations in the PAH emission.
The color variations and SEDs found within NGC 4631 have some major implications for dust modeling. The absence of variations in the 70/160 m and 160/450 m flux density ratios in this galaxy but the presence of variations in the 70/160 m ratio in other galaxiesneeds to be studied further so as to understand the conditions that cause the ratios to vary or remain constant. Second, dust models may need to be adjusted to better account for the excess emission at 850 m if it is present. Further analysis with Spitzer 70 and 160 m data as well as 850 m data with comparable resolution are needed not only to confirm the presence of the 850 m excess emission in other galaxies but to provide better descriptions of where the excess can be found. Furthermore, additional observations of nearby galaxies at multiple wavelengths between 160 and 850 m are needed so as to better constrain the shape of the SED in this wavelength regime.
References
- Alton et al. (1999) Alton, P. B., Davies, J. I., & Bianchi, S. 1999, A&A, 343, 51
- Bendo et al. (2003) Bendo, G. J., et al. 2003, AJ, 125, 2361
- Calzetti et al. (2005) Calzetti, D., et al. 2005, ApJ, 633,871
- Cannon et al. (2006) Cannon, J. M., et al. 2006, preprint (astro-ph/0604604)
- Dale et al. (2001) Dale, D. A., Helou, G., Contursi, A., Silbermann, N. A., & Kolhatkar, S. 2001, ApJ, 549, 215
- Dale & Helou (2002) Dale, D. A., & Helou, G. 2002, ApJ, 576, 159
- Dale et al. (2005) Dale, D. A., et al. 2005, ApJ, 633, 857
- de Vaucouleurs et al. (1991) de Vaucouleurs, G., de Vaucouleurs, A., Corwin, H. G., Buta, R. J., Paturel, G., & Fouque, P. 1991, Third Reference Catalogue of Bright Galaxies (Berlin: Springer-Verlag)
- Draine (2004) Draine, B. T. 2004, in The Cold Universe, Saas Fee Advanced Course 32, ed. D. Pfenniger & Y. Revaz (Berlin: Springer-Verlag), 213
- Dumke et al. (2004) Dumke, M., Krause, M., & Wielebinski, R. 2004, A&A, 414, 475
- Dunne & Eales (2001) Dunne, L., & Eales, S. A. 2001, MNRAS, 327, 697
- Dunne et al. (2000) Dunne, L., Eales, S. A., Edmunds, M., Ivison, R., Alexander, P., & Clements, D. L. 2000, MNRAS, 315, 115
- Engelbracht et al. (2004) Engelbracht, C. W., et al. 2004, ApJS, 154, 248
- Engelbracht et al. (2005) Engelbracht, C. W., Gordon, K. D., Rieke, G. H., Werner, M. W., Dale, D. A., & Latter, W. B. 2005, ApJ, 628, L29
- Fazio et al. (2004) Fazio, G. G., et al. 2004, ApJS, 154, 10
- Förster Schreiber et al. (2004) Förster Schreiber, N. M., Roussel, H., Sauvage, M., Charmandaris, V. 2004, A&A, 419, 501
- Galliano et al. (2003) Galliano, F., Madden, S. C., Jones, A. P., Wilson, C. D., Bernard, J.-P., & Le Peintre, F. 2003, A&A, 407, 159
- Galliano et al. (2005) Galliano, F., Madden, S. C., Jones, A. P., Wilson, C. D., & Bernard, J.-P. 2005, A&A, 434, 867
- Gordon et al. (2005) Gordon, K. D., et al. 2005, PASP, 117, 50
- Haas et al. (2002) Haas, M., Klaas, U., & Bianchi, S. 2002, A&A, 385, L23
- Haas et al. (1998) Haas, M., Lemke, D., Stickel, M., Hippelein, H., Kunkel, M., Herbstmeier, U., & Mattila, K. A&A, 338, L33
- Helou et al. (2004) Helou, G., et al. 2004, ApJS, 154, 253
- Hinz et al. (2004) Hinz, J. L., et al. 2004, ApJS, 154, 259
- Hippelein et al. (1996) Hippelein, H., et al. 1996, A&A, 315, L82
- Holland et al. (1999) Holland, W. S., et al. 1999, MNRAS, 303, 659
- Jarrett et al. (2003) Jarrett, T. H., Chester, T., Cutri, R., Schneider, S. E., & Huchra, J. P. 2003, AJ, 125, 525
- Jenness & Lightfoot (1998) Jenness, T., & Lightfoot, J. F. 1998, “Reducing SCUBA Data at the James Clerk Maxwell Telescope”, in Astronomical Data Analysis Software and Systems VII, ASP Conf. Ser., 145, 216
- Kennicutt et al. (2003) Kennicutt, R. C., Jr., et al. 2003, PASP, 115, 928
- Klaas et al. (2001) Klaas, U., et al. 2001, A&A, 379, 823
- Krügel et al. (1998) Krügel, E., Siebenmorgen, R., Zota, V., & Chini, R. 1998, A&A, 331, L9
- Li (2005) Li, A. 2005, in Penetrating Bars Through Masks of Cosmic Dust, ed. D. L. Block, I. Puerani, K. C. Freeman, R. Groess, & E. K. Block (Dordrecht: Springer), 535
- Li & Draine (2001) Li, A., & Draine, B. T. 2001, ApJ, 554, 778
- Li & Draine (2002) Li, A., & Draine, B. T. 2002, ApJ, 572, 232
- Madden et al. (2006) Madden, S. C., Galliano, F., Jones, A. P., & Sauvage, M. 2006, A&A, 446, 877
- Mathis et al. (1983) Mathis, J.S., Mezger, P.G., & Panagia, N. 1983, A&A, 128, 212
- Otte et al. (2002) Otte, B., Gallagher, J. S., III, & Reynolds, R. J. 2002, ApJ, 572, 823
- Reach et al. (1995) Reach, W. T., et al. 1995, ApJ, 451, 188
- Reach et al. (2005) Reach, W. T., et al. 2005, PASP, 117, 978
- Regan et al. (2004) Regan, M. W., et al. 2004, ApJS, 154, 204
- Rice et al. (1988) Rice, W., Lonsdale, C. J., Soifer, B. T., Neugebauer, G., Kopan, E. L., Lloyd, L. A., De Jong, T., & Habing, H. J. 1988, ApJS, 68, 91
- Rieke et al. (2004) Rieke, G. H., et al. 2004, ApJS, 154, 25
- Roussel et al. (2001) Roussel, H., Sauvage, M., Vigroux, L., & Bosma, A. 2001, A&A, 372, 427
- Siebenmorgen et al. (1999) Siebenmorgen, R., Krügel, E., & Chini, R. 1999, A&A, 351, 495
- Spitzer Science Center (2006) Spitzer Science Center 2006, Multiband Imaging Photometer for Spitzer (MIPS) Data Handbook Version 3.2.1 (Pasadena: SSC)
- Stevens et al. (2005) Stevens, J. A., Amure, M., & Gear, W. K. 2005, MNRAS, 357, 361
- Thuan et al. (1999) Thuan, T. X., Sauvage, M., & Madden, S. 1999, ApJ, 516, 783
- Tuffs et al. (1996) Tuffs, R. J., et al. 1996, A&A, 315, L149
- Tully (1988) Tully, R. B. 1988, Nearby Galaxies Catalog (Cambridge: Cambridge University Press)
- Werner et al. (2004) Werner, M. W., et al. 2004, ApJS, 154, 1
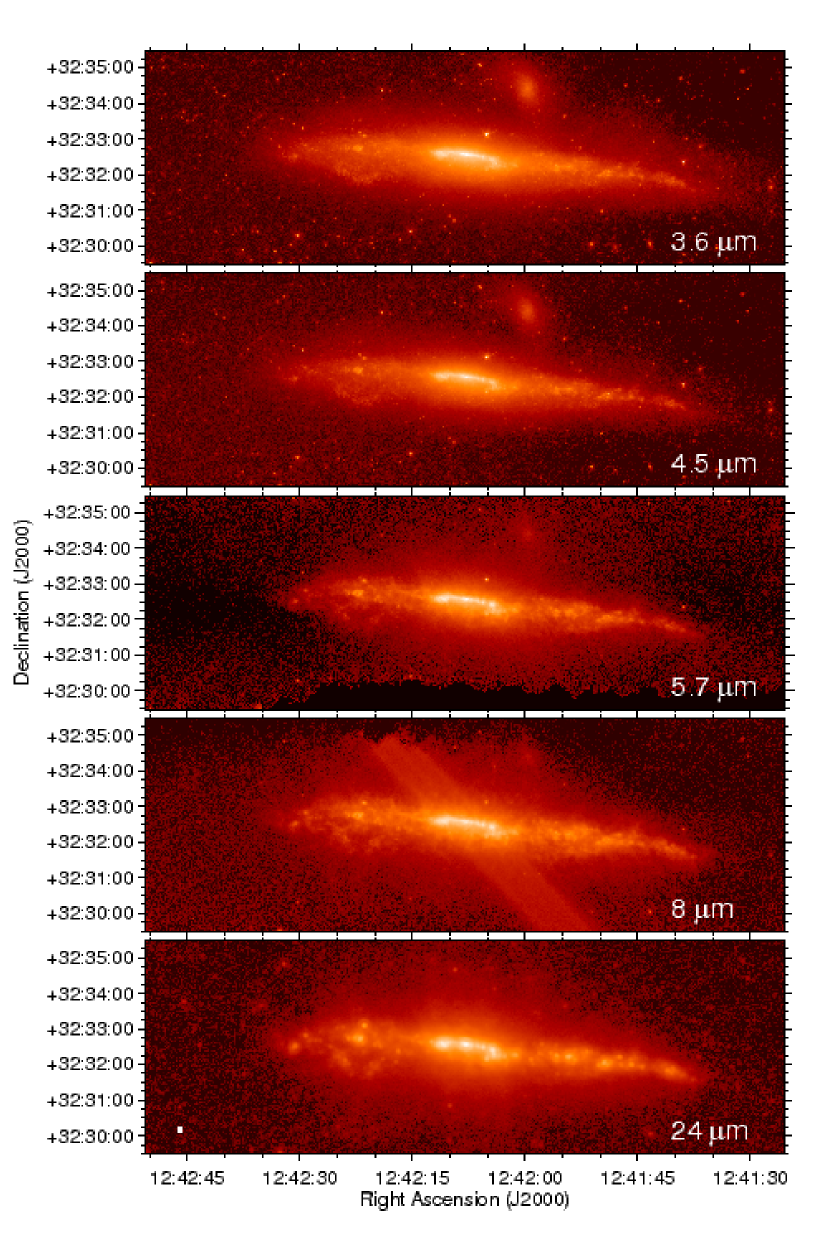
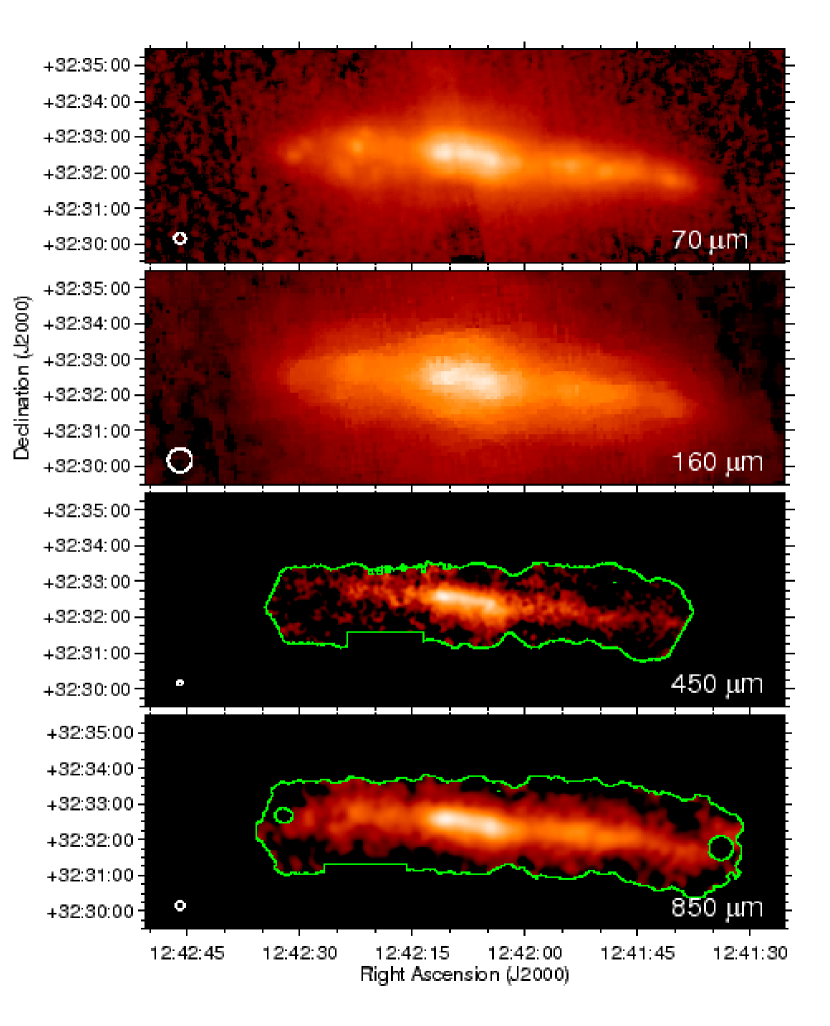
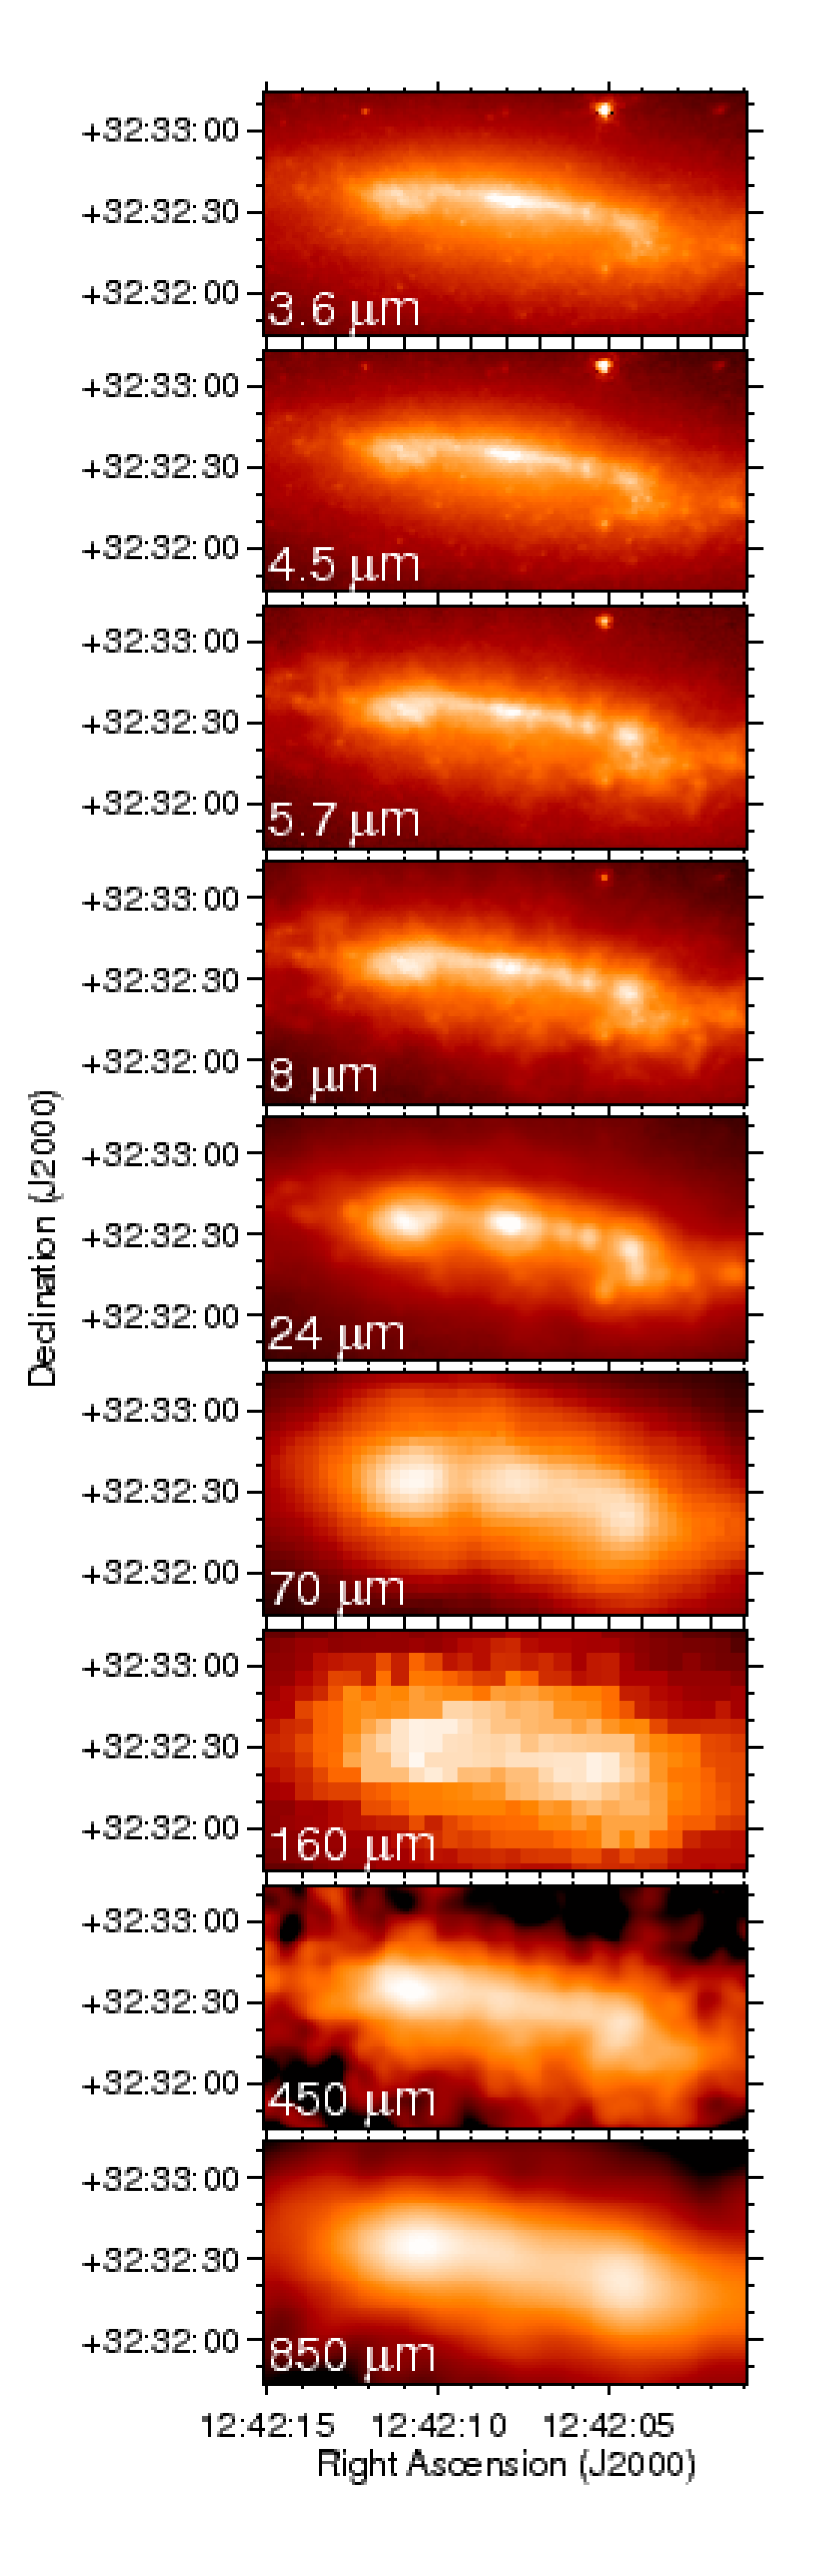
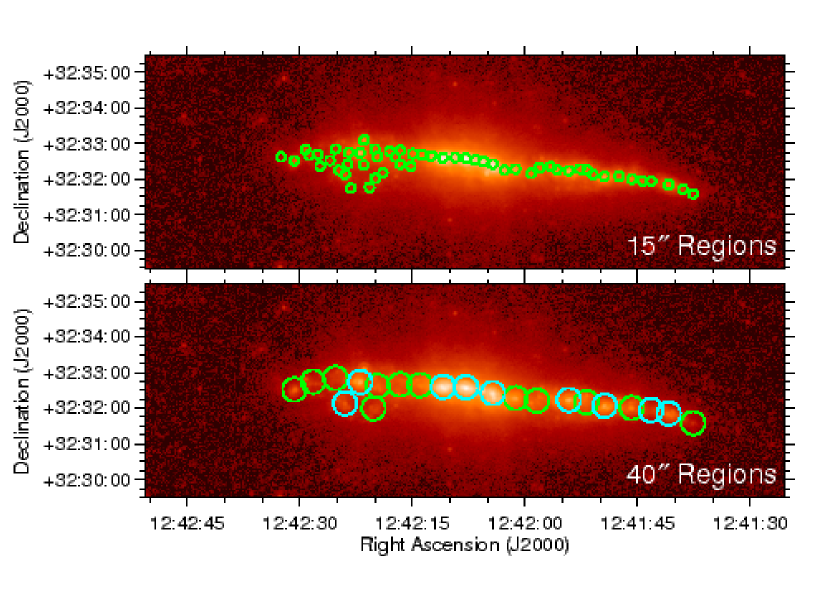


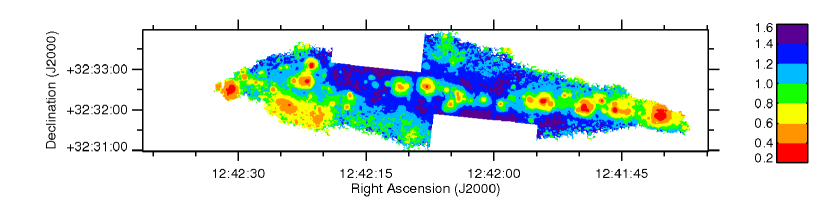
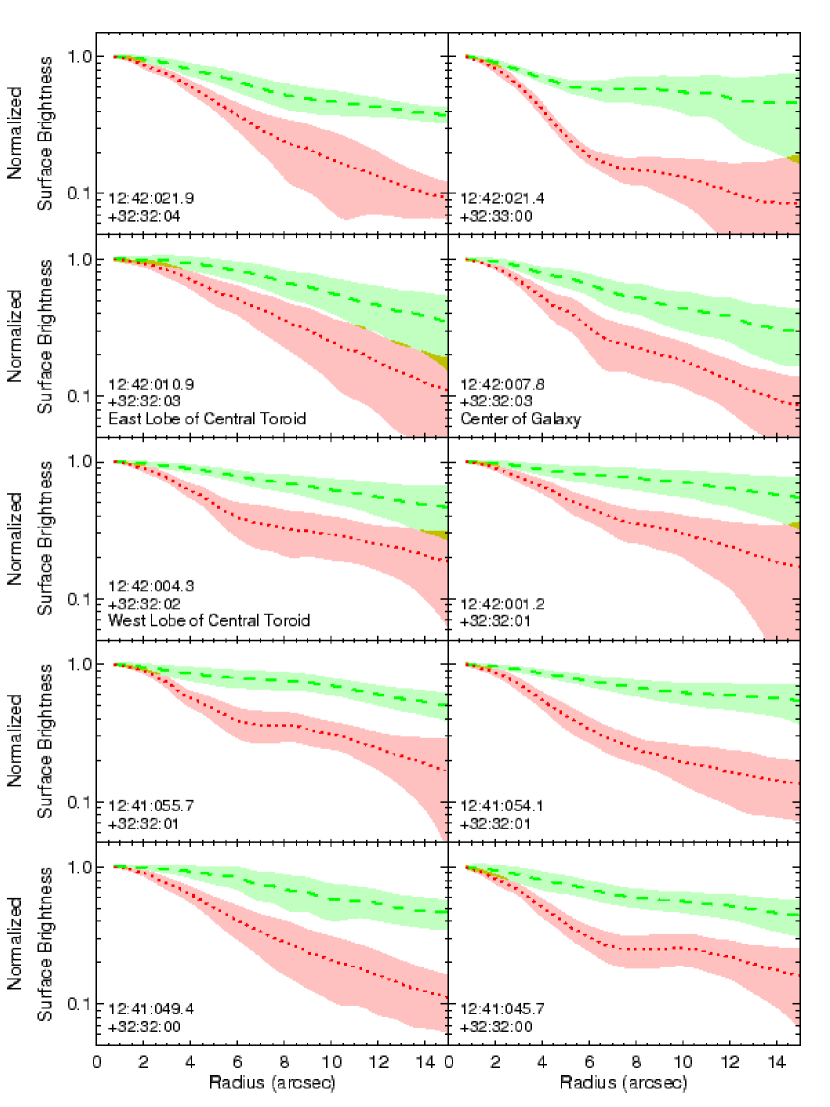


| Position (J2000) | Flux Density (Jy)aaThe 3.6 - 24 m flux densities are measured in maps that have been convolved with the kernels described in Section 2.4 so as to match the higher-resolution PSFs to the PSF of the MIPS 70 m data. | |||||||
|---|---|---|---|---|---|---|---|---|
| R.A. | Dec. | 3.6 mbbCalibration uncertainty: 10%; background noise uncertainty: Jy | 4.5 mccCalibration uncertainty: 10%; background noise uncertainty: Jy | 5.7 mddCalibration uncertainty: 10%; background noise uncertainty: Jy | 8.0 meeCalibration uncertainty: 10%; background noise uncertainty: Jy; note that these data are not stellar continuum subtracted. | 24 mffCalibration uncertainty: 10%; background noise uncertainty: Jy | 70 mggCalibration uncertainty: 20%; background noise uncertainty: Jy | 850 mhhCalibration uncertainty: 10%; background noise uncertainty: Jy; note that CO, free-free, and synchrotron emission have not been subtracted from these data, but since the sum of these emission components only contributes less than 10% to the global flux density, the absence of a correction for these data should not strongly affect the results. |
| 12 41 37.6 | +32 31 34 | |||||||
| 12 41 39.0 | +32 31 43 | |||||||
| 12 41 40.9 | +32 31 50 | |||||||
| 12 41 43.2 | +32 31 56 | |||||||
| 12 41 44.4 | +32 31 56 | |||||||
| 12 41 45.8 | +32 32 00 | |||||||
| 12 41 47.5 | +32 32 04 | |||||||
| 12 41 49.4 | +32 32 04 | |||||||
| 12 41 51.0 | +32 32 07 | |||||||
| 12 41 51.7 | +32 32 15 | |||||||
| 12 41 52.7 | +32 32 17 | |||||||
| 12 41 54.2 | +32 32 14 | |||||||
| 12 41 55.8 | +32 32 15 | |||||||
| 12 41 56.6 | +32 32 20 | |||||||
| 12 41 58.1 | +32 32 19 | |||||||
| 12 41 59.2 | +32 32 09 | |||||||
| 12 42 01.3 | +32 32 17 | |||||||
| 12 42 02.7 | +32 32 14 | |||||||
| 12 42 04.3 | +32 32 25 | |||||||
| 12 42 05.5 | +32 32 29 | |||||||
| 12 42 06.6 | +32 32 32 | |||||||
| 12 42 07.9 | +32 32 35 | |||||||
| 12 42 09.3 | +32 32 36 | |||||||
| 12 42 10.9 | +32 32 35 | |||||||
| 12 42 12.5 | +32 32 38 | |||||||
| 12 42 13.7 | +32 32 41 | |||||||
| 12 42 15.0 | +32 32 42 | |||||||
| 12 42 15.2 | +32 32 21 | |||||||
| 12 42 16.6 | +32 32 48 | |||||||
| 12 42 16.7 | +32 32 24 | |||||||
| 12 42 17.3 | +32 32 37 | |||||||
| 12 42 18.1 | +32 32 46 | |||||||
| 12 42 19.0 | +32 32 10 | |||||||
| 12 42 19.7 | +32 32 37 | |||||||
| 12 42 20.0 | +32 32 00 | |||||||
| 12 42 20.0 | +32 32 50 | |||||||
| 12 42 20.7 | +32 31 46 | |||||||
| 12 42 21.4 | +32 33 05 | |||||||
| 12 42 21.5 | +32 32 23 | |||||||
| 12 42 22.0 | +32 32 44 | |||||||
| 12 42 23.2 | +32 31 44 | |||||||
| 12 42 23.5 | +32 32 44 | |||||||
| 12 42 23.6 | +32 32 25 | |||||||
| 12 42 24.0 | +32 32 08 | |||||||
| 12 42 24.8 | +32 32 14 | |||||||
| 12 42 25.3 | +32 32 50 | |||||||
| 12 42 26.0 | +32 32 31 | |||||||
| 12 42 27.3 | +32 32 21 | |||||||
| 12 42 27.6 | +32 32 41 | |||||||
| 12 42 28.7 | +32 32 40 | |||||||
| 12 42 29.3 | +32 32 49 | |||||||
| 12 42 30.8 | +32 32 31 | |||||||
| 12 42 32.5 | +32 32 37 | |||||||
| Position (J2000) | Flux Density (Jy)aaThe 3.6 - 70 and 450 - 850 m flux densities are measured in maps that have been convolved with the kernels described in Section 2.4 so as to match the higher-resolution PSFs to the PSF of the MIPS 160 m data. | |||||||||
|---|---|---|---|---|---|---|---|---|---|---|
| R.A. | Dec. | 3.6 mbbCalibration uncertainty: 10%; background noise uncertainty: Jy; the “infinite” aperture corrections from Reach et al. (2005) have been applied to these data. | 4.5 mccCalibration uncertainty: 10%; background noise uncertainty: Jy; the “infinite” aperture corrections from Reach et al. (2005) have been applied to these data. | 5.7 mddCalibration uncertainty: 10%; background noise uncertainty: Jy; the “infinite” aperture corrections from Reach et al. (2005) have been applied to these data. | 8.0 meeCalibration uncertainty: 10%; background noise uncertainty: Jy; the “infinite” aperture corrections from Reach et al. (2005) have been applied to these data; note that these data are not stellar continuum subtracted. | 24 mffCalibration uncertainty: 10%; background noise uncertainty: Jy. | 70 mggCalibration uncertainty: 20%; background noise uncertainty: Jy. | 160 mhhCalibration uncertainty: 20%; background noise uncertainty: Jy. | 450 miiCalibration uncertainty: 25%; background noise uncertainty: Jy. | 850 mjjCalibration uncertainty: 10%; background noise uncertainty: Jy; note that CO, free-free, and synchrotron emission have not been subtracted from these data, but since the sum of these emission components only contributes less than 10% to the global flux density, the absence of a correction for these data should not strongly affect the results. |
| 12 41 37.6 | +32 31 34 | |||||||||
| 12 41 40.9 | +32 31 50 | |||||||||
| 12 41 43.2 | +32 31 56 | |||||||||
| 12 41 45.8 | +32 32 00 | |||||||||
| 12 41 49.4 | +32 32 04 | |||||||||
| 12 41 51.8 | +32 32 10 | |||||||||
| 12 41 54.2 | +32 32 14 | |||||||||
| 12 41 58.4 | +32 32 12 | |||||||||
| 12 42 01.3 | +32 32 17 | |||||||||
| 12 42 04.3 | +32 32 25 | |||||||||
| 12 42 07.9 | +32 32 35 | |||||||||
| 12 42 10.9 | +32 32 35 | |||||||||
| 12 42 14.0 | +32 32 38 | |||||||||
| 12 42 16.7 | +32 32 39 | |||||||||
| 12 42 19.7 | +32 32 37 | |||||||||
| 12 42 20.2 | +32 31 59 | |||||||||
| 12 42 22.0 | +32 32 44 | |||||||||
| 12 42 24.0 | +32 32 08 | |||||||||
| 12 42 25.3 | +32 32 50 | |||||||||
| 12 42 28.3 | +32 32 44 | |||||||||
| 12 42 30.8 | +32 32 31 | |||||||||
| Wavelength (m) | Flux Density (Jy) | Source | Reference |
|---|---|---|---|
| 1.3 | 2MASS | 1 | |
| 1.6 | 2MASS | 1 | |
| 2.2 | 2MASS | 1 | |
| 3.6 | aaThe “infinite” aperture corrections from Reach et al. (2005) have been applied to these data. | Spitzer/IRAC | 2 |
| 4.5 | aaThe “infinite” aperture corrections from Reach et al. (2005) have been applied to these data. | Spitzer/IRAC | 2 |
| 5.7 | aaThe “infinite” aperture corrections from Reach et al. (2005) have been applied to these data. | Spitzer/IRAC | 2 |
| 8.0 | aaThe “infinite” aperture corrections from Reach et al. (2005) have been applied to these data. | Spitzer/IRAC | 2 |
| 12 | IRAS | 3 | |
| 24 | Spitzer/MIPS | 2 | |
| 60 | IRAS | 3 | |
| 70 | Spitzer/MIPS | 2 | |
| 100 | IRAS | 3 | |
| 160 | Spitzer/MIPS | 2 | |
| 450 | JCMT/SCUBA | (this paper) | |
| 850 | bbCO, free-free, and synchrotron emission have been subtracted from these global flux density measurements using data from Dumke et al. (2004). | JCMT/SCUBA | (this paper) |
| 1230 | bbCO, free-free, and synchrotron emission have been subtracted from these global flux density measurements using data from Dumke et al. (2004). | IRAM | 4 |
| Position (J2000) | Temperature | Excess 850 m | Ratio Excess to Total | Total Infrared | |
|---|---|---|---|---|---|
| R.A. | Dec. | (K)bbUncertainties in the temperatures are 2 K. | Flux Density (Jy) | 850 m Flux Density | Luminosity (L⊙) |
| 12 41 40.9 | +32 31 50 | 22.2 | |||
| 12 41 43.2 | +32 31 56 | 22.3 | |||
| 12 41 45.8 | +32 32 00 | 22.8 | |||
| 12 41 49.4 | +32 32 04 | 23.0 | |||
| 12 41 51.8 | +32 32 10 | 23.0 | |||
| 12 41 54.2 | +32 32 14 | 22.6 | |||
| 12 41 58.4 | +32 32 12 | 21.9 | |||
| 12 42 01.3 | +32 32 17 | 22.2 | |||
| 12 42 04.3 | +32 32 25 | 22.8 | |||
| 12 42 07.9 | +32 32 35 | 22.9 | |||
| 12 42 10.9 | +32 32 35 | 22.6 | |||
| 12 42 14.0 | +32 32 38 | 22.1 | |||
| 12 42 16.7 | +32 32 39 | 21.3 | |||
| 12 42 19.7 | +32 32 37 | 21.7 | |||
| 12 42 20.2 | +32 31 59 | 23.0 | |||
| 12 42 22.0 | +32 32 44 | 22.3 | |||
| 12 42 24.0 | +32 32 08 | 23.2 | |||
| 12 42 25.3 | +32 32 50 | 22.3 | |||
| 12 42 28.3 | +32 32 44 | 22.3 | |||
| Position (J2000) | bbThis is the index of the power law that describes the range of radiation fields heating the dust. Uncertainties in the values are . | Excess 850 m | Ratio Excess to Total | Total Infrared | |
|---|---|---|---|---|---|
| R.A. | Dec. | Flux Density (Jy) | 850 m Flux Density | Luminosity (L⊙) | |
| 12 41 40.9 | +32 31 50 | 2.31 | |||
| 12 41 43.2 | +32 31 56 | 2.44 | |||
| 12 41 45.8 | +32 32 00 | 2.38 | |||
| 12 41 49.4 | +32 32 04 | 2.31 | |||
| 12 41 51.8 | +32 32 10 | 2.38 | |||
| 12 41 54.2 | +32 32 14 | 2.31 | |||
| 12 41 58.4 | +32 32 12 | 2.44 | |||
| 12 42 01.3 | +32 32 17 | 2.31 | |||
| 12 42 04.3 | +32 32 25 | 2.19 | |||
| 12 42 07.9 | +32 32 35 | 2.13 | |||
| 12 42 10.9 | +32 32 35 | 2.25 | |||
| 12 42 14.0 | +32 32 38 | 2.31 | |||
| 12 42 16.7 | +32 32 39 | 2.50 | |||
| 12 42 19.7 | +32 32 37 | 2.44 | |||
| 12 42 20.2 | +32 31 59 | 2.50 | |||
| 12 42 22.0 | +32 32 44 | 2.25 | |||
| 12 42 24.0 | +32 32 08 | 2.50 | |||
| 12 42 25.3 | +32 32 50 | 2.56 | |||
| 12 42 28.3 | +32 32 44 | 2.81 | |||
| Position (J2000) | Total | PAH Mass | ccThis is the fraction of dust heated by a range of radiation fields described by a power law distribution. The rest of the dust is assumed to be heated by a low level radiation field. | Minimum Illuminating | |
|---|---|---|---|---|---|
| R.A. | Dec. | Mass (M⊙) | FractionbbThis is the fraction of the total dust mass that is in PAH molecules that are smaller than carbon atoms. The value for the Milky way is 0.0488 . | Radiation FieldddThis is expressed in units of the local interstellar radiation field. | |
| 12 41 40.9 | +32 31 50 | 0.019 | 0.0151 | 0.7 | |
| 12 41 43.2 | +32 31 56 | 0.019 | 0.0103 | 1.0 | |
| 12 41 45.8 | +32 32 00 | 0.026 | 0.0170 | 1.0 | |
| 12 41 49.4 | +32 32 04 | 0.026 | 0.0164 | 1.5 | |
| 12 41 51.8 | +32 32 10 | 0.026 | 0.0140 | 1.5 | |
| 12 41 54.2 | +32 32 14 | 0.026 | 0.0153 | 1.5 | |
| 12 41 58.4 | +32 32 12 | 0.034 | 0.0107 | 1.5 | |
| 12 42 01.3 | +32 32 17 | 0.042 | 0.0212 | 1.5 | |
| 12 42 04.3 | +32 32 25 | 0.042 | 0.0299 | 2.0 | |
| 12 42 07.9 | +32 32 35 | 0.042 | 0.0278 | 3.0 | |
| 12 42 10.9 | +32 32 35 | 0.042 | 0.0323 | 2.0 | |
| 12 42 14.0 | +32 32 38 | 0.042 | 0.0158 | 2.0 | |
| 12 42 16.7 | +32 32 39 | 0.034 | 0.0115 | 1.5 | |
| 12 42 19.7 | +32 32 37 | 0.034 | 0.0172 | 1.0 | |
| 12 42 20.2 | +32 31 59 | 0.026 | 0.0110 | 2.0 | |
| 12 42 22.0 | +32 32 44 | 0.026 | 0.0193 | 1.5 | |
| 12 42 24.0 | +32 32 08 | 0.019 | 0.00921 | 2.0 | |
| 12 42 25.3 | +32 32 50 | 0.026 | 0.0110 | 1.5 | |
| 12 42 28.3 | +32 32 44 | 0.019 | 0.0115 | 1.0 | |
| Position (J2000) | Excess 450 m | Ratio Excess to Total | Excess 850 m | Ratio Excess to Total | Total Infrared | |
|---|---|---|---|---|---|---|
| R.A. | Dec. | Flux Density (Jy)bbNegative numbers correspond to regions where the model fits predict a higher flux density than the observations. | 450 m Flux DensitybbNegative numbers correspond to regions where the model fits predict a higher flux density than the observations. | Flux Density (Jy)bbNegative numbers correspond to regions where the model fits predict a higher flux density than the observations. | 850 m Flux DensitybbNegative numbers correspond to regions where the model fits predict a higher flux density than the observations. | Luminosity (L⊙) |
| 12 41 40.9 | +32 31 50 | |||||
| 12 41 43.2 | +32 31 56 | |||||
| 12 41 45.8 | +32 32 00 | -0.15 | ||||
| 12 41 49.4 | +32 32 04 | |||||
| 12 41 51.8 | +32 32 10 | |||||
| 12 41 54.2 | +32 32 14 | |||||
| 12 41 58.4 | +32 32 12 | |||||
| 12 42 01.3 | +32 32 17 | |||||
| 12 42 04.3 | +32 32 25 | |||||
| 12 42 07.9 | +32 32 35 | |||||
| 12 42 10.9 | +32 32 35 | |||||
| 12 42 14.0 | +32 32 38 | |||||
| 12 42 16.7 | +32 32 39 | |||||
| 12 42 19.7 | +32 32 37 | |||||
| 12 42 20.2 | +32 31 59 | |||||
| 12 42 22.0 | +32 32 44 | |||||
| 12 42 24.0 | +32 32 08 | |||||
| 12 42 25.3 | +32 32 50 | |||||
| 12 42 28.3 | +32 32 44 | |||||