V1647 Ori: The X-ray Evolution of a Pre-main Sequence Accretion Burst
Abstract
We present Chandra X-ray Observatory monitoring observations of the recent accretion outburst displayed by the pre-main sequence (pre-MS) star V1647 Ori. The X-ray observations were obtained over a period beginning prior to outburst onset in late 2003 and continuing through its apparent cessation in late 2005, and demonstrate that the mean flux of the spatially coincident X-ray source closely tracked the near-infrared luminosity of V1647 Ori throughout its eruption. We find negligible likelihood that the correspondence between X-ray and infrared light curves over this period was the result of multiple X-ray flares unrelated to the accretion burst. The recent Chandra data confirm that the X-ray spectrum of V1647 Ori hardened during outburst, relative both to its pre-outburst state and to the X-ray spectra of nearby pre-MS stars in the L1630 cloud. We conclude that the observed changes in the X-ray emission from V1647 Ori over the course of its 2003–2005 eruption were generated by a sudden increase and subsequent decline in its accretion rate. These results for V1647 Ori indicate that the flux of hard X-ray emission from erupting low-mass, pre-MS stars, and the duration and intensity of such eruptions, reflect the degree to which star-disk magnetic fields are reorganized before and during major accretion events.
1 Introduction
The origin(s) of the luminous X-ray emission characteristic of low-mass, pre-main sequence (pre-MS) stars remains the subject of vigorous debate. For weak-lined (apparently non-accreting) T Tauri stars, there is substantial evidence that the X-rays are primarily the result of solar-like coronal activity (Feigelson & Montmerle 1999; Kastner et al. 2004a). For certain actively accreting pre-MS stars, however, the X-ray emission instead appears to arise as a direct consequence of the accretion process itself (TW Hya, Kastner et al. 2002, Stelzer & Schmitt 2004; BP Tau, Schmitt et al. 2005). These results cannot be easily reconciled with the fact that, for the Orion Nebula Cluster, the X-ray luminosities of actively accreting pre-MS stars are somewhat smaller than those of non-accreting pre-MS stars (Flaccomio et al. 2003; Preibisch et al. 2005).
Chandra X-ray Observatory and XMM-Newton observations of V1647 Ori, obtained both before and just after this pre-MS star in the L1630 dark cloud underwent a spectacular optical/IR outburst (Briceno et al. 2004; Reipurth & Aspin 2004; Walter et al. 2004; McGehee et al. 2004; Vacca, Cushing, & Simon 2004; Andrews et al. 2004; and references therein), revealed a striking correspondence between the onset of the X-ray and optical/IR eruptions of this pre-MS star (Kastner et al. 2004b, hereafter K04; Grosso et al. 2005, hereafter G05). These results serve as strong evidence that high-energy emission from young stars can occur as a consequence of high accretion rates. We have continued to monitor V1647 Ori in X-rays with Chandra and XMM, and present here the results of observations obtained beginning about one year after the acquisition of the initial, post-outburst X-ray data reported in K04 and G05.
2 Observations and Data Reduction
Observations of the L1630 field centered on V1647 Ori were obtained on 2005 April 11, August 27, December 9 and 14, and 2006 May 1 with Chandra’s Advanced CCD Imaging Spectrometer in its imaging CCD readout configuration (ACIS-I). Exposure times were 18.2, 19.9, 19.7, 18.1, and 21.7 ks, respectively. ACIS has a pixel size of 0.49′′ and the field of view of ACIS-I is ; the Chandra/ACIS-I combination is sensitive over the energy range 0.3–10 keV. V1647 Ori was positioned at the standard ACIS-I aimpoint on front-illuminated CCD I3 during each exposure. The data were subject to standard processing by the Chandra X-Ray Center pipeline software (CIAO, V. 3.1; CALDB, V. 3.0–3.2). Count rates for V1647 Ori and three nearby field X-ray sources (Table 1) were determined by extracting source photons in the energy range 0.5-8.0 keV (to limit background) within radius circular regions, and then subtracting the area-weighted background count rate within a radius off-source region. For the 2005 April and 2005 August datasets, in which V1647 Ori is well detected, we also extracted X-ray light curves (Fig. 1) and pulse height spectra (Fig. 2) within the radius circular region centered on the position of the star.
3 Results
It is apparent from the count rates presented in Table 1 that the X-ray source associated with V1647 Ori generally faded throughout the period of observations reported here, to the extent that the source was not detected on 2005 Dec. and 2006 May 1; the detection on 2005 Dec. 14 is marginal, with at most four source photons collected. The three field X-ray sources — all of which are associated with pre-MS stars in the L1630 dark cloud — were readily detected (though variable in count rate) throughout this same period (Table 1). It is furthermore apparent from Fig. 1 that V1647 Ori remained variable on hr timescales during the yr post-outburst X-ray observations reported here; such rapid X-ray variability was also observed during the first six months post-outburst (G05).
To assess whether the X-ray spectrum of V1647 Ori has changed significantly since our previous post-outburst observations (K04; G05), and to convert the V1647 Ori Chandra/ACIS-I X-ray count rates to X-ray fluxes, we performed spectral modeling with XSPEC (ver. 12). We assumed the source spectrum consists of thermal plasma emission (as represented by the MEKAL model; Liedahl et al. 1995 and references therein) with a metallicity of 0.8 relative to solar and suffering intervening absorption characterized by cm-2 (G05). Under these assumptions, we find a source plasma with keV best fits the 2005 April data (Fig. 2). This value of is well within the 90% confidence range of the “hard” X-ray spectral component determined from modeling of Chandra data obtained in March 2004 (Fig. 2; K04) and XMM data obtained in 2004 April (G05). The same plasma model is also consistent with the rather noisy spectrum obtained in 2005 August (Fig. 2). We therefore used this model ( cm-2, keV; ACIS-I3 energy conversion factor ECF erg cm-2 count-1) to calculate observed X-ray fluxes (and X-ray flux upper limits) from the ACIS count rates of V1647 Ori for all five observations reported here, as well as for the post-outburst 2004 March observations. The measured median photon energies (Table 1) confirm that the V1647 Ori X-ray source remained somewhat hard for at least one year post-outburst, relative both to its pre-outburst X-ray emission and to other nearby, pre-MS sources in L1630. The median energies provide marginal evidence that the X-ray spectrum of V1647 Ori softened after 2005 August, so we adopt the estimated pre-outburst value keV (K04) in converting the 2005 December and 2006 May ACIS-I3 count rate and upper limit to X-ray flux and flux upper limit, respectively (adopting the ECF calculated from the 2005 April data would increase both flux values by a factor ).
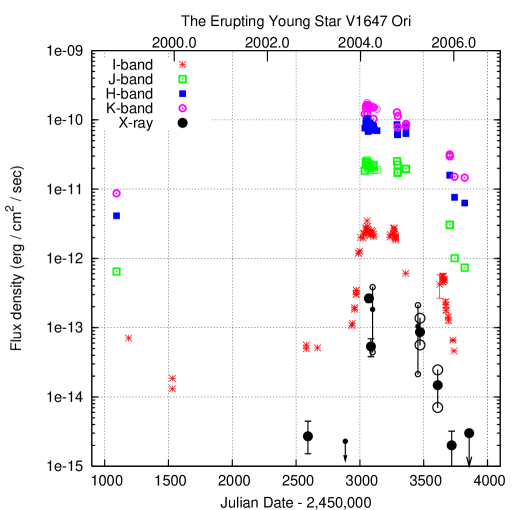
These X-ray flux results, and contemporaneous near-infrared fluxes, are compiled in Fig. 3, which also includes previously reported near-infrared and X-ray fluxes. For consistency with K04 and G05 — and with the infrared photometric data, which are not corrected for extinction — values of X-ray flux included in Fig. 3 are not corrected for intervening absorption. For the four Chandra and XMM exposures of duration ks in which the mean X-ray flux is erg cm-2 s-1, we indicate the range of X-ray flux as measured in 5 ks time bins. This Figure reveals that, subsequent to April 2005 (J.D. 2,453,400), V1647 Ori steeply declined in near-infrared luminosity, such that the object had returned to near pre-outburst levels by late 2005. The XMM and Chandra/ACIS-I observations reveal a steady decline in mean X-ray flux from the object over this time period. We next consider whether the two declines are physically related.
4 Discussion
4.1 Striking correspondence or mere coincidence?
Flux variations of a factor were measured in the longer-duration XMM observations of V1647 Ori in outburst (Fig. 3). While the detailed X-ray variations of V1647 Ori observed in these longer exposures (e.g., G05) do not appear typical of X-ray flares from more evolved, low-mass, pre-MS stars, it is important to assess the likelihood that the apparent striking correspondence between the X-ray and near-infrared light curves of V1647 Ori over the course of its outburst resulted from random X-ray flaring during the optical/IR eruption.
Consider a simplified “short-term” ( ks duration) flaring model in which the X-ray source could be in either of two states — flaring (“high”, mean erg cm-2 s-1) or quiescent (“low”, mean erg cm-2 s-1) — with equal probability, during any given Chandra or XMM observation. For 10 random samplings of such a bimodal source, the probability that we would observe the specific sequence of mean source states displayed in Fig. 3 — low prior to J.D. 2,453,000, high between J.D. 2,453,000 and 2,453,700, low again after J.D. 2,453,700 — is 1 in , or %. We also constructed a somewhat more sophisticated Monte Carlo flare model, in which the source is characterized by a specific combination of flare duration and flare duty cycle, each of which are adjustable parameters. The source state was then determined at irregular temporal sampling intervals matching those of the Chandra and XMM observations. We find that, over a wide range of both flare duration (10 ks to 100 ks) and duty cycle (10% to 90%), the number of instances in which the model high vs. low state sequence matches that of the observations is no more than 0.11% of the total number of model sequences. Hence, it is highly unlikely that the apparent coincidence of strongly enhanced and then sharply declining X-ray flux is the chance superposition of shorter-duration X-ray flaring on the longer-term near-infrared flux increase and decline.
4.2 Classification of V1647 Ori
Herbig (1989) described eruptive behavior among low-mass, pre-MS stars as either FU Orionis-like (“FUor”; see review by Kenyon & Hartmann 1996) or EX Lupi-like (“EXor”). Such sustained optical/IR outbursts from pre-MS stars are generally interpreted as episodes of rapid accretion (e.g., Herbig et al. 2001; Hartmann & Kenyon 1996). There has been much discussion in the recent literature (e.g., Aspin et al. 2006; Vig et al. 2006; Ojha et al. 2006; Muzerolle et al. 2005) as to which accretion burst “class” V1647 Ori might belong. Based on the near-infrared monitoring results presented in Fig. 3 (see also Aspin et al. 2006), it is now apparent that the outburst that began in late 2003 and had ended by late 2005 was an event of much shorter duration than those of “classical” FUors, which typically last several decades. The only other known outburst of V1647 Ori during the past 100 yr, which occurred in 1966-1967, was of similar or perhaps somewhat shorter duration (Aspin et al.). It therefore appears V1647 Ori cannot be considered an FUor and, hence, joins the ranks of the candidate EXors — which already comprise a rather diverse set of objects in terms of outburst amplitudes, durations, and frequencies. Such a broad spectrum of variability behavior ultimately hints at the presence of a wide range in the rates of accretion onto individual pre-MS stars, as well as a wide range in the rate of change of these accretion rates.
4.3 X-rays and accretion
The increase and subsequent decrease in the infrared flux from V1647 Ori (Fig. 3) is evidently entirely the result of variations in accretion luminosity, as there has been minimal change in extinction toward the object during its outburst (Reipurth & Aspin 2004; Gibb et al. 2006). Specifically, the accretion rate is inferred to have increased from a pre-outburst level of a few yr-1 to yr-1 at outburst onset (Vacca et al. 2004; Muzerolle et al. 2005). It follows that the rapid decline in the optical/IR luminosity of of V1647 Ori in late 2005 was caused by a similarly precipitous drop in accretion rate to near pre-outburst levels. The measured Br-gamma line flux from V1647 Ori dropped by a factor between 2005 March and 2006 January (Gibb et al. 2006; Simon, unpublished), supporting the interpretation that the accretion rate has declined sharply over this period.
Hence, just as the sudden onset of bright X-rays from V1647 Ori was closely coupled to its initial accretion burst (K04), the recent drop in the X-ray luminosity of V1647 Ori is most likely directly coupled to a rapid decline in stellar accretion rate. The contrast between the relatively small amplitude short-term near-infrared variability of V1647 Ori during its 2003–2005 outburst and its rapid (hour-timescale), large-amplitude X-ray variability over this same period further suggests that whereas the near-infrared continuum is diagnostic of large-scale changes in disk mass and temperature structure (that, in turn, reflect changes in the time-averaged accretion rate; Muzerolle et al. 2005), the X-rays trace small-scale changes in the star-disk magnetic field configuration that result in the release of magnetic energy.
These results for V1647 Ori, like the detection of enhanced X-ray emission from XZ Tau during an optical/IR outburst from that star (Giardino et al. 2006), strengthen the link between pre-MS accretion and X-ray emission. On the other hand, the recent optical outburst of the EXor candidate V1118 Ori was accompanied by a softening of its X-ray spectrum and only modest changes in X-ray luminosity (Audard et al. 2005); and simultaneous optical and X-ray observations of the Orion Nebula Cluster obtained over a -week period indicate that, on timescales of hours to days, optical and X-ray variability is largely uncorrelated (Stassun et al. 2006). Neither the V1118 Ori nor ONC optical/IR outbursts were as intense as that of V1647 Ori, and the ONC optical flares observed by Stassun et al. are, of course, of far shorter duration.
The foregoing suggests that the duration and intensity of a pre-MS stellar eruption reflects the degree to which the magnetic fields connecting star to disk are reorganized before and during a major accretion event. The degree of reorganization (i.e., the intensity of associated magnetic reconnection events) then likely determines whether such an accretion event is accompanied by the release of hard X-rays, as opposed to soft X-rays indicative of accretion shocks (e.g., Kastner et al. 2002). The unusually hard X-ray spectrum of FU Ori itself, with its prominent Fe line emission (Skinner, Briggs, & Güdel 2006), may indicate that this system remains in a volatile state of ongoing star-disk magnetic field reconnection. Additional, long-term, simultaneous X-ray and near-infrared monitoring of eruptive pre-MS stars is essential to establish whether sustained (EXor- or FUor-like) accretion bursts are commonly accompanied by enhanced hard X-ray emission.
References
- (1) Andrews, S.M., Rothberg, B., & Simon, T. 2004, ApJ, 610, L45
- (2) Aspin, C., Barbieri, C., Boschi, F., diMille, F., Rampazzi, F., Reipurth, B., & Tsvetkov, M. 2006, AJ, in press
- (3) Audard, M., Güdel, M., Skinner, S. L., Briggs, K. R., Walter, F. M., Stringfellow, G., Hamilton, R. T., & Guinan, E. F. 2005, ApJ, 635, L81
- (4) Babu, G. J., & Feigelson, E. D. 1996, “Astrostatistics” (Chapman & Hall), pp. 96–97
- (5) Briceno, C. et al. 2004, ApJ, 606, L123
- (6) Fedele, D., & van den Ancker, M. E. 2006, CBET, 428, 1
- (7) Feigelson, E.D., & Montmerle, T. 1999, ARAA, 37, 363
- (8) Flaccomio, E., Damiani, F., Micela, G., Sciortino, S., Harnden, F. R., Jr., Murray, S. S., & Wolk, S. J. 2003, ApJ, 582, 398
- (9) Giardino, G., Favata, F., Silva, B., Micela, G., Reale, F., & Sciortino, S. 2006, A&A, in press (astro-ph/0603630)
- (10) Gibb, E. L., Rettig, T. W., Brittain, S. D., Wasikowski, D., Simon, T., Vacca, W. D., Cushing, M. C., & Kulesa, C. 2006, ApJ, 641, 383
- (11) Grosso, N., Kastner, J., Ozawa H., Richmond M., Simon T., Weintraub D.A., Hamaguchi K., & Frank A. 2005, A&A, 438, 159 (G05)
- (12) Hartmann, L., & Kenyon, S.J. 1996, ARAA, 34, 207
- (13) Herbig, G. 1989, in Proceedings of “ESO Workshop on Low Mass Star Formation and Pre-main Sequence Objects,” B. Reipurth, ed. (Munich: ESO), p. 233
- (14) Herbig, G., Aspin, C., Gilmore, A. C., Imhoff, C. L., & Jones, A. F. 2001, PASP, 113, 1547
- (15) Kastner, J.H., Huenemoerder, D.P., Schulz, N.S., Canizares, C.R., & Weintraub, D.A. 2002, ApJ, 567, 434.
- (16) Kastner, J.H., Huenemoerder, D.P., Schulz, N.S., Canizares, C.R., Li, J., & Weintraub, D.A. 2004a, ApJ, 605, L49
- (17) Kastner, J.H., et al. 2004b, Nature, 430, 429 (K04)
- (18) Kospal, A., Abraham, P., Acosta-Pulido, J., Csizmadia, Sz., Eredics, M., Kun, M., Racz, M. 2006, IBVS, in press (astro-ph/0511733)
- (19) Liedahl, D.A., Osterheld, A.L., & Goldstein, W.H. 1995, ApJL, 438, 115
- (20) McGehee, P., Smith, J.A., Henden, A.A., Richmond, M.W., Knapp, G.R., Finkbeiner, D.P., Ivezic, Z., & Brinkmann, J. 2004, ApJ, 616, 1058
- (21) Muzerolle, J., Megeath S.T., Flaherty K.M., Gordon K.D., Rieke G.H., Young E.T., & Lada C.J. 2005, ApJ, 620, L107
- (22) Preibisch, Th., et al. 2005, ApJS, 160, 557
- (23) Ojha, D.K., et al. 2006, MNRAS, 368, 825
- (24) Reipurth, B., & Aspin, C. 2004, ApJ, 606, L119
- (25) Schmitt, J.H.M.M., Robrade, J., Ness, J.-U., Favata, F., & Stelzer, B. 2005, A&A, 432, L35
- (26) Skinner, S. L., Briggs, K. R., & Güdel, M. 2006, ApJ, 643, 995
- (27) Stassun, K., van den Berg, M., Feigelson, E., Flaccomio, E. 2006, ApJ, in press (astro-ph/0606079)
- (28) Stelzer, B., & Schmitt, J.H.M.M. 2004, A&A, 418, 687
- (29) Vacca, W.D., Cushing, M.C., & Simon, T. 2004, ApJ, 609, L29
- (30) Venkat, V., & Anandarao, B. G. 2006, IAU Circular 8694
- (31) Vig, S., Ghosh, S.K., Kulkarni, V.K., Ojha, D.K. 2006, A&A, 446, 1021
- (32) Walter, F.M., Stringfellow, G.S., Sherry, W.H., & Field-Pollatou, A. 2004, AJ, 128, 1872


| V1647 Ori | LkH 301 | CXO J054618.8-000537 | CXO J054611.6-000627 | ||||||
|---|---|---|---|---|---|---|---|---|---|
| Obs. Date | J.D. | rate | rate | rate | rate | ||||
| (ks-1) | (keV) | (ks-1) | (keV) | (ks-1) | (keV) | (ks-1) | (keV) | ||
| 2002 Nov. 14 | 2452593 | 0.21 | 1.8 | 8.30.4 | 1.4 | 32.20.8 | 1.4 | 2.00.2 | 1.6 |
| 2004 Mar. 7 | 2453072 | 10.71.4 | 3.6 | 8.91.4 | 1.6 | 26.22.3 | 1.4 | 5.8 1.1 | 1.7 |
| 2004 Mar. 22 | 2453087 | 2.20.7 | 2.00.4 | 5.71.1 | 1.8 | 25.12.3 | 1.5 | 1.40.5 | 1.1 |
| 2005 Apr. 11 | 2453472 | 4.90.5 | 3.50.1 | 2.10.4 | 2.0 | 50.02.0 | 1.9 | 1.40.4 | 2.1 |
| 2005 Aug. 27 | 2453610 | 0.90.2 | 3.00.7 | 1.30.3 | 1.5 | 15.61.0 | 1.6 | 1.60.3 | 1.8 |
| 2005 Dec. 9 | 2453714 | 3.70.4 | 1.6 | 12.71.1 | 1.4 | 0.560.08 | 1.5 | ||
| 2005 Dec. 14 | 2453719 | 0.200.12 | 1.7 | 4.60.5 | 1.6 | 17.11.0 | 1.6 | 1.10.3 | 1.7 |
| 2006 May 1 | 2453857 | 15.30.8 | 1.8 | 18.50.9 | 1.6 | 0.40.15 | 1.9 | ||
Notes:
a) ACIS-S in 2002 and 2004 observations, ACIS-I in 2005–2006; these
four sources were located on
a front-illuminated CCD in the 2002 and 2005–2006 observations,
and on a back-illuminated CCD in the 2004 observations.
b) Median energy of source photons, with uncertainties
calculated via the half sample method (Babu & Feigelson
1996).
c) 3 upper limit.