The Hydrogen Burning Turn-off of RS Ophiuchi 2006
Abstract
We report a coordinated multi-band photometry of the RS Oph (catalog ) 2006 outburst and highlight the emission line free -band photometry that shows a mid-plateau phase at mag from day 40 to day 75 after the discovery followed by a sharp drop of the final decline. Such mid-plateau phases are observed in other two recurrent novae, U Sco (catalog ) and CI Aql (catalog ), and are interpreted as a bright disk irradiated by the white dwarf. We have calculated theoretical light curves based on the optically thick wind theory and have reproduced the observed light curves including the mid-plateau phase and the final sharp decline. This final decline is identified with the end of steady hydrogen shell-burning, which turned out the day . This turnoff date is consistent with the end of a supersoft X-ray phase observed with Swift. Our model suggests a white dwarf mass of , which indicates that RS Oph is a progenitor of Type Ia supernovae. We strongly recommend the -filter observation of novae to detect both the presence of a disk and the hydrogen burning turn-off.
Subject headings:
binaries: close — binaries: symbiotic — novae, cataclysmic variables — stars: individual (RS Ophiuchi) — supernovae: general — white dwarfs1. Introduction and Summary
RS Oph (catalog ) is one of the well-observed recurrent novae and is suggested to be a progenitor system of Type Ia supernovae (e.g., Hachisu & Kato, 2001b). It has undergone its sixth recorded outburst on 2006 February 12 UT (Narumi et al., 2006). The five previous recorded outbursts occurred in 1898, 1933, 1958, 1967, and 1985. These short yr recurrence periods indicate that the white dwarf (WD) mass is very close to the Chandrasekhar mass and that the mass accretion rate is as large as yr-1 (see, e.g., Fig.2 of Hachisu & Kato, 2001b). If the WD mass increases after each outburst, RS Oph (catalog ) will eventually explode as a Type Ia supernova (e.g., Nomoto, 1982; Hachisu et al., 1996, 1999a; Hachisu & Kato, 2001b). Therefore, it is important to estimate the WD mass and the accreted mass left on the WD after the outburst.
It is well known that the X-ray turnoff time is a good indicator of the WD mass (e.g., Hachisu & Kato, 2005, 2006a). When the hydrogen shell-burning atop the WD extinguishes, a supersoft X-ray phase ends (e.g., Krautter et al., 1996). In a visual light curve, however, this turnoff is not clear because many strong emission lines contribute to it. To avoid such contamination to the continuum flux, we have observed RS Oph with the Strömgren -band filter. The -filter is an intermediate bandpass filter designed to cut the strong emission lines in the wide bandpass filter, so that its light curve represents the continuum flux of novae (e.g., Hachisu & Kato, 2006b). We have further modeled the light curve of RS Oph and have determined the WD mass by fitting our modeled light curve with the observation.
Section 2 presents our multi-band photometry of the RS Oph (catalog ) 2006 outburst. The light curve fitting of the observation with our numerical model are presented in §3. Discussion follows in §4.
| name of | location | telescope | observed | No. of obs. |
|---|---|---|---|---|
| observer | in Japan | aperture | bands | nights () |
| Kiyota | Tsukuba | 25cm | 24 | |
| Kubotera | Odawara | 16cm | 8 | |
| Maehara | Kawaguchi | 20/25cm | 19 | |
| Nakajima | Kumano | 25cm | 55 | |
| OKUaaOsaka Kyoiku University team | Kashiwara | 51cm | 25 |
2. Observation
Optical observations were started just after the discovery of the 2006 outburst (Narumi et al., 2006). Each observer and their observational details are listed in Table 1. We have put a special emphasis on the Strömgren y-filter to avoid contamination by the strong emission lines. These y-filters were made by Custom Scientific Inc.111http://www.customscientific.com/ and distributed to each observer by one of the authors (M. Kato). Kiyota, Kubotera, Maehara, and Nakajima (VSOLJ members) started observation on February 13 and obtained 65 nights data for -magnitudes (from February 17 to July 27). Osaka Kyoiku University (OKU) team obtained and magnitudes of 25 nights starting from February 17 (until July 14). The magnitudes of this object were measured by using the local standard star, TYC2 5094.92.1 (Kiyota) or TYC2 5094.283.1 (the other observers). We adapted the brightness and color of (, ) for TYC2 5094.92.1 and (, ) for TYC2 5094.283.1 from Tycho2 catalog.
| parameter | symbol | 25% | 50% | 100% |
|---|---|---|---|---|
| efficiency | efficiency | efficiency | ||
| WD mass | ||||
| irradiation | 0.25 | 0.50 | 1.0 | |
| disk size | 0.24 () | 0.34 () | 0.48 () | |
| size of RG | 0.24 () | 0.34 () | 0.47 () | |
| distance | 0.9 kpc | 1.3 kpc | 1.7 kpc |
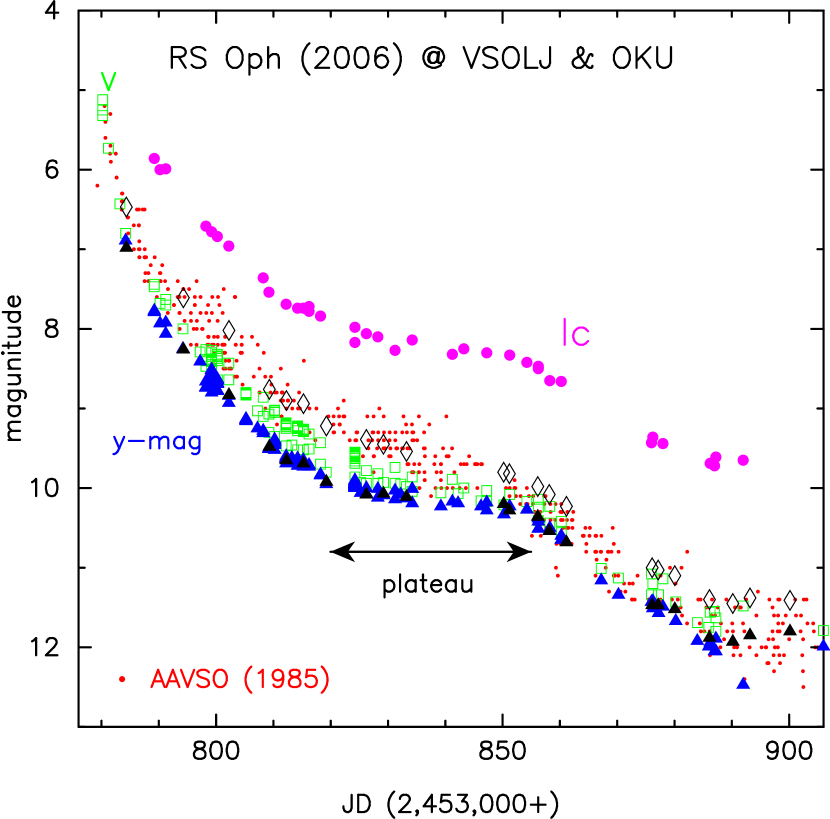
The -magnitudes are plotted in Figure 1 together with - and -magnitudes. We have also added visual magnitudes of the 1985 outburst from the American Association of Variable Star Observers (AAVSO) for comparison. Our -magnitudes show very small scatter and follows the bottom of the 1985 visual magnitude. The essential feature of the light curve is very similar to the previous outbursts.
The light curve, however, clearly shows a plateau phase from day 40 to day 75 and the sharp final decline starting from day 75. Such mid-plateau phases are also observed in two other recurrent novae, U Sco (catalog ) (e.g., Hachisu et al., 2000) and CI Aql (catalog ) (e.g., Hachisu & Kato, 2001a; Hachisu et al., 2003; Hachisu & Kato, 2003a). These authors interpreted the mid-plateau phase as a bright disk irradiated by the hydrogen-burning WD and a sharp start of the final decline as the epoch when the hydrogen shell-burning ends.
3. Light Curve Model
Our binary model, essentially the same as that in Hachisu & Kato (2001b) except for the free-free emission model (see below) in the early phase of the outburst, consists of a red giant (RG) star, which is not filling its Roche lobe, a white dwarf (WD), and a disk around the WD. A circular orbit with the ephemeris given by Fekel et al. (2000) is assumed.
3.1. Photospheric evolution of the white dwarf
After a thermonuclear runaway sets in on a mass-accreting WD, its photosphere expands greatly and an optically thick wind massloss begins. The decay phase of novae can be followed by a sequence of steady state solutions (e.g., Kato & Hachisu, 1994). After the optically thick winds stop, the envelope settles into a hydrostatic equilibrium where its mass is decreasing by nuclear burning. When the nuclear burning decays, the WD enters a cooling phase, in which the luminosity is supplied with heat flow from the ash of hydrogen burning. We have followed nova evolution, using the same method and numerical techniques as in Kato & Hachisu (1994).
In our nova light curve model, we assume that free-free emission of the optically thin ejecta dominates the continuum flux in the early phase of RS Oph outbursts as in many classical novae (e.g., Gallagher & Ney, 1976). This is the main and most important difference from previous Hachisu & Kato’s (2001b) model, in which the blackbody emission is assumed.
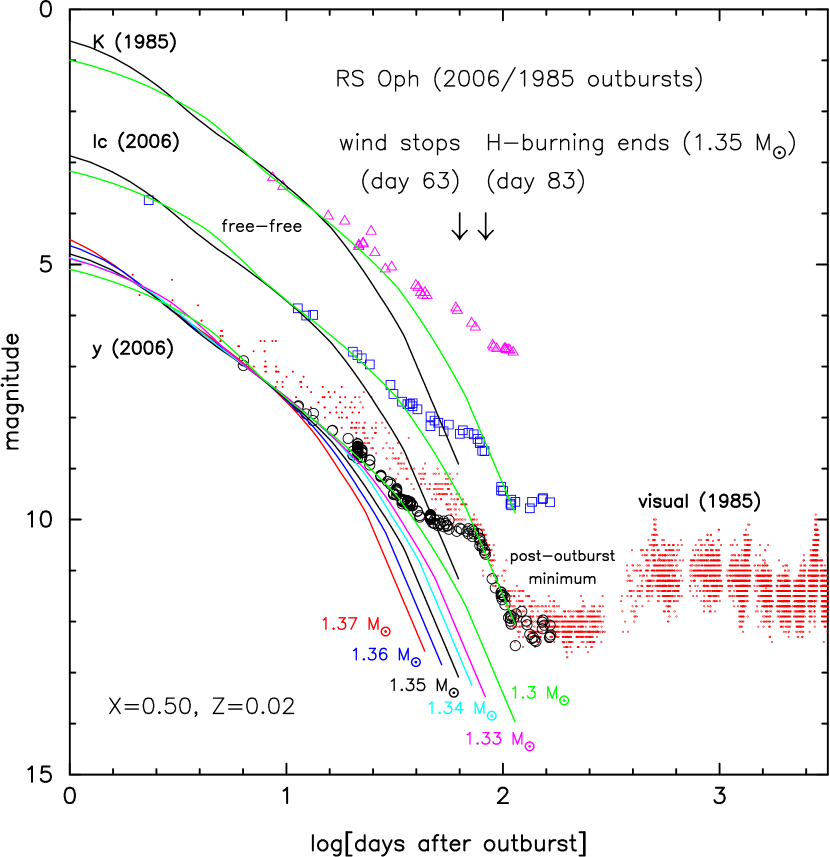
The free-free emission of optically thin ejecta is estimated by equation (9) in Hachisu & Kato (2006b). The calculated free-free light curves are shown in Figure 2. The decline rate of the light curve, i.e., the evolutionary speed depends very sensitively on the WD mass if its mass is very close to the Chandrasekhar mass (e.g., Kato, 1999; Hachisu & Kato, 2006a, b). This is because the WD radius is very sensitive to the increase in mass near the Chandrasekhar mass.
The timescale also depends weakly on the chemical composition of envelopes. Hydrogen depletion is expected. This is because, just after the unstable nuclear burning sets in, convection widely develops and mixes processed helium with unburned hydrogen. This mixing reduces the hydrogen content by 10%20% for massive WDs like in RS Oph (catalog ). The CNO abundance is not enriched in the recurrent novae, so we adopt the hydrogen content of and the solar metallicity of .
We added infrared -magnitudes of the 1985 outburst observed by Evans et al. (1988). Very little dependence of the light curve shape on the wavelength is a characteristic feature in the free-free emission light curves. However, the free-free light curve cannot reproduce the mid-plateau phase, so we introduce an irradiated disk in the next subsection.
3.2. The irradiated disk and companion
We assume an axi-symmetric disk with a size of
| (1) |
and a thickness of
| (2) |
where is the outer edge of the disk, is the effective radius of the inner critical Roche lobe for the WD component, is the height of the surface from the equatorial plane, is the distance from the symmetry axis, and is the power index which describes flaring-up of the disk edge (see, e.g., Schandl et al., 1997; Hachisu & Kato, 2001b). We also assume a companion red giant star with a radius of
| (3) |
where is the effective radius of the inner critical Roche lobe for the red giant component, its mass of , and the inclination angle of the binary, (e.g., Dobrzycka & Kenyon, 1994). Dobrzycka et al. (1996) suggested for the distance of 1.5 kpc.
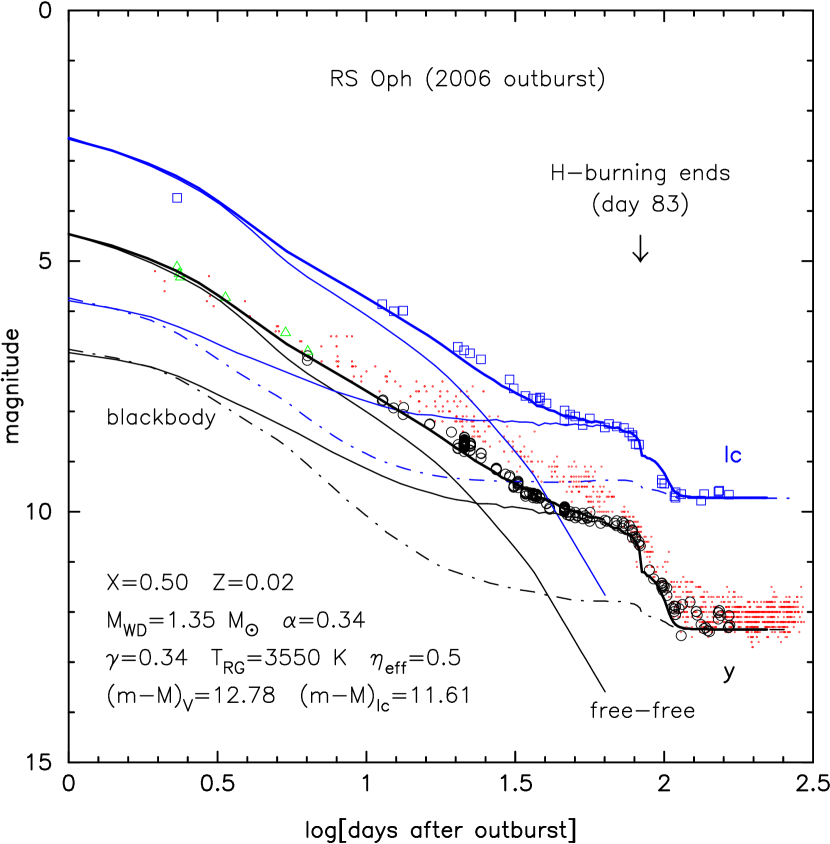
The disk surface absorbs UV and supersoft X-ray photons from the WD and emits a part of it as a thermal emission with a lower temperature than that of the WD photosphere. The resultant light curve depends mainly on the disk size (), the efficiency of irradiation ( radiated energyabsorbed energy), and also the radius of the RG, but depends very weakly on the other two parameters of and . Here, we assume and . The dependence on these parameters was widely discussed in the previous papers (e.g., Hachisu & Kato, 2001b, 2003a). The irradiation efficiency of the RG hardly affects the light curve as shown in Figure 3.
We have obtained three best fit models of the 2006 outburst in Table 2. The calculated light curves for the 50% efficiency are plotted in Figure 3. These models reproduce the mid-plateau phase and the sharp final decline identified as the end of hydrogen shell-burning. The turnoff date of day 83 in our WD model is very consisting with the supersoft X-ray turnoff on day observed with Swift (Osborne et al., 2006).
3.3. Distance
The distance is obtained from the light curve fitting both at the plateau phase and at the post-outburst minimum phase as shown in Figures 2 and 3. The disk luminosity depends mostly on the disk size, , and the irradiation efficiency, . We have changed these two parameters and calculated the brightness at the mid-plateau phase. Fitting the calculated brightness with the observation, we obtain the apparent distance moduli, i.e., and . Then we calculate the absorption from
| (4) |
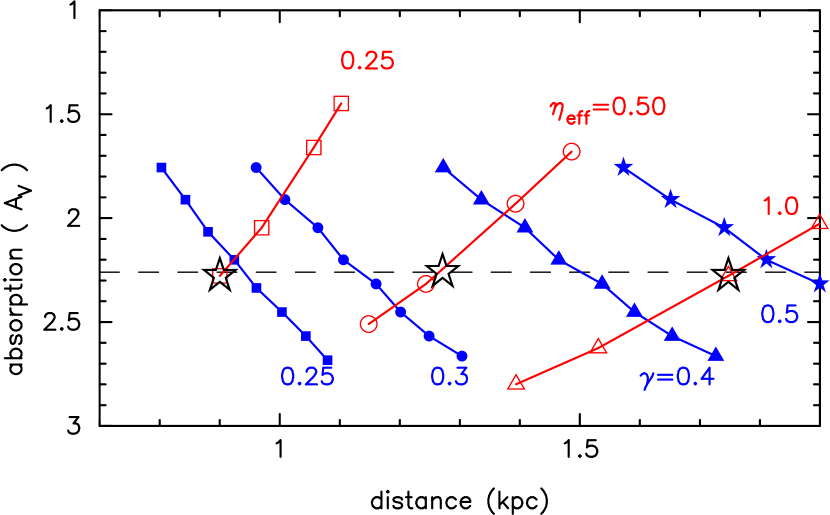
where we use (e.g., Rieke & Lebofsky, 1985). Once is obtained, the distance is calculated from . Thus, we obtained the absorption-distance relation for the irradiated disk as shown in Figure 4. We further restrict the distance with the observed absorption of (Snijders, 1987). The same method is applied to the companion star, in which we have changed the companion size, , and the effective temperature, . The absorption-distance relation for the companion is also plotted.
The largest ambiguity of our model is the irradiation efficiency of the disk. Here, the distances of 0.9, 1.3, and 1.7 kpc are derived for the three different assumed efficiency, i.e., 25%, 50%, and 100%, respectively. The actual efficiency is somewhere between 50% and 100%, so we have a reasonable distance of kpc.
4. Discussion
The decline rate of free-free light curve and the hydrogen burning turn-off date depend not only on the WD mass but also on the chemical composition of the envelope (Hachisu & Kato, 2006b). We have examined two other cases of hydrogen content, and , and found that the best fit models are obtained for and , respectively. So we conclude that the WD mass is .
There are still debates on the distance to RS Oph. In the previous outburst, Hjellming et al. (1986) estimated the distance to be 1.6 kpc from H I absorption-line measurements. Snijders (1987) also obtained the distance of 1.6 kpc assuming the UV peak flux is equal to the Eddington luminosity. Harrison et al. (1993) calculated a distance of 1290 pc from the -band luminosity. Hachisu & Kato (2001b) obtained a smaller distance of 0.6 kpc from the comparison of observed and theoretical UV fluxes integrated for the wavelength region of 911-3250 Å . This shorter distance is caused by their blackbody assumption, because the flux is much larger than the blackbody flux in this wavelength region. O’Brien et al. (2006) estimated the distance of 1.6 kpc from VLBA mapping observation with an expansion velocity indicated from emission line width. Monnier et al. (2006) estimated a shorter distance of pc assuming that the IR interferometry size corresponds to the binary separation. If we assume this corresponds to a circumbinary disk, however, a much larger distance is obtained. Therefore, our new value of kpc is consistent with other estimates.
References
- Dobrzycka & Kenyon (1994) Dobrzycka, D., & Kenyon, S. J. 1994, AJ, 108, 2259
- Dobrzycka et al. (1996) Dobrzycka, D., Kenyon, S. J., Proga, D., Mikołajewska, J., Wade, R. A. 1996, AJ, 111, 2090
- Evans et al. (1988) Evans, A., Callus, C. M., Albinson, J. S., Whitelock, P. A., Glass, I. S., Carter, B., & Roberts, G. 1988, MNRAS, 234, 755
- Fekel et al. (2000) Fekel, F. C., Joyce, R. R., Hinkle, K. H., & Skrutskie, M. 2000, AJ, 119, 1375
- Gallagher & Ney (1976) Gallagher, J. S., & Ney, E. P. 1976, ApJ, 204, L35
- Hachisu & Kato (2001a) Hachisu, I., & Kato, M. 2001a, ApJ, 553, L161
- Hachisu & Kato (2001b) Hachisu, I., & Kato, M. 2001b, ApJ, 558, 323
- Hachisu & Kato (2003a) Hachisu, I., & Kato, M. 2003a, ApJ, 588, 1003
- Hachisu & Kato (2004) Hachisu, I., & Kato, M. 2004, ApJ, 612, L57
- Hachisu & Kato (2005) Hachisu, I., & Kato, M. 2005, ApJ, 631, 1094
- Hachisu & Kato (2006a) Hachisu, I., & Kato, M. 2006a, ApJ, 642, L53
- Hachisu & Kato (2006b) Hachisu, I., & Kato, M. 2006b, ApJS, in press (astro-ph/0607609)
- Hachisu et al. (2000) Hachisu, I., Kato, M., Kato, T., & Matsumoto, K. 2000, ApJ, 528, L97
- Hachisu et al. (1996) Hachisu, I., Kato, M., & Nomoto, K. 1996, ApJ, 470, L97
- Hachisu et al. (1999a) Hachisu, I., Kato, M., & Nomoto, K. 1999a, ApJ, 522, 487
- Hachisu et al. (1999b) Hachisu, I., Kato, M., Nomoto, K., & Umeda, H. 1999b, ApJ, 519, 314
- Hachisu et al. (2003) Hachisu, I., Kato, M., & Schaefer, B. E. 2003, ApJ, 584, 1008
- Harrison et al. (1993) Harrison, T. E., Johnson, J. J., & Spyromilio, J. 1993, AJ, 105, 320
- Hjellming et al. (1986) Hjellming, R. M., van Gorkom, J. H., Seaquist, E. R., Taylor, A. R., Padin, S., Davis, R. J., & Bode, M. F. 1986, ApJ, 305, L71
- Kato (1983) Kato, M. 1983, PASJ, 35, 507
- Kato (1997) Kato, M. 1997, ApJS, 113, 121
- Kato (1999) Kato, M. 1999, PASJ, 51, 525
- Kato & Hachisu (1994) Kato, M., & Hachisu, I., 1994, ApJ, 437, 802
- Krautter et al. (1996) Krautter, J., Ögelman, H., Starrfield, S., Wichmann, R., & Pfeffermann, E. 1996, ApJ, .456, 788
- Monnier et al. (2006) Monnier, J.D. et al. 2006, ApJ, in press (astro-ph/0607399)
- Narumi et al. (2006) Narumi, H., Hirosawa, K., Kanai, K., Renz, W., Pereira, A., Nakano, S., Nakamura, Y., & Pojmanski, G. 2006, IAU Circ., 8671
- Nomoto (1982) Nomoto, K. 1982, ApJ, 253, 798
- O’Brien et al. (2006) O’Brien, T. J. et al. 2006, Nature, 442, 279
- Osborne et al. (2006) Osborne, J. P., et al. 2006, ATel, 838
- Rieke & Lebofsky (1985) Rieke, G. H., & Lebofsky, M. J. 1985, ApJ, 288, 618
- Schandl et al. (1997) Schandl, S., Meyer-Hofmeister, E., & Meyer, F. 1997, A&A, 318, 73
- Snijders (1987) Snijders, M. A. J. 1987, RS Ophiuchi (1985) and the Recurrent Nova Phenomenon, ed. M. F. Bode (Utrecht: VNU Science Press), 51