Size and properties of the narrow-line region in Seyfert-1 galaxies from spatially-resolved optical spectroscopy ††thanks: Based on observations made with ESO Telescopes at the Cerro Paranal Observatory under programme ID 72.B-0144 and the La Silla Observatory under programme ID 073.B-0013
Abstract
Context. Spatially resolved emission-line spectroscopy is a powerful tool to determine the physical conditions in the narrow-line region (NLR) of active galactic nuclei (AGNs). We recently used optical long-slit spectroscopy to study the NLRs of a sample of six Seyfert-2 galaxies. We have shown that such an approach, in comparison to the commonly used [O iii] narrow-band imaging alone, allows us to probe the size of the NLR in terms of AGN photoionisation. Moreover, several physical parameters of the NLR can be directly accessed.
Aims. We here apply the same methods to study the NLR of six Seyfert-1 galaxies and compare our results to those of Seyfert-2 galaxies.
Methods. We employ diagnostically valuable emission-line ratios to determine the physical properties of the NLR, including the core values and radial dependencies of density, ionisation parameter, and reddening. Tracking the radial change of emission-line ratios in diagnostic diagrams allows us to measure the transition between AGN-like and H ii-like line excitation, and thus we are able to measure the size of the NLR.
Results. In the diagnostic diagrams, we find a transition between line ratios falling in the AGN regime and those typical for H ii regions in two Seyfert-1 galaxies, thus determining the size of the NLR. The central electron temperature and ionisation parameter are in general higher in type-1 Seyferts than in type 2s. In almost all cases, both electron density and ionisation parameter decrease with radius. In general, the decrease is faster in Seyfert-1 galaxies than in type 2s. In several objects, the gaseous velocity distribution is characteristic for rotational motion in an (inclined) emission-line disk in the centre. We give estimates of the black hole masses. We discuss our findings in detail for each object.
Key Words.:
Galaxies: active – Galaxies: nuclei – Galaxies: Seyfert1 Introduction
The cores of active galaxies, most likely powered by accretion onto supermassive black holes (BH), are surrounded by two emission-line regions; the broad-line region (BLR) in proximity to the BH, and the narrow-line region (NLR) at larger distances from the nucleus. The study of both BLR and NLR provides us with important information on the nature and origin of these cloud systems, on their link with the host galaxy, and on their cosmological evolution. Determination of their velocity field and distance from the nucleus also enables us to estimate BH masses. While the BLR is too close to the nucleus, the NLR of many AGN is spatially resolved, and we can thus extract information on the NLR properties by performing spatially resolved spectroscopy. This method is a powerful approach to measure the physical conditions in the NLR and surrounding regions [e.g. Wilson et al. (1989); Robinson et al. (1994); Radovich et al. (1998); Schulz et al. (1999); Fraquelli et al. (2000); Barth et al. (2001); Sosa-Brito et al. (2001); Temporin et al. (2003); Ciroi et al. (2005)].
While [O iii] 5007Å (hereafter [O iii]) narrow-band imaging is commonly used to study the NLRs of active galaxies, we have shown in Bennert et al. (2006a) and Bennert et al. (2006b) (hereafter paper I & II) that this emission can be contaminated by contributions from star formation and that different sensitivities can lead to different size measurements of the NLR. Using long-slit spectroscopy, we developed methods to probe the AGN-photoionisation of the NLR and thus, its “real” size. From spatially resolved spectral diagnostics, we find a transition between central line ratios falling into the AGN regime and outer ones in the H ii-region regime for two objects. Applying CLOUDY photoionisation models (Ferland et al., 1998), we show that the observed distinction between H ii-like and AGN-like ratios represents a true difference in ionisation source and cannot be explained by variations of physical parameters such as ionisation parameter, electron density or metallicity. We interpret it as a real border between the NLR, i.e. the central AGN-photoionised region, and surrounding H ii regions. In addition, several physical parameters of the NLR such as reddening, ionisation parameter, electron density, and velocity can be directly accessed and analysed as a function of distance from the nucleus. We find that both the electron density and the ionisation parameter decrease with radius. The differences between the reddening distributions determined from the continuum slope and the Balmer decrement argue in favour of dust intrinsic to the NLR clouds with varying column density along the line of sight. The NLR and stellar velocity fields are similar and indicate that the NLR gas is distributed in a disk rather than a sphere.
Here, we apply the same methods to a sample of six Seyfert-1 galaxies to probe the size of the NLR and derive physical properties such as reddening, ionisation parameter, electron density, and velocity in type-1 AGNs. We discuss their variations with distance from the nucleus and compare the results for Seyfert 1s and Seyfert 2s, allowing to test the facets of the unified model of AGNs. A detailed comparison of our results with literature data is given for each object [Appendix; see also Bennert (2005)].
2 Observations, Reduction, and Analysis
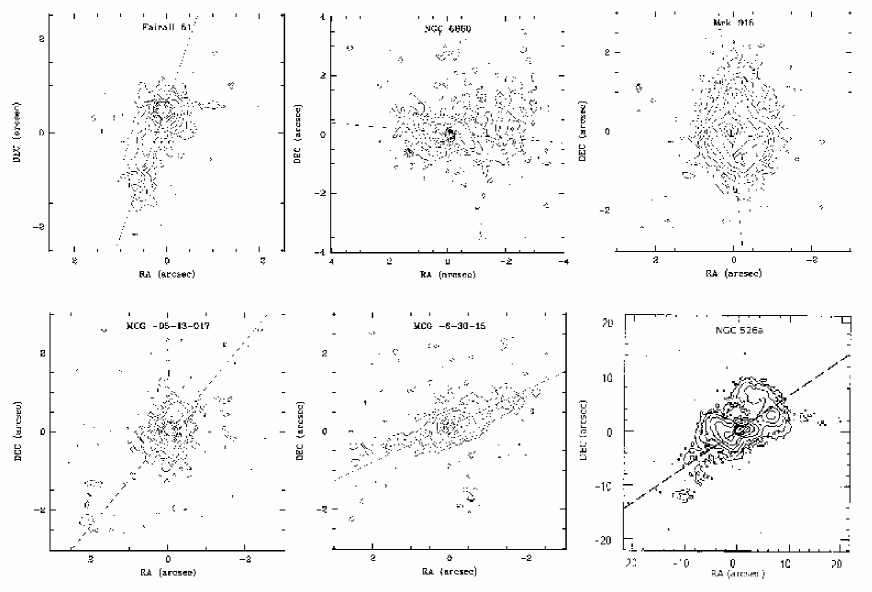
The spectra were obtained with FORS1@VLT and EMMI@NTT. Relevant information on the sample and observations is summarised in Tables 1 and 2. The [O iii] images with the slit position overlaid are shown in Fig. 1.
As the observations, reduction, and analysis were already described in detail in paper II, we here discuss the special treatment of the Seyfert-1 spectra only.
| Fairall 51 | NGC 6860 | Mrk 915 | NGC 526a | MCG -05-13-017 | MCG -6-30-15 | |
| altern. name | ESO 140-G043 | ESO 143-G009 | MCG -02-57-023 | MCG -06-04-019 | ESO 362-G018 | ESO 383-G035 |
| (J2000) | 18h44m540 | 20h08m469 | 22h36m465 | 01h23m544 | 05h19m358 | 13h35m538 |
| (J2000) | -62°21′53″ | -61°06′01″ | -12°32′43″ | -35°03′56″ | -32°39′28″ | -34°17′44″ |
| i. (°)333Host galaxy inclination [De Vaucouleurs et al. (1991); RC3] | 64 | 61 | 80 | 55 | 54 | 57 |
| p.a. (°)444Position angle of host galaxy major axis (RC3) | 162 | 34 | 166 | 112 | 160 | 116 |
| (km s-1) | 425510 | 446224 | 72282 | 572539 | 379030 | 232315 |
| (km s-1)555Velocity relative to the 3K background using the NED velocity calculator | 4228 | 4377 | 6863 | 5446 | 3620 | 2595 |
| dist. (Mpc)666Distance in Mpc, using and = 71 km s-1 Mpc-1 | 60 | 62 | 98 | 78 | 52 | 37 |
| lin. scale (pc/″)777Linear scale using distance and = 4.848 10-6 | 283 | 293 | 454 | 362 | 243 | 175 |
| morphology | (R’_2)SB(rs)b | (R’)SB(r)ab | Sb | S0pec? | S0/a | E-S0 |
| AGN type (NED) | Sy1 | Sy1 | Sy1 | Sy1.5 | Sy1.5 | Sy1.2 |
| AGN type (our spectra) | Sy1 | Sy1.5 | Sy1.5 | Sy1.9 | Sy1.5 | Sy1.2 |
| (mag)888Foreground Milky Way reddening used for reddening correction (Schlegel et al., 1998) | 0.108 | 0.041 | 0.063 | 0.028 | 0.017 | 0.062 |
| (mag) | 14.7 | 13.68 | 14.82 | 14.5 | 12.5 | 13.7 |
| Fairall 51 | NGC 6860 | Mrk 915 | NGC 526a | MCG -05-13-017 | MCG -6-30-15 | |
| telescope | NTT | NTT | NTT | NTT | NTT | VLT |
| date (beg.) | 14/15-Sep-04 | 15/16-Sep-04 | 14/15-Sep-04 | 16-Sep-04 | 17-Sep-04 | 25-Feb-04 |
| exp. time blue (s)999Total integration time. At the VLT, the blue and red spectral range were covered in one exposure. | 3000 | 6000 | -101010The spectra taken in the blue wavelength range were corrupted due to instrumental problems. | 3000 | 3600 | 1800 |
| exp. time red (s)a | 3600 | 3600 | 3000 | 2400 | 3000 | 1800 |
| seeing | 1″ | 1″ | 1″ | 1″ | 1″ | 15 |
| slit width | 1″ | 1″ | 1″ | 1″ | 1″ | 1″ |
| FWHMinstr (km s-1) | 250 | 250 | 250 | 250 | 250 | 590 |
| p.a. (°)111111Position angle of the slit | 160 | 85 | 5 | 123 | 140 | 115 |
| hel. corr. (km s-1)121212This heliocentric correction was added to the measured radial velocities. | -2 | 0 | -4 | +17 | +29 | +12 |
| average (pixel)131313Number of pixel rows which were averaged | 3 | 3 | 3 | 3 | 3 | 7 |
| scale141414Formal spatial resolution of final extracted spectra | 11 1″ | 11 1″ | 11 1″ | 11 1″ | 11 1″ | 14 1″ |
2.1 Subtracting the stellar population
As discussed in paper I & II, removing the contribution of the stellar population is one of the first and most critical steps in the analysis of AGN emission-line spectra, at least in Seyfert-2 galaxies.
For Seyfert-1 galaxies, the procedure described in paper I & II may not be simply applicable: The AGN featureless continuum can be very strong, especially in the central parts where the broad emission lines are seen. Thus, a stellar template cannot simply be scaled to the continuum value in these regions as the contribution of the underlying stellar population would be overestimated.
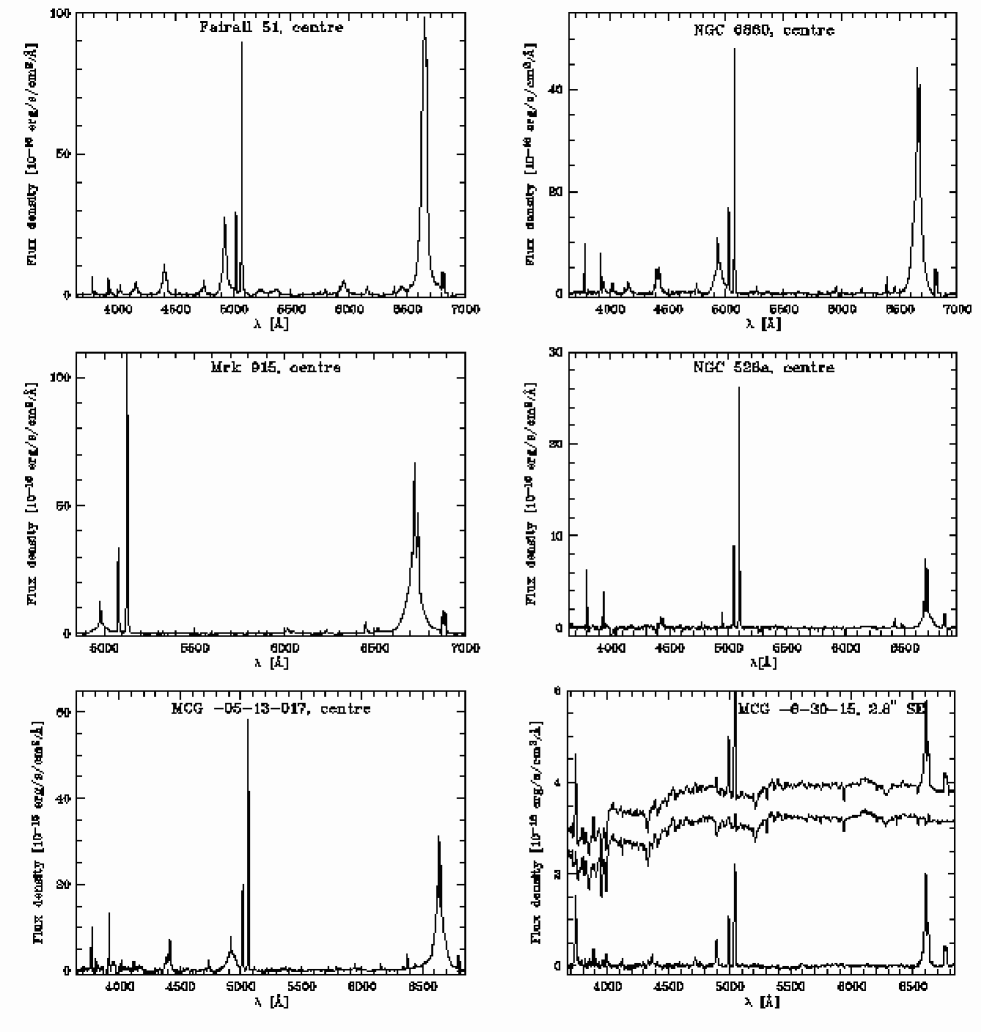
However, for type-1 AGNs, the AGN continuum and the broad and narrow emission lines often completely dominate the spectrum. We did not find signs of strong underlying Balmer absorption lines. In some cases, faint absorption is visible in Ca ii H&K and in Na i D. Some of the Na i D absorption may be of interstellar origin. We consider the underlying stellar absorption as negligible compared to the central emission line fluxes. Moreover, it was difficult to derive a suited high S/N template.
Only for MCG -6-30-15, a correction of the stellar population was both necessary and possible. We were able to gain a suited template free of contaminating emission lines (Fig. 2). Thus, a correction of underlying stellar absorption lines in the Seyfert-1 galaxies were applied only to MCG -6-30-15. We scaled the template to the continuum as we do not know the contribution of a featureless continuum. The reddening measure using the continuum slope variation relative to the stellar template (see paper I & II) was, among the Seyfert-1 galaxies, only determined for MCG -6-30-15.
2.2 Fe ii contamination
When studying optical spectra of type-1 AGNs, another issue that needs to be taken into account is the contribution of broad Fe ii emission. To probe the contribution of Fe ii to the observed type-1 spectra, we used the Fe ii template of Véron-Cetty et al. (2004). It was rebinned to the same resolution and shifted to the object’s redshift. We used several scaling factors and subtracted the template. The residual continuum was searched for signs of remaining Fe ii emission. However, in all our type-1 objects, the contribution of Fe ii seems to be negligible and for most scalings, we artificially induced “Fe ii absorption lines”, indicating that the scaling was too high. Thus, no Fe ii template was finally subtracted as we believe that the Fe ii contribution is negligible in our Seyfert-1 galaxies.
2.3 Emission-line fluxes and reddening
To determine the fluxes of the pure emission-line spectra, the same general procedure as for the Seyfert-2 galaxies described in paper I & II was applied.
However, for the Seyfert-1 galaxies discussed here, the fitting procedure is more difficult, due to the additional broad lines of the BLR underlying all permitted emission of the NLR. Broad H lines are observed in the central spectra of all our type-1 objects (according to their classification as Sy1, Sy1.2 or Sy1.5). Broad H emission is seen in all type 1s with the exception of NGC 526a, classifying it as Sy1.9 (see also Section A.4).
A common approach to disentangle the narrow and broad permitted lines is to use the profile of the forbidden narrow lines such as [O iii] as template for the permitted narrow line, scaled to the appropriate height. A second Gaussian (a broad one) is additionally used to fit the permitted broad line profile. During the fitting procedure, we found that the use of two Gaussians, a broad and a narrow one, was in most cases not suited to fit the broad wings. For all lines with underlying broad emission, we added a third Gaussian: We fitted a narrow Gaussian, one with an intermediate width, and a broad one for an optimal total fit to the observed emission-line profiles.
Three Gaussians have already been used by other authors to fit the H and H lines in Seyfert-1 galaxies [e.g. Reynolds et al. (1997); Sulentic et al. (2002)]. Emission-line profiles represent line-of-sight integrations of several kinematic components and even for “narrow” lines, considerable profile structure is measured at sufficient resolution [e.g. Vrtilek & Carleton (1985); Whittle (1985); Schulz & Henkel (2003)]. Gaussian fits or Lorentz fits are commonly used when single component fits fail. Whittle (1985) already describe the non-Gaussian nature of observed [O iii] line profiles “which revealed a stronger base relative to the core than Gaussians”. A Lorentz profile which has broader wings compared to a Gaussian seems to be better suited as has been shown by Véron-Cetty et al. (2001) for the broad emission lines in narrow-line Seyfert-1 galaxies and by Schulz & Henkel (2003) for narrow emission lines in Seyfert-2 galaxies. Bennert et al. (2004) suggest the use of -Lorentzians which allow to fit both permitted and forbidden lines by adjusting an additional parameter . Sulentic et al. (2002) studied the broad H line in several AGN types and found that objects with full-width at half maximum (FHWM) 4000 km s-1 are well fitted by a Lorentz function, while AGNs with FWHM 4000 km s-1 are better fitted if two broad-line components are used: A “classical” broad-line component and a very broad/redshifted component. Our results are in agreement with this trend: All objects with broad emission lines in both H and H have FWHM 4000 km s-1 and had to be fitted by two broad-line components.
To conclude, we used single Gaussians to fit the narrow lines and three Gaussians to fit narrow lines with underlying broad emission which yields a very good result, taking into account the low resolution of our spectra.
In all but one case (MCG -6-30-15), the permitted profiles show a clear separation between broad underlying emission and a narrow “peak”. Thus, for most Seyfert-1 galaxies, we were able to distinguish between the broad and narrow emission using three Gaussians with one resembling the shape of forbidden narrow lines. For MCG -6-30-15, the only type-1 observed with the lower resolution of VLT/FORS1, the profile fitting to the permitted Balmer lines could not successfully disentangle the broad and narrow line. Thus, we applied a Gaussian fit to forbidden lines only (except for the [N ii] 6548,6583 Å lines which are blended by H). In the central spectra, the broad emission of H and H even affect the adjacent [O iii] and [S ii] 6716,6731 Å lines. In those cases, we subtracted the broad underlying wing by extrapolation. As a consequence, the only emission-line ratio we were able to derive directly is that of the two forbidden sulphur lines to measure the electron density. The narrow H and H emission-line fluxes are needed to plot diagnostic line-ratio diagrams, thus we cannot present these results for MCG -6-30-15. Moreover, the ionisation parameter strongly depends on the reddening value. As we cannot estimate it from the narrow H/H ratio, we used as a first guess the reddening slope determined by matching the stellar template to the NLR spectra.
3 Results and Discussion
3.1 Nuclear spectra
The central spectra of the galaxies in our sample are shown in Fig. 2. Table 3 lists the observed and reddening-corrected line-intensity ratios relative to H from the nuclear spectrum (uncorrected for slit losses). For pairs of lines ([O iii], [O i], and [N ii]) with a fixed line ratio (3:1), only the brighter line is used. (Note that all ratios correspond to narrow lines.) Emission-line ratios of the strongest (narrow) lines as a function of distance from the centre can be found online for each individual galaxy (excluding MCG -6-30-15 as we were not able to disentangle the broad and narrow Balmer lines).
| Line | Fairall 51 | NGC 6860 | Mrk 915 | NGC 526a | MCG -05-13-017 | |||||
|---|---|---|---|---|---|---|---|---|---|---|
| Å | 0.94 | 1.21 | 1.60 | 2.04 | –171717Not covered by wavelength range | –b | 3.20 | 4.20 | 1.84 | 2.62 |
| Å | 0.86 | 1.32 | 1.18 | 1.45 | –b | –b | 1.80 | 2.27 | 2.54 | 3.43 |
| 3967 Å | 0.08 | 0.11 | 0.24 | 0.29 | –b | –b | –181818Underlying absorption lines | –c | 0.28 | 0.37 |
| 4363 Å | 0.40 | 0.49 | 0.53 | 0.59 | –b | –b | 0.65 | 0.73 | 1.26 | 1.46 |
| 4686 Å | 0.41 | 0.44 | 0.29 | 0.30 | –b | –b | 0.33 | 0.34 | 0.48 | 0.50 |
| 5007 Å | 15.58 | 14.47 | 8.84 | 8.53 | 12.72 | 11.82 | 16.35 | 15.71 | 17.15 | 16.29 |
| 5721 Å | 0.49 | 0.34 | 0.14 | 0.12 | 0.15 | 0.11 | 0.11 | 0.09 | 0.37 | 0.29 |
| 6087 Å | 0.83 | 0.49 | 0.20 | 0.16 | 0.27 | 0.16 | 0.09 | 0.07 | 0.47 | 0.33 |
| 6300 Å | 0.92 | 0.51 | 0.71 | 0.53 | 0.81 | 0.45 | 0.74 | 0.54 | 1.19 | 0.79 |
| 6375 Å | 0.81 | 0.43 | 0.08 | 0.06 | 0.17 | 0.09 | 0.06 | 0.04 | 0.38 | 0.25 |
| H | 5.60 | 2.87 | 3.95 | 2.87 | 5.60 | 2.87 | 4.11 | 2.87 | 4.57 | 2.87 |
| 6583 Å | 5.57 | 2.84 | 3.38 | 2.44 | 3.70 | 1.88 | 3.14 | 2.18 | 3.02 | 1.89 |
| 6716 Å | 1.47 | 0.73 | 1.28 | 0.92 | 1.29 | 0.64 | 1.18 | 0.81 | 1.01 | 0.62 |
| 6731 Å | 1.68 | 0.84 | 1.15 | 0.82 | 1.31 | 0.65 | 1.16 | 0.80 | 1.19 | 0.73 |
In Table 4, we give the reddening-corrected H luminosity and summarise the results from dereddened line ratios such as the electron temperature 191919Derived from the [O iii](4959 Å+5007 Å)/4363 Å emission-line ratio, the reddening value , the electron density , and the ionisation parameter for the nuclear spectra of all objects. The parameters represent an average over the central several hundred parsecs.
The temperature was, in most objects, only determined for the nuclear spectrum due to the faintness of the involved [O iii] 4363 Å emission line in the outer spectra. In two objects, we were able to derive the electron temperature in the inner few arcseconds (NGC 526a, MCG -05-13-017) where it stays roughly constant within the errors or scatters without showing a clear dependency on radius. The central temperature was used to apply a correction to the electron density. In those cases in which no temperature was measured we used K or an average temperature derived from the other galaxies instead.
| Fairall 51 | NGC 6860 | Mrk 915 | NGC 526a | MCG -05-13-017 | MCG -6-30-15 | |
|---|---|---|---|---|---|---|
| (10-14 erg s-1 cm-2) | 212 | 80.5 | 363 | 30.1 | 80.6 | –202020No deconvolution of underlying broad Balmer line possible |
| (1039 erg s-1) | 939 | 372 | 41630 | 181 | 252 | –a |
| (K) | 22200400 | 36325250 | –212121Not covered by wavelength range | 233301700 | 525003000 | –a |
| (mag)222222Note that this central value is not necessarily representative for the reddening within the NLR; for more details on reddening see Table 6 | 0.590.03 | 0.280.02 | 0.590.02 | 0.320.03 | 0.410.03 | 0.30.02232323Determined from reddening of continuum slope relative to template |
| (cm-3) | 143040 | 101550 | 570 (1045)35242424[S ii] 6731 Å is slightly truncated by telluric absorption bands.,252525Using = 10000 K and, in brackets, 33590, respectively | 83570e | 246055 | 300 (550)40f |
| (10-3) | 9.250.9 | 2.730.04 | –b | 2.890.05 | 4.280.1 | 2.950.04 |
3.1.1 Comparison of Sy1 and Sy2 properties
Comparing the results for the central spectra of type-1 and type-2 Seyferts (paper II) shows that the line ratios are similar in all objects. There are no significant differences between type-1 and type-2 galaxies with the exception of the emission lines of oxygen and iron which are on average higher in the Seyfert-1 galaxies: [O iii] 4363 Å/H 0.820.2 (4 Sy1s) versus 0.190.02 (4 Sy2s); [O iii] 5007 Å/H 13.41.4 (5 Sy1s) versus 10.30.6 (6 Sy2s); [Fe vii] 5721 Å/H 0.190.05 (5 Sy1s) versus 0.140.1 (2 Sy2s); [Fe vii] 6087 Å/H 0.240.07 (5 Sy1s) versus 0.140.06 (4 Sy2s); [Fe x] 6375 Å/H 0.170.07 (5 Sy1s) versus 0.030.01 (4 Sy2s).
The reddening of the nuclear spectrum is on average higher in the Seyfert 2s in our sample ( 0.550.07 mag versus 0.420.06 mag). The electron densities are comparable in both objects ( 1070180 cm-3 versus cm-3). The ionisation parameter is on average higher in Seyfert-1 galaxies [1.2) versus (2.660.2)], also when excluding the exceptional high value of seen in Fairall 51 [0.4)], but the distributions overlap.
Moreover, the comparison shows that higher temperatures occur in type-1 objects ( 335907070 K versus 14470440 K). Note that the difference in the flux ratio of [O iii] 4363 Å/[O iii] 5007 Å seen between Seyfert-1 and Seyfert-2 galaxies has been interpreted by Osterbrock (1978) as a difference in densities ( cm-3 for Seyfert-1 galaxies and cm-3 for Sy2s). However, we interpret it as a difference in temperature in agreement with the suggestions by Heckman (1979) and Cohen (1983) ( K for Sy1s; K for Sy2s).
Differences between the NLRs in Seyfert-1 and Seyfert-2 galaxies are known from both imaging and spectroscopy and have been discussed by various authors on the basis of the unified model [e.g. Mulchaey et al. (1996b); Schmitt (1998); Nagao et al. (2001); Schmitt et al. (2003b)]. Statistics have shown that high-ionisation emission lines as well as those with high critical densities tend to be stronger in Seyfert-1 galaxies than in type 2s [e.g. Shuder & Osterbrock (1981); Schmitt (1998); Nagao et al. (2000)]. One explanation is that the highly-ionised gas clouds are located close to the nucleus and can be hidden by the dust torus (Murayama & Taniguchi, 1998a, b; Nagao et al., 2000). On the contrary, Schmitt (1998) proposed that the NLR sizes in Seyfert-1 galaxies are (intrinsically) smaller than those of type 2s (and not only due to projection effects): If the torus of Seyfert-1 galaxies is more likely to be aligned with the galaxy plane (but has random orientations in Sy2s) and the ionisation cone in type-1 AGNs is thus perpendicular to the galaxy plane, there is a smaller number of ionisation-bounded clouds in Seyfert-1 galaxies. Based on a sample of 355 Seyfert galaxies, Nagao et al. (2001) favour the first explanation.
Compared to the Seyfert-2 galaxies, the Seyfert 1s in our sample show on average higher iron emission line fluxes such as [Fe vii] and [Fe x] relative to H, i.e. high-ionisation lines (upper ionisation potential 125 eV and 262.1 eV, respectively), as well as higher [O iii] 4363 Å intensities, a line with a rather low ionisation potential compared to these iron lines (upper ionisation potential of 54.9 eV) but high critical densities (3.3 cm-3; Table 3), in agreement with the results of Nagao et al. (2001). Moreover, we find Seyfert-1 galaxies tending to have higher electron temperatures and ionisation parameters in their nuclear spectra. While the central electron densities are comparable taking into account the large scatter of electron densities within the individual Seyfert 1 and Seyfert 2 galaxies, the nuclear reddening is on average higher in the six Seyfert-2 galaxies.
The higher average central ionisation parameter is related to the observation of stronger fluxes of high-ionisation lines in Seyfert-1 galaxies and can be explained likewise: If the high-ionisation lines, along with the Balmer and [O iii] emission lines, originate in gas clouds close to the BLR, they may be partly hidden by the dust torus in Seyfert-2 galaxies. Our observations of higher nuclear reddening in Seyfert-2 galaxies argue in favour of this scenario proposed by Nagao et al. (2001). It is reasonable to assume that lines with high ionisation potential arise closer to the photoionising source, leading to a stratification of emission lines. This is comparable to what has been found for the BLR using reverberation-mapping: Different lines have different time lags with lines from high-ionised gas responding earlier, showing that the ionisation structure is radially stratified [e.g. Peterson (1993)].
The reason that we observe comparable nuclear densities in both type-1 and type-2 Seyferts may lie in the correction of the central electron temperature: When comparing the measured electron densities directly, i.e. not correcting for the temperature, we get on average slightly lower densities for Seyfert-1 galaxies (which have the higher central temperatures): cm-3 versus 160 cm-3. Taking into account the critical densities of the involved forbidden emission lines, we cannot rule out that the temperature we measure corresponds to a region closer to the centre than the electron density (if the density increase towards the centre): While the critical densities of the [O iii] lines are high [ cm-3 for 4363 Å, cm-3 for 5007 Å], they are significantly lower for the [S ii] 6716,6731 Å lines (1500-3900 cm-3). It implies that while the [O iii] lines are still emitted in a dense central region with e.g. cm-3, allowing us to measure the temperature close to the nucleus, both [S ii] lines are collisionally de-excited. Thus, the flux we measure in these lines comes from regions with lower densities further out along our line-of-sight.
The galaxies of the present sample underscore the so-called temperature problem [e.g. Storchi-Bergmann et al. (1996)] as it is known in photoionisation modelling. This generally refers to the problem that photoionisation models underpredict the temperature in the NLR clouds, as measured by the ratio [O iii] 4363/5007 Å. Solutions include the reduction of oxygen (metal) abundances (leading to increased heating) and/or the presence of dust within the NLR clouds (Komossa & Schulz, 1997), or the presence of a significant fraction of matter-bounded clouds within the NLR (Binette et al., 1996). The presence of an inner high density component to solve the temperature problem was rejected by Komossa & Schulz (1997) because such a component would strongly boost [O i] 6300 Å. Indeed, inspecting the dependence of [O i] on radius, for our sample we do not find evidence for strongly increased [O i] emission in the core, or at a certain radius. The three proposed solutions appear to be consistent with our data, even though we do not directly measure the metal abundances or the fraction of matter-bounded clouds.
3.2 Black hole masses
BH masses can be estimated using several methods. First, we estimated BH masses from the luminosity at 5100Å using the empirical formula found by Peterson et al. (2004) (in Table 5 denoted as ):
To obtain , we multiplied 5100Å by the monochromatic flux at the (redshifted) 5100Å continuum of the nuclear spectrum. We used the broad H to H ratio to correct for the reddening of the luminosity (except for MCG -6-30-15 for which we used the continuum reddening instead).
Another estimation of the central BH mass is obtained by first estimating the radius of the BLR (Kaspi et al., 2005) (eq. 2):
and then calculating the virial reverberation mass, correcting by the empirical factor of [derived by normalising the AGN relationship to the relationship for quiescent galaxies, Peterson et al. (2004)]:
(in Table 5 denoted as ). The FWHM of the broad H emission line was determined using only two fits to the observed H line, one for the narrow H component and one for the broad one. For MCG -6-30-15, where we could not disentangle the broad and the narrow H component, we used a fit to the total line profile and thus, the BH mass estimation () can be considered as a lower limit (the line is dominated by the broad component such an approach is reasonable). Note that using the empirical factor of instead of [as previously assumed for an isotropic velocity dispersion and = FWHM/2; e.g. Netzer et al. (1990)] results in a 1.8 times higher BH mass (Peterson et al., 2004).
Third, for comparison, we estimated BH masses from the stellar velocity dispersion [; e.g. Merritt & Ferrarese (2001)] using the formula from Tremaine et al. (2002):
The stellar velocity dispersions for five of our six Seyfert-1 galaxies were derived by taking the average of ’s obtained by Garcia-Rissmann et al. (2005) through two different methods (direct fitting and cross-correlation). Note that their was measured within the aperture of 2″25. However, we did not correct for the aperture size [see Tremaine et al. (2002) for an extensive discussion on this topic].
The results are summarised in Table 5. The difference in the derived BH masses for the first two methods can be as high as a factor of 3 which is in the range of the 3 error. and are in agreement to within 1 for most galaxies. For NGC 526a, is significantly larger (by a factor 8) than . On the other hand, for MCG -6-30-15, the is by a factor of 3 smaller than but in agreement with within the errors. However, all these values were derived from statistical formulae from which individual galaxies may deviate quite a lot.
We searched the literature for other BH mass estimations for our target galaxies but were successful only for MCG -6-30-15 for which the results agree within the errors (see Appendix A.6).
| Galaxy | FWHMHβ282828Broad H of 2 component fit. The FWHMs of the corresponding narrow H component of the five galaxies (excluding MCG -6-30-15) in the order of listing are: 444, 480, 427, 406, and 445 km s-1, respectively. | ||||
|---|---|---|---|---|---|
| (1044 erg s-1) | (km s-1) | (108 ) | (108 ) | (108 ) | |
| Fairall 51 | 1.530.2 | 3330300 | 1.1 (+0.4-0.3) | 0.9 (+0.4-0.3) | –292929No measurement available in literature |
| NGC 6860 | 0.440.05 | 5920600 | 0.40.1 | 1.2 (+0.6-0.4) | 0.4 (+0.5-0.2) |
| Mrk 915 | 1.680.2 | 4560500 | 1.1 (+0.4-0.3) | 1.8 (+0.9-0.6) | 0.6 (+0.9-0.4) |
| NGC 526a | 0.170.02 | –303030No broad H line | 0.19 (+0.09-0.07) | –d | 1.6 (+1.2-0.8) |
| MCG -05-13-017 | 0.410.04 | 5240500 | 0.37 (+0.13-0.11) | 0.9 (+0.4-0.3) | 0.24 (+0.15-0.11) |
| MCG -6-30-15 | 0.270.03 | 1990200 | 0.27 (+0.11-0.09) | 0.1 (+0.05-0.04)313131This is a lower limit for the BH mass since the narrow H component was not removed. | 0.08 (+0.07-0.05) |
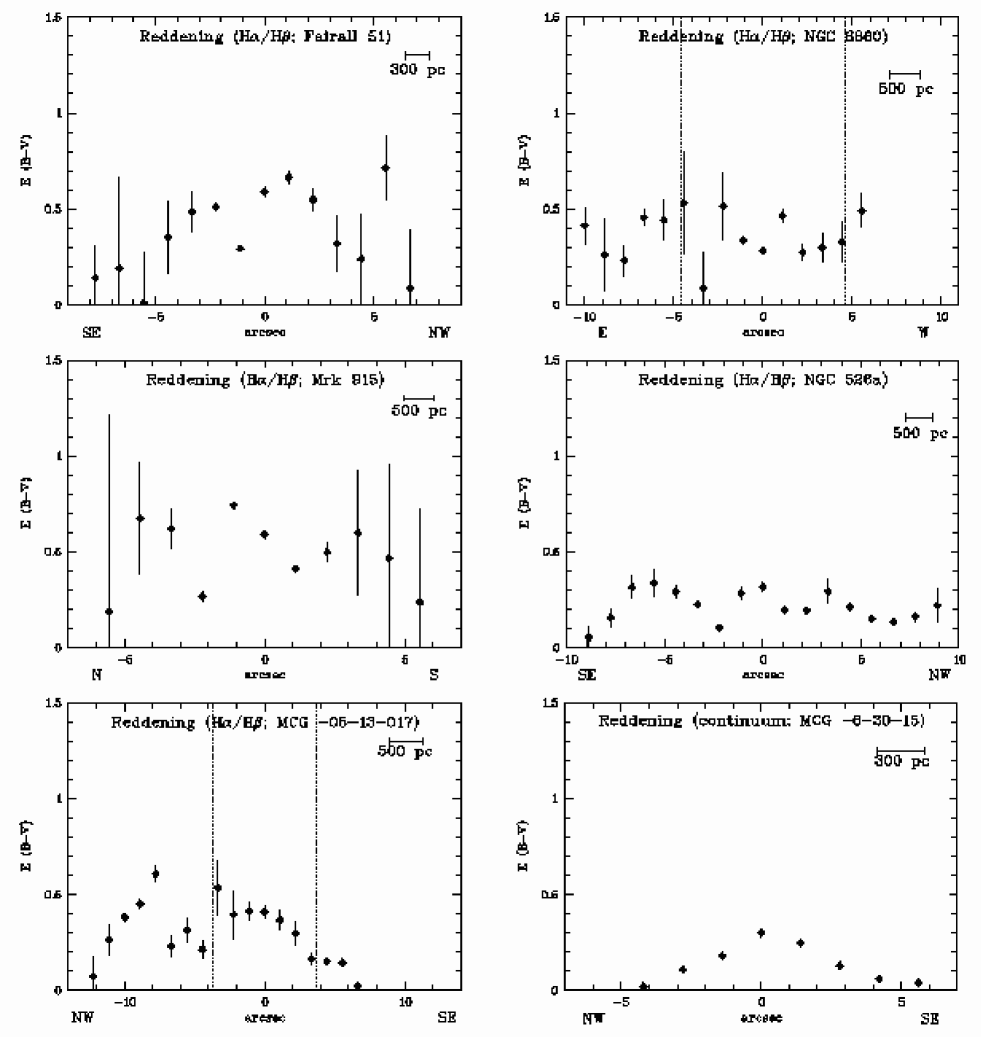
3.3 Reddening distribution
The reddening was derived from the recombination value of the narrow H/H emission-line ratio except for MCG -6-30-15 where we could not disentangle the broad and narrow Balmer lines (in the central 3″). Instead, we show for this object the reddening distribution of the continuum with respect to the stellar template (see also paper I & II). On the contrary, the continuum slope reddening is not available for the other type 1s as no stellar template was fit. While the nuclear reddening is given in Table 4, we give in Table 6 the highest reddening value within the NLR, the distance from the centre at which it occurs as well as the global reddening, i.e. derived from the total H and H fluxes within the NLR.
While the highest reddening value within the NLR is on average slightly higher in Seyfert 2s (0.750.06) than in Seyfert 1s (0.570.07), we find that the reddening derived from the global Balmer decrement is comparable in Seyfert 1s and 2s (see Table 6 and paper II, Table 6): 0.370.04 mag (excluding MCG-6-30-15) and 0.400.04 mag. When excluding NGC 526a which can be considered as a galaxy of transient Seyfert-type 1.9, the average reddening value for four Seyfert-1 galaxies is indeed the same as that for Sy2s: 0.410.03 mag.
This finding is opposite to the results of Rhee & Larkin (2005) who concluded that Sy 1s have much lower (or zero) reddening than Sy 2s, based on near-IR line ratios. They speculate that the difference could be caused either by a large-scale (100pc) torus or by an intrinsically different grain size distributions in Sy 1s and 2s. Our values rather agree with previous measurements [e.g. Cohen (1983); Gaskell (1984); Tsvetanov & Yancoulova (1989)]: Although these authors find slightly larger values of reddening in Sy2s, substantial reddening is present in Sy 1s as well.
In Fig. 3, we show radial profiles of the reddening (for Sy 2s, see Fig. 5 in paper I and Fig. 3 in paper II). Among Sy1s, there are clear spatial gradients of the reddening with peaking at or near the photometric centre in Mrk 915 and MCG -6-30-15 (note that the latter was determined from the continuum); in other Sy 1s, the reddening is more even or patchy within the NLR. Among Sy 2s, the reddening clearly peaks at or near the photometric centre in IC 5063, ESO 362-G008 and NGC 5643; there are also systematic spatial gradients in NGC 1386, NGC 7212, and NGC 3281, though the maximum reddening does not coincide with the photometric centre.
In the (online) appendix, we give the reddening of the BLR derived from the broad Balmer decrement (when discussing the objects individually).
| Galaxy | max. 343434Highest reddening value within the NLR | Distance353535Distance from the centre of highest reddening value | global 363636Derived by adding the H and H flux within the NLR |
|---|---|---|---|
| (mag) | (″) | (mag) | |
| Fairall 51 | 0.720.2 | 5.55 | 0.390.06 |
| NGC 6860 | 0.530.3 | -4.44 | 0.360.04 |
| Mrk 915 | 0.740.02 | -1.11 | 0.500.05 |
| NGC 526a | 0.340.07 | -5.55 | 0.220.02 |
| MCG -05-13-017 | 0.540.1 | -3.33 | 0.380.04 |
3.4 Spatially resolved spectral diagnostics
In paper I & II, we described the use of diagnostic line-ratio diagrams of the three types pioneered by Baldwin et al. (1981) to not only distinguish between emission-line object classes (e.g. Seyfert galaxies, LINERs, starbursts, transition objects), but to probe the “real” NLR size, i.e. the central region which is photoionised by the AGN, and to discriminate the contribution from starbursts. Such an approach has already been chosen by other authors to study the ionisation mechanism in the circumnuclear and extranuclear regions of Seyfert galaxies [e.g. Radovich et al. (1998); Temporin et al. (2003); Ciroi et al. (2005)]. It often reveals that emission-line ratios at larger distances from the central AGN change towards H ii region-like ones due to an increasing contribution to the ionisation by surrounding star-forming regions.
The high S/N ratio of our spectra enables us to measure line ratios for all three diagrams (“first”: [O iii]/H versus [S ii]/H; “second”: [O iii]/H versus [O i]/H; “third”: [O iii]/H versus [N ii]/H) out to several arcseconds from the nucleus (Figs. 4, 5). The symbols are chosen such that “O” refers to the central spectrum, the small letters mark regions corresponding to “-” arcseconds from the nucleus, the capital ones mark regions corresponding to “+” arcseconds from the nucleus (Table 7). In the second diagnostic diagram, the data points of the outer regions are upper limits, due to the faintness of the [O i] 6300 Å line involved.
As for NGC 1386 and NGC 5643 (paper I & II), we find a clear transition between line ratios falling in the AGN regime and those typical for H ii regions in two Seyfert-1 galaxies of our sample (NGC 6860 and MCG -05-13-017). We present all three diagnostic diagrams of these objects in Fig. 4.
For the remaining four galaxies, no such transition is observed but all emission-line ratios are typical for gas ionised by an AGN power-law continuum. As the distributions in the three diagnostic diagrams are comparable, we present only the third diagnostic diagram for these objects in Fig. 5. (We do not show the diagnostic diagram for MCG -6-30-15 as we could not disentangle the broad and narrow Balmer emission lines in the central 3″.)
We use the diagnostic diagrams to determine the NLR size. The results are summarised in Table 7. For those objects which show a transition of emission-line ratios from the central AGN region to H ii regions, this method gives a measure of the NLR size without [O iii] contamination from circumnuclear starbursts: Although H ii regions may be present over the entire emission-line region, the AGN ionisation dominates in the innermost arcseconds, determining the size of the NLR.
For both objects with such a transition, the determined NLR size is about twice as large as that measured from the HST snapshot survey of Schmitt et al. (2003a), showing the low sensitivity of this survey. On the other hand, some authors have attributed all [O iii] emission to the extended NLR: For MCG -05-13-017, Fraquelli et al. (2000) give a size of 17″ for the extended NLR, while our diagnostic diagrams reveal that only the central 3″ consist of gas ionised by the central AGN. From emission line ratios, Lípari et al. (1993) classify NGC 6860 as transitional object between Seyfert galaxies and starbursts. However, we can show that NGC 6860 is a Seyfert galaxy with the NLR extending out to ″ and surrounding starbursts, giving rise to [O iii] emission out ″.
To conclude, compared to the spatially resolved spectral diagnostics measuring the “real” NLR size, the apparent NLR size determined by [O iii] images can be either smaller in case of low sensitivity or larger in case of contributions of circumnuclear starbursts. For the remaining four objects, the estimated NLR size is a lower limit, pointing out the limitations of this method (see paper II for discussion).
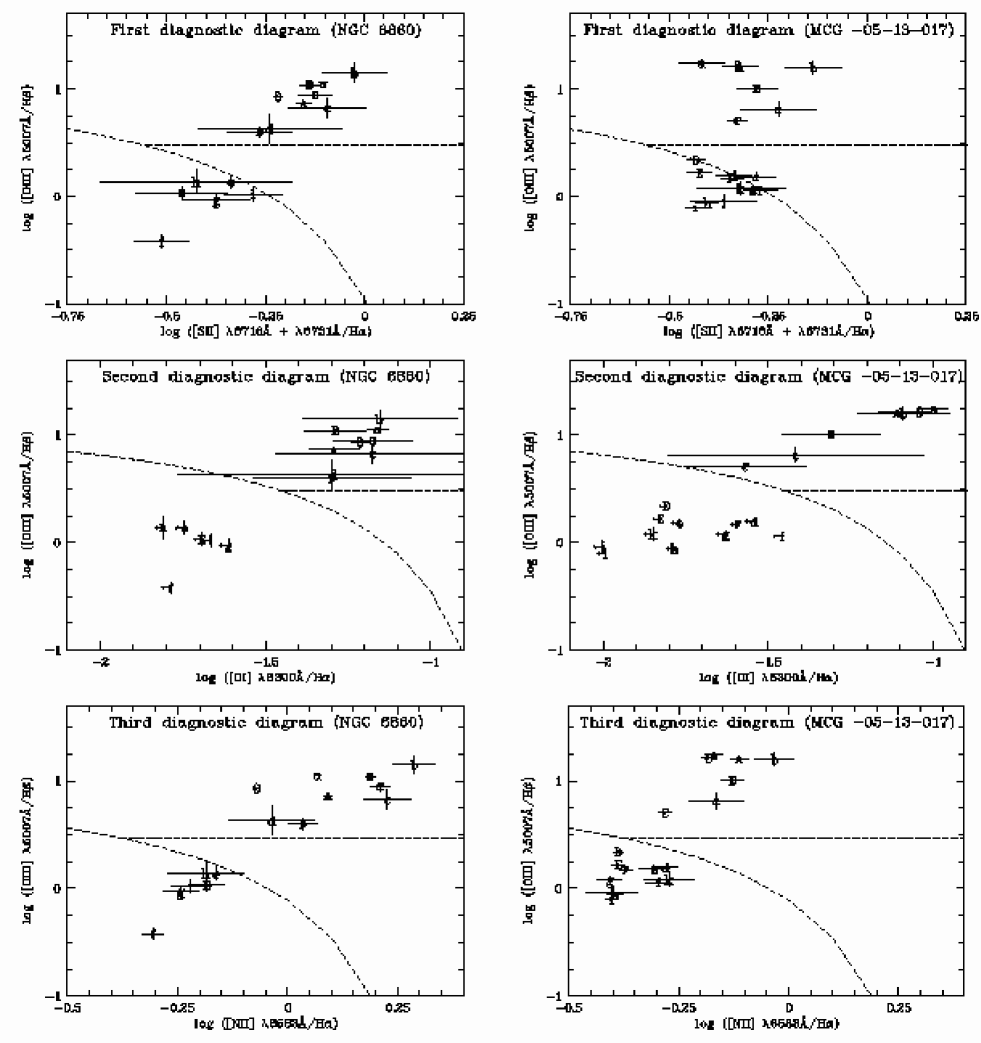

In paper I, we used CLOUDY photoionisation modelling to show that the observed distinction between H ii-like and AGN-like line ratios represents a true difference in ionisation source, and that our method to measure the NLR radius is valid. These results can also be applied here. The second diagnostic diagram including the [O i] emission-line is essential to reach this conclusion, since our photoionisation calculations showed that a combination of outwards decreasing ionisation parameter and metal abundances could mimic H ii-like line ratios despite an intrinsic AGN ionisation source in the [O iii]/H versus [N ii]/H and the [O iii]/H versus [S ii]/H diagrams.
| Galaxy | “a/A” | “a/A” | |||||
|---|---|---|---|---|---|---|---|
| Distance (″) | Orientation | Literature (″) | Our Data (″) | Our data (″) | Our Data (″, pc) | ||
| Fairall 51 | 1 | SE/ | NW | 2393939 Taken from HST image of Schmitt et al. (2003a) | 9 | 8 | 8 (2260) |
| NGC 6860 | 1 | E/ | W | 3b | 10 | 10 | 5 (1465) |
| Mrk 915 | 1 | N/ | S | 2b | 12 | 6 | 6 (2720) |
| NGC 526a | 1 | SE/ | NW | 11404040Taken from groundbased image of Mulchaey et al. (1996a) | 20 | 9 | 9 (3260) |
| MCG -05-13-017 | 1 | NW/ | SE | 1b | 17 | 11 | 3 (730) |
| MCG -6-30-15 | 1.4 | NW/ | SE | 2b | 12 | 4 | 4? (700)414141In the central 3″ of MCG -6-30-15, we cannot disentangle the broad and narrow Balmer components and therefore do not determine the line ratios. In the outer region to a distance of 4″, they fall in the AGN regime. |
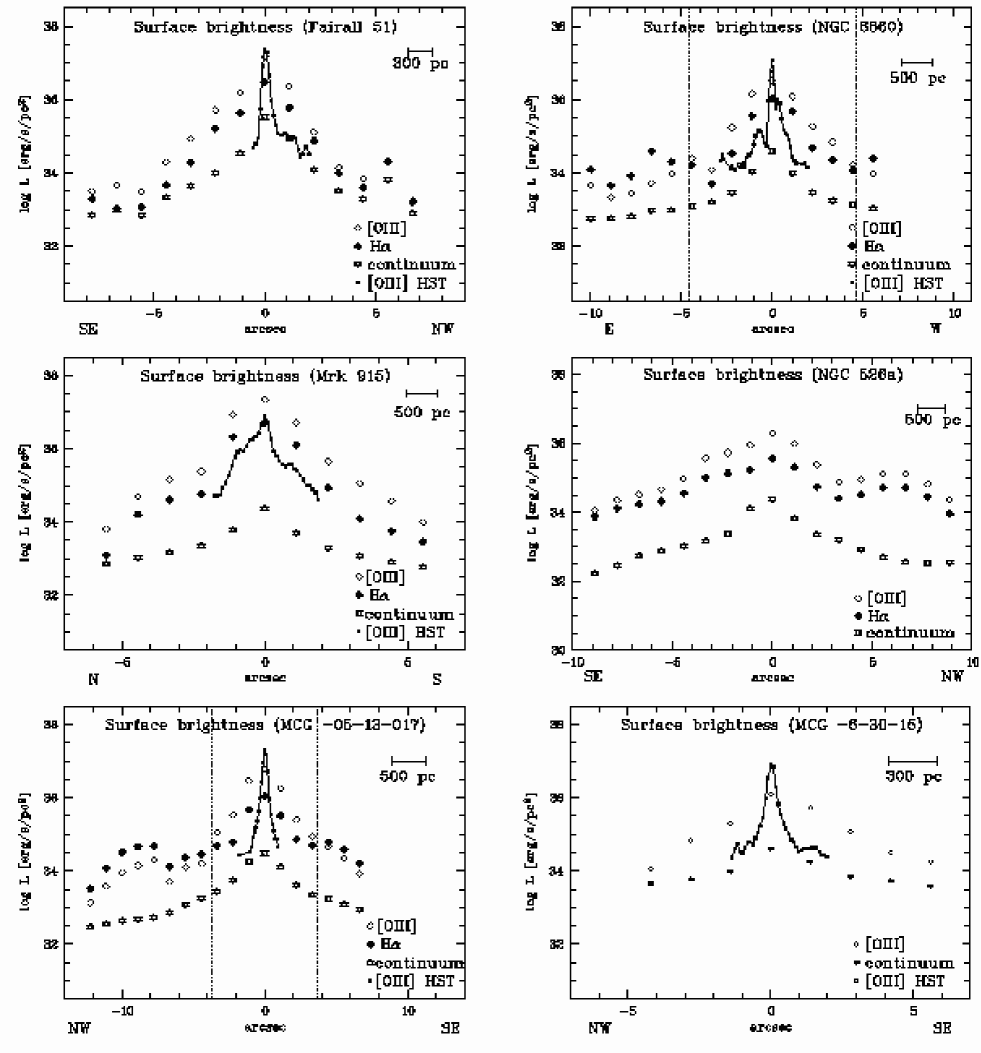
3.5 Surface-brightness distribution
The spatially varying luminosities in the [O iii] and (narrow) H emission lines as well as the continuum (at 5450-5700 Å) were calculated and divided by the corresponding area in square parsecs at the galaxy to allow a comparison among all galaxies in our sample (Fig. 6). The surface-brightness distributions are similar to each other, centrally peaked and decreasing with distance from the nucleus.
For comparison, the [O iii] surface-brightness distributions from the HST images of Schmitt et al. (2003a) are shown for those objects included in the HST snapshot survey. They were derived by averaging three vectorplots along the major axis of the NLR emission (see also paper I & II). In all objects, they clearly show the higher spatial resolution of the HST image (005 - 01 pix-1) compared to the 1-2″ spatial sampling of our spectral data. However, they also reveal the low sensitivity of the HST images compared to our spectroscopy: The [O iii] emission at a S/N of 3 ends significantly earlier than what can be seen in our spectral data. In some cases, the HST [O iii] surface-brightness distributions reveal several subpeaks of possibly individual NLR clouds, as can be already seen in the [O iii] images (Fig. 1). These substructures are smoothed out in our 10-20 times lower spatial resolution spectra but are nevertheless still visible as a secondary or tertiary peak, mostly in emission lines.
We fitted a power-law function (with projected radius ) to the surface-brightness distributions of [O iii], H, and the continuum. The fitting parameters are shown in Table 8 (with referring to = 100 pc from the nucleus). Only data points within the NLR were included and the central point was excluded from the fit.
The [O iii] surface brightness falls faster with radius than the H surface brightness and also faster than the continuum (; ; ). The average slope for both the [O iii] and H surface brightness gets even steeper when excluding NGC 526a which can be considered as a galaxy of transient Seyfert-type 1.9 (; ).
For all three surface-brightness distributions ([O iii], H, continuum), Seyfert-1 galaxies show a steeper radial slope than Seyfert 2s (see paper II) ( versus ; versus ; versus ), a difference that is even more pronounced when excluding NGC 526a (see above).
We want to point out that the continuum slope for the Seyfert-1 galaxies may be boosted by the AGN as we only excluded the nuclear datapoint but no other datapoints within the seeing range (1-2″) which may still be contaminated by the unresolved AGN contribution; excluding these datapoints leaves us with too few datapoints in most cases. However, to estimate this effect, we calculated the average continuum slope excluding the central 2 arcseconds for four Seyfert-1 galaxies for which 3-7 datapoints remain in the fit. It is still steeper than that for the Seyfert-2 galaxies: versus .
| Galaxy | Data Points | ||||||
|---|---|---|---|---|---|---|---|
| (erg s-1 pc-2) | (erg s-2 pc-2) | (erg s-2 pc-2) | |||||
| Fairall 51 | 6 | 3.550.25 | 38.14 | 3.160.48 | 37.36 | 2.150.30 | 35.79 |
| NGC 6860 | 4 | 3.060.12 | 37.69 | 2.590.45 | 36.85 | 1.620.43 | 36.27 |
| Mrk 915 | 5 | 3.920.32 | 39.58 | 3.880.33 | 38.89 | 1.720.45 | 35.74 |
| NGC 526a | 8 | 1.720.19 | 37.1 | 1.280.19 | 36.13 | 1.710.06 | 34.99 |
| MCG -05-13-017 | 3 | 2.900.07 | 37.61 | 1.980.48 | 36.4 | 1.660.02 | 34.9 |
| MCG -6-30-15 | 3 | 2.520.41 | 36.58 | – | – | 0.940.10 | 34.49 |
3.6 Electron-density distribution
Applying the classical methods outlined in Osterbrock (1989), we derive the electron density as a function of distance to the nucleus using the ratio of the [S ii] 6716,6731 Å pair of emission lines. We used the observed central temperature to correct for the dependency of electron density on temperature444444. Due to the faintness of the involved [O iii] 4363 Å emission line, we were not able to measure the temperature in the outer parts. For those objects for which no temperature was determined, we assumed K.
In all objects, the electron density is highest at the nucleus and decreases outwards down to the low-density limit (assumed to be 50 cm-3; Fig. 7). In some cases, it reveals a secondary or tertiary peak on one or both sides of the optical centre. A characteristic structure with a central peak and a smaller peak on both sides of the nucleus can be identified in four objects (Fairall 51, NGC 6860, NGC 526a, MCG -05-13-017). The outer peaks are often close to the boundary of the NLR. These density enhancements may indicate shocks occurring at the edge of the NLR.
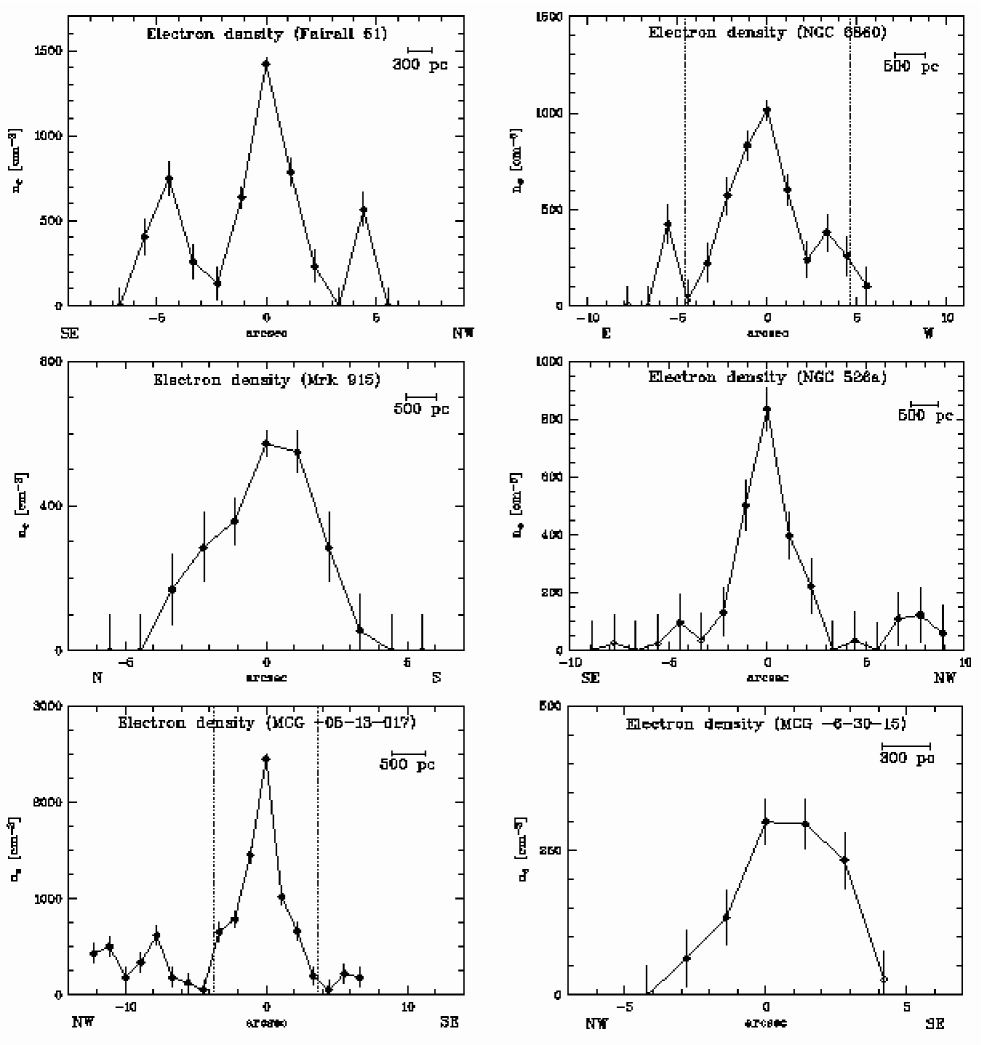
In Table 9, we give the results of fitting a power-law function = to the observed electron densities (with at = 100 pc from the nucleus). Note that we did include only data points within the NLR. ranges between -0.9 and -2.3. On average, the density decreases with . Thus, Seyfert-1 galaxies tend to show a steeper slope than Seyfert-2 galaxies (; paper II). However, the individual scatter is rather large.
The temperature can be a function of distance from the central AGN. Unfortunately, we are not able to determine the temperature dependency on distance from the nucleus. In those objects where we are able to trace the electron temperature in the inner few arcseconds, it remains roughly constant. One may expect that the temperature is decreasing if the AGN is the only heating source. In that case, correcting with the central temperature overestimates the electron density in the outer parts. The observed decreasing slope can therefore not be artificially introduced by a wrong temperature correction. On the other hand, some authors report an increasing temperature with distance from the nucleus [e.g. Bergeron et al. (1983)] and explain it with a decrease in electron density faster than . However, the average decrease of electron density we observe is with slower than that.
Note that the critical density for [S ii] 6716,6731 Å is 1500 cm-3 and 3900 cm-3, respectively. Thus, these lines can only be used to measure the density in an environment with densities below 1500 cm-3. At least for some objects in which we measure central densities in this regime the central density may thus be underestimated.
| Galaxy | Data Points | (cm-3) | |
|---|---|---|---|
| Fairall 51 | 6 | -2.101.50 | 4.1 |
| NGC 6860 | 4 | -1.060.22 | 3.4 |
| Mrk 915 | 3 | -1.200.40 | 3.5 |
| NGC 526a | 8 | -1.150.50 | 3.1 |
| MCG -05-13-017 | 3 | -0.940.14 | 3.5 |
| MCG -6-30-15 | 3 | -2.321.42 | 3.4 |
3.7 Ionisation-parameter distribution
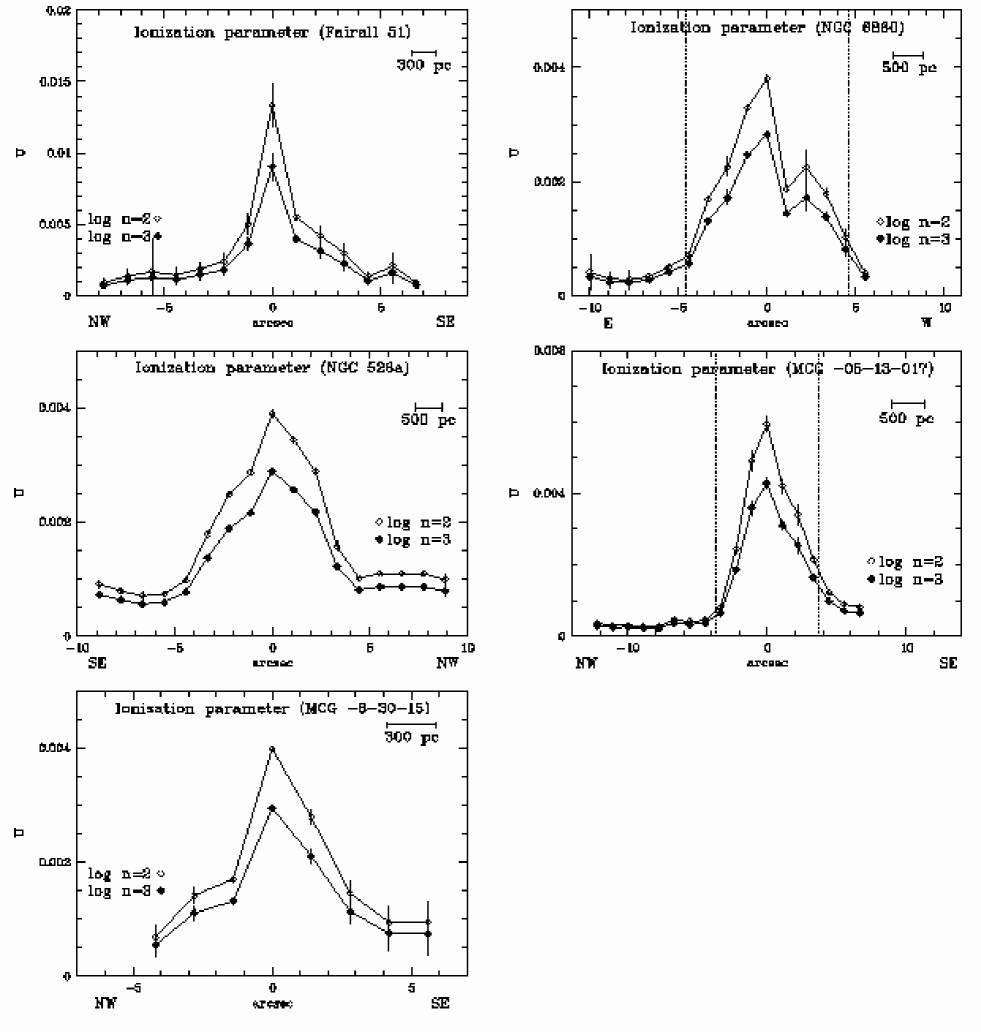
The line ratio [O ii]3727 Å/[O iii] 5007 Å can be used to estimate the value of the ionisation parameter [e.g. Penston et al. (1990); Komossa & Schulz (1997)]. Here, we followed the method described in paper I.
The ionisation parameter peaks at the optical nucleus and decreases with distance. In NGC 6860, a secondary distinct peak is visible.
We fitted a power-law function = to the observed ionisation parameter (Table 10) (with = 100 pc from the nucleus; Table 10). We include only data points within the NLR. ranges between -0.6 and -1.
As for the electron density, Seyfert-1 galaxies tend to show a steeper slope than Seyfert-2 galaxies ( versus ; paper II). However, first the individual scatter is rather large and second, only two Seyfert-2 galaxies were included in this comparison.
| Galaxy | Data Points | ||
|---|---|---|---|
| Fairall 51 | 6 | -0.810.12 | -1.9 |
| NGC 6860 | 4 | -0.620.25 | -2.2 |
| NGC 526a | 8 | -0.690.10 | -2.1 |
| MCG -05-13-017 | 3 | -1.010.26 | -1.9 |
| MCG -6-30-15494949Correction with reddening determined from continuum slope | 3 | -0.900.20 | -2.7 |
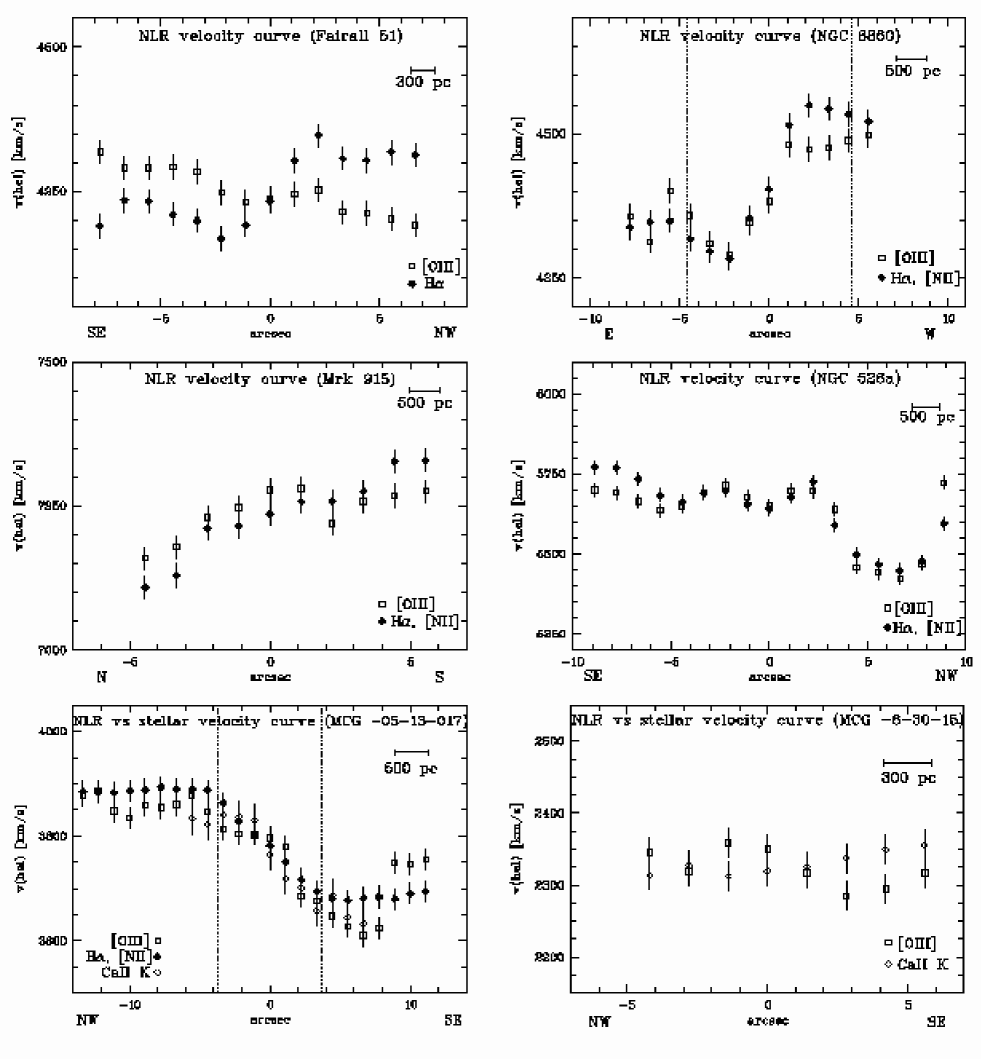
3.8 Velocities
We derived the NLR line-of-sight velocity curve by taking the average of velocity centroids derived by fitting Gaussians to H and [N ii] as well as the [O iii] emission lines. In addition, given the high S/N ratio of our spectra, we were able to trace the stellar rotation curves from Gaussian fits to the stellar absorption line Ca ii K for two objects (before subtraction of the stellar template) throughout the whole region as these lines are not blended with emission lines. The results (with spectral lines used for individual objects indicated) are shown in Fig. 11. We estimated the uncertainty in determining the velocity peaks to km/s for both the emission and absorption lines. Note that for Fairall 51, the [N ii] emission line is blended by the strong H emission and we show the velocity curve derived from the H peak alone. For MCG -6-30-15, the H and [N ii] line are strongly blended and no separation is possible.
As pointed out in paper II, the interpretation of the NLR velocity curves can be quite complex and requires modelling of the 3D structure which is beyond the scope of this paper. Here, we limit ourselves to point out that all the galaxies show large-scale velocity gradients across their NLR. Based on our preliminary modelling, we believe that to the zeroth order, they can be explained by rotation in at least 4 galaxies: Fairall 51, NGC 6860, Mrk 915, and MCG -05-13-017. The situation is more complex in NGC 526a and MCG -6-30-15. We will present detailed modelling of velocity fields in a separate paper.
4 Conclusions
We use high-sensitivity spatially-resolved spectra, obtained along the extended [O iii] emission with the VLT and the NTT, to study the BLR and NLR of six Seyfert-1 galaxies.
The nuclear spectra reveal the typical strong NLR emission from oxygen at different ionisation states, lines from ionised nitrogen and sulphur, as well as Balmer lines. In addition, broad H emission is seen in all objects, broad H emission in all but NGC 526a, classifying the latter as Sy1.9. In most objects, high-excitation iron lines are seen in the central spectra, originating from the powerful and hard ionisation source in the centre. High-ionisation emission lines as well as those with high critical densities tend to be stronger in Seyfert-1 galaxies. We determine the electron temperature and ionisation parameter in the optical nucleus and find that they are in general higher in type-1 Seyferts than in type 2s.
From the continuum luminosity at 5100Å as well as the FWHM of the broad H line, we estimate BH masses and compare them to those derived from (as taken from literature). The Seyfert-1 galaxies in our sample cover a BH mass range of 1 107 to 1 108 M⊙.
In addition to the Seyfert-2 galaxies NGC 1386 and NGC 5643 already discussed in paper I & II, we observe a transition of emission-line ratios from the central AGN region to H ii region in two objects (NGC 6860 and MCG -05-13-017), when plotting line-ratios from our spatially resolved spectra in diagnostic diagrams. This transition occurs at a distance of several arcseconds on both sides of the optical nucleus and is observed in all three diagnostic diagrams, i.e. including the second diagnostic diagram involving the [O i] emission line. The most probable explanation for this transition is that the stellar ionisation field starts to dominate that of the AGN. This conclusion is supported by CLOUDY photoionisation modelling presented in paper I. We are thus able to determine the radius of the NLR in these objects to 700-1500 pc independent of sensitivity and excluding [O iii] contamination from circumnuclear starbursts. In former spectroscopic studies, the observed [O iii] has often been attributed to the extended NLR. We can show that at least part of this “extended NLR” emission is actually predominantly powered by H ii regions and that only the central few arcseconds are indeed gas photoionised by the AGN. For the other four objects, all line ratios fall in the AGN regime in all three diagnostic diagrams. Thus, the determined NLR size (700-3300 pc) is a lower limit, limited by either the S/N of our data or the lack of a strong surrounding stellar ionisation field.
We derive reddening, surface brightness, electron density, and ionisation parameter within the NLR as a function of projected distance from the nucleus. Both electron density and ionisation parameter decrease with radius. In general, the decrease is faster in Seyfert-1 galaxies than in type 2s.
We discuss the results for each object individually and compare them to literature data (Appendix).
Comparing the results presented here to those of six Seyfert-2 galaxies from paper II shows that both types have in general similar NLR properties. However, there are differences in emission-line strength as well as in the observed slope of spatially varying parameters. The origin of these differences will be discussed in a subsequent paper on the basis of the unified model taking into account line-of-sight integrations.
Applying the methods presented here to a larger sample of Seyfert galaxies will help to measure the NLR size and thus verify the NLR size-luminosity relation (Bennert et al., 2002). Our results have shown that although [O iii] imaging is less time intensive than the spectroscopic method, it often yields an either too small NLR size in case of low sensitivity or a too large NLR size in case of circumnuclear H ii regions contributing to the [O iii] emission.
Acknowledgements.
We thank the anonymous referee for valuable suggestions. N.B. is grateful for financial support by the “Studienstiftung des deutschen Volkes”. B.J. acknowledges the support of the Research Training Network “Euro3D-Promoting 3D Spectroscopy in Europe” (European Commission, Human Potential Network Contract No. HPRN-CT-2002-00305) and of the Institutional Research Plan No. AV0Z10030501 of the Academy of Sciences of Czech Republic. M.H. is supported by “Nordrhein-Westfälische Akademie der Wissenschaften”. We thank Pierre Ferruit for providing and helping us with the fit/spec line-fitting tool. Henrique Schmitt was so kind to provide the continuum-subtracted HST [O iii] images of several Seyfert galaxies in this sample. This research has made use of the NASA/IPAC Extragalactic Database (NED), operated by the Jet Propulsion Laboratory, Caltech, under contract with the NASA.References
- Baldwin et al. (1981) Baldwin, J. A., Phillips, M. M., & Terlevich, R. 1981, PASP, 93, 5
- Ballantyne et al. (2003) Ballantyne, D. R., Weingartner, J. C., & Murray, N. 2003, A&A, 409, 503
- Barth et al. (2001) Barth, A. J., Ho, L. C., Filippenko, A. V., Rix, H.-W., & Sargent, W. L. W. 2001, ApJ, 546, 205
- Bennert et al. (2002) Bennert, N., Falcke, H., Schulz, H., Wilson, A. S., & Wills, B. J. 2002, ApJL, 574, 105
- Bennert et al. (2004) Bennert, N., Schulz, H., & Henkel, H. 2004, A&A, 419, 127
- Bennert (2005) Bennert, N. 2005, PhD Thesis, University of Bochum, Germany
- Bennert et al. (2006a) Bennert, N., Jungwiert, B., Komossa, S., Haas, M., & Chini, R., 2006a, A&A, 446, 919 (paper I)
- Bennert et al. (2006b) Bennert, N., Jungwiert, B., Komossa, S., Haas, M., & Chini, R., 2006b, A&A, in press (paper II), astro-ph/0606367
- Bergeron et al. (1983) Bergeron, J., Durret, F., & Boksenberg, A. 1983, A&A, 127, 322
- Bica (1988) Bica, E. 1988, A&A, 195, 76
- Binette et al. (1996) Binette L., Wilson, A. S., Storchi-Bergmann, T. 1996, A&A, 312, 365
- Bonatto et al. (2000) Bonatto, C., Bica, E., Pastoriza, M. G., & Alloin, D. 2000, A&A, 355, 112
- Brindle et al. (1990) Brindle, C., Hough, J. H., Bailey, J. A., et al. 1990, MNRAS, 244, 577
- Cid Fernandes et al. (1998) Cid Fernandes, R., Storchi-Bergmann, T., & Schmitt, H. R. 1998, MNRAS, 297, 579
- Ciroi et al. (2005) Ciroi, S., Afanasiev, V. L., Moiseev, A. V., Botte, V., Di Mille, F., Dodonov, S. N., Rafanelli, P., & Smirnova, A. A. 2005, MNRAS, 360, 253
- Clarke et al. (1998) Clarke, C. J., Kinney, A. L., & Pringle, J. E. 1998, ApJ, 495, 189
- Cohen (1983) Cohen, R. D. 1983, ApJ, 273, 489
- Colbert et al. (1996) Colbert, E. J. M., Baum, S. A., Gallimore, J. F., et al. 1996, ApJS, 105, 75
- De Vaucouleurs et al. (1991) De Vaucouleurs, G., De Vaucouleurs, A., Corwin, H. G., Buta, R. J., Paturel, G., & Fouque, P. 1991, Third Reference Catalogue of Bright Galaxies, Vol. III (New York: Springer Verlag) (RC3)
- Ferland et al. (1998) Ferland G. J., Korista K. T., Verner D. A., et al., 1998, PASP, 110, 761
- Ferruit et al. (2000) Ferruit, P., Wilson, A. S., & Mulchaey, J. 2000, ApJS, 128, 139
- Fraquelli et al. (2000) Fraquelli, H. A., Storchi-Bergmann, T., & Binnette, L. 2000, ApJ, 532, 867
- Garcia-Rissmann et al. (2005) Garcia-Rissmann, A., Vega, L. R., Asari, N. V., Cid Fernandes, R., Schmitt, H., González Delgado, R. M., & Storchi-Bergmann, T., 2005, MNRAS, 359, 765
- Gaskell (1984) Gaskell, C. M. 1984, Astrophys. Lett., 24, 43
- Goodrich (1995) Goodrich, R. W. 1995, ApJ, 440, 141
- Heckman (1979) Heckman, T. M., & Balick, B. 1979, A&A, 79, 350
- Iwasawa et al. (1996) Iwasawa, K., Fabian, A. C., Reynolds, C. S., et al. 1996, MNRAS, 282, 1038
- Kaspi et al. (2005) Kaspi, S., Maoz, D., Netzer, H., Peterson, B. M., Vestergaard, M., & Jannuzi, B. T. 2005, ApJ, 629, 61
- Keel (1996) Keel, W. C. 1996, AJ, 111, 2
- Kinney et al. (2000) Kinney, A. L., Schmitt, H. R., Clarke, C. J., Pringle, J. E., Ulvestad, J. S., & Antonucci, R. R. J. 2000, ApJ, 537, 152
- Komossa & Schulz (1997) Komossa, S., & Schulz, H. 1997, A&A, 323, 31
- Landi et al. (2001) Landi, R., Bassani, L., Malaguti, G. et al. 2001, A&A 379, 46
- Lípari et al. (1993) Lípari, S., Tsvetanov, Z., & Macchetto, F. 1993, ApJ, 405, 186
- Márquez et al. (1999) Márquez, I., Durret, F., González Delgado, R. M., et al. 1999, A&AS, 140, 1
- Márquez et al. (2004) Márquez, I., Durret, F., Masegosa, J., et al. 2004, A&A, 416, 475
- Martin et al. (1983) Martin, P. G., Thompson, I. B., Maza, J., & Angel, J. R. P. 1983, ApJ, 266, 470
- McHardy et al. (2005) McHardy, I. M., Gunn, K. F., Uttley, P. & Goad, M. R. 2005, MNRAS, 359, 1469
- Merritt & Ferrarese (2001) Merritt, D. & Ferrarese, L. 2001, ApJ, 547, 140
- Morris et al. (1985) Morris, S., Ward, M., Whittle, M., Wilson, A. S., & Taylor, K. 1985, MNRAS, 216, 193
- Mulchaey et al. (1996a) Mulchaey, J. S., Wilson, A. S., & Tsvetanov, Z. I., 1996, ApJS, 102, 309
- Mulchaey et al. (1996b) Mulchaey, J. S., Wilson, A. S., & Tsvetanov, Z. I. 1996b, ApJ, 467, 197
- Murayama & Taniguchi (1998a) Murayama, T., & Taniguchi, Y. 1998a, ApJ, 497, L9
- Murayama & Taniguchi (1998b) Murayama, T., & Taniguchi, Y. 1998b, ApJ, 503, L115
- Nagao et al. (2000) Nagao, T., Murayama, T., & Taniguchi, Y. 2000, AJ, 119, 2605
- Nagao et al. (2001) Nagao, T., Murayama, T., & Taniguchi, Y. 2001, PASJ, 53, 629
- Nagar & Wilson (1999a) Nagar, N. M., & Wilson, A. S. 1999a, ApJ, 516, 97
- Nagar et al. (1999b) Nagar, N. M., Wilson, A. S., Mulchaey, J. S., & Gallimore, J. F. 1999b, ApJS, 120, 209
- Netzer (1975) Netzer, H. 1975, MNRAS, 171, 395
- Netzer et al. (1990) Netzer, H., Maoz, D., Laor, A., et al. 1990, ApJ, 353, 108
- Osterbrock (1978) Osterbrock, D. E. 1978, Lick Obs. Bull., 775
- Osterbrock (1989) Osterbrock, D. E. O. 1989, Astrophysics of Gaseous Nebulae and Active Galactic Nuclei (Mill Valley: University Science Books)
- Penston et al. (1990) Penston, M. V., Robinson, A., Alloin, D., et al. 1990, A&A, 236, 53
- Peterson (1993) Peterson, B. M. 1993, PASP, 105, 247
- Peterson et al. (2004) Peterson, B. M., Ferrarese, L., Gilbert, K. M. et al. 2004, ApJ, 613, 682
- Radovich et al. (1998) Radovich, M., Rafanelli, P., & Barbon, R. 1998, A&A, 334, 124
- Reynolds et al. (1997) Reynolds, C. S., Ward, M. J., Fabian, A. C., & Celotti, A. 1997, MNRAS, 291, 403
- Rhee & Larkin (2005) Rhee, J. H. & Larkin, J. E. 2005, ApJ, 620, 151
- Robinson et al. (1994) Robinson, A., Vila-Vilaro, B., Axon, D. J. et al. 1994, A&A, 291, 351
- Rodríguez-Ardila et al. (2000) Rodríguez-Ardila, A., Pastoriza, M. G., & Donzelli, C. J. 2000, ApJS, 126, 63
- Schlegel et al. (1998) Schlegel, D. J., Finkbeiner, D. P., & Davis, M. 1998, ApJ, 500, 525
- Schmid et al. (2001) Schmid, H. M., Appenzeller, I., Camenzind, M., et al. 2001, A&A, 372, 59
- Schmitt (1998) Schmitt, H. R. 1998, ApJ, 506, 647
- Schmitt et al. (2001) Schmitt, H. R., Ulvestad, J. S., Antonucci, R. R. J., & Kinney, A. L. 2001, ApJS, 132, 199
- Schmitt et al. (2003a) Schmitt, H. R., Donley, J. L., Antonucci, R. R. J., Hutchings, J. B., & Kinney, A. L. 2003, ApJS, 148, 327
- Schmitt et al. (2003b) Schmitt, H. R., Donley, J. L., Antonucci, R. R. J., Hutchings, J. B., Kinney, A. L., & Pringle, J. E. 2003b, ApJ, 597, 768S
- Schulz et al. (1999) Schulz, H., Komossa, S., Schmitz, C., & Mücke, A. 1999, A&A, 346, 764
- Schulz & Henkel (2003) Schulz, H., & Henkel, C. 2003, A&A, 400, 41
- Shuder & Osterbrock (1981) Shuder, J. M., & Osterbrock, D. E. 1981, ApJ, 250, 55
- Sosa-Brito et al. (2001) Sosa-Brito, R. M., Tacconi-Garman, L. E., Lehnert, M. D., & Gallimore, J. F. 2001, ApJS, 136, 61
- Storchi-Bergmann et al. (1996) Storchi-Bergmann, T., Wilson, A. S., Mulchaey, J. S., & Binette, L. 1996, A&A, 312, 357
- Sulentic et al. (2002) Sulentic, J. W., Marziani, P., Zamanov, R., Bachev, R., Calvani, M., Dultzin-Hacyan, D. 2002, ApJ, 566, L71
- Tanaka et al. (1995) Tanaka, Y., Nandra, K., Fabian, A. C., et al. 1995, Nature, 375, 659
- Temporin et al. (2003) Temporin, S., Ciroi, S., Rafanelli, P., Radovich, M., Vennik, J., Richter, G. M., & Birkle, K. 2003, ApJS, 148, 353
- Thompson & Martin (1988) Thompson, I. B., & Martin, P. G. 1988, ApJ, 330, 121
- Tremaine et al. (2002) Tremaine S., Gebhardt, K., Bender, R., Bower, G., Dressler, A., Faber, S.M., Filippenko, A.V., Green, R., Grillmair, C., Ho, L.C., Kormendy, J., Lauer, T.R., Magorrian, J., Pinkney, J., & Richstone, D., 2002, A&A, 574, 740
- Tsvetanov & Yancoulova (1989) Tsvetanov, Z. I. & Yancoulova, I. M. 1989, MNRAS, 237, 707
- Tsvetanov & Petrosian (1995) Tsvetanov, Z. I., & Petrosian, A. R. 1995, ApJS, 101, 287
- Veilleux (1990) Veilleux, S. 1990, PASP, 102, 494
- Véron-Cetty et al. (2001) Véron-Cetty, M.-P., Véron, P., & Gonçalves, A. C. 2001, A&A, 372, 730
- Véron-Cetty et al. (2004) Véron-Cetty, M.-P., Joly, M., & Véron, P. 2004, A&A, 417, 515
- Vrtilek & Carleton (1985) Vrtilek, J. M., & Carleton, N. P. 1985, ApJ, 294, 106
- West et al. (1978) West, R. M., Danks, A. C. & Alcaino, G. 1978, A&A, 65, 151
- Whittle (1985) Whittle, M. 1985, MNRAS, 213, 1
- Whittle (1992) Whittle, M. 1992, ApJS, 79, 49
- Wilson et al. (1989) Wilson, A. S., Wu, X., Heckman, T. M., Baldwin, J. A., & Balick, B. 1989, ApJ, 339, 729
- Winkler (1992) Winkler, H. 1992, MNRAS, 257, 677
Appendix A Comments on Individual Objects
We searched the available literature for all objects in our sample and here summarise the most important results in comparison with our study. Note that the velocity fields will be discussed in detail when comparing them to those derived from modelling in a subsequent paper.
A.1 Fairall 51
Fairall 51 is known for its high polarisation, noticed already by Martin et al. (1983), Thompson & Martin (1988), and Brindle et al. (1990). Fairall 51 is a barred spiral with the bar extending to about 12″ on both sides of the nucleus in north-south direction (West et al., 1978). Schmid et al. (2001) investigated the origin of the polarisation and the geometry of the system using VLT spectropolarimetry. While the AGN continuum and the broad lines reveal a practically identical amount of intrinsic polarisation (5% in the red up to 13% in the UV), the narrow lines are unpolarised or show only little intrinsic polarisation. The spectrum is much redder in total flux than in polarised flux. These Seyfert 2-like polarisation characteristics indicate that the nucleus is partially obscured with the scattering region located far from the BLR and the continuum source. This specific geometry allows to study the BLR both directly and via scattering. From the indistinguishable line profiles in polarised and total light, Schmid et al. (2001) conclude that the velocity field of the BLR is spherically symmetric.
Fairall 51 is the object with the strongest iron emission lines relative to H seen in the nuclear spectrum in our sample: Compared to the average values determined from the four other Seyfert-1 galaxies from Table 3, the [Fe vii] 5721 Å/H flux ratio is more than twice as high in Fairall 51, the [Fe vii] 6087 Å/H flux ratio is roughly three times as high, and the [Fe x] 6375 Å/H flux ratio is four times higher than the average value. We detect [O iii] emission (S/N 3) out to a distance of 9″ from the nucleus (Table 7), i.e. three times larger than the maximum extension of the HST [O iii] image from Schmitt et al. (2003a) (265). Emission-line ratios out to 8″ indicate ionisation by the central AGN source, although the outer 6-7″ north-west of the nucleus (marked as E/F in the diagnostic diagram) show line ratios at the border between those typical for AGNs and those expected for LINERs (Fig. 5). We classify the inner 14″ as NLR (Table 7).
The reddening of the central BLR, deduced from the broad H/H ratio of 4.4, is comparable to the central NLR reddening ( mag). It indicates that the dust is external to both emission line regions. We interpret deviations of the broad Balmer decrement from the recombination value as reddening indicator, but note that optical depth effects could lead to similar results [e.g. Netzer (1975)]. However, the fact that both, NLR and BLR show the same amount of reddening in Fairall 51 (and several of the other galaxies of our sample) strongly hints at a common absorber affecting both regions in the same way, rather than optical depth effects in the BLR.
In the central spectra, the broad emission lines in both H and H clearly dominate the profile, confirming the classification of Fairall 51 as pure Seyfert-1 galaxy.
In the same region where we find line ratios approaching that expected for LINERs, we observe an enhanced surface brightness in the [O iii] and H emission as well as the continuum (Fig. 6). Moreover, two density peaks on both sides of the nucleus roughly coincide with the enhanced surface brightness and the north-western region in which line ratios close to LINER ones are observed (Fig. 7). Also the ionisation parameter in Fairall 51 reveals a small secondary peak at 6″ north-west of the nucleus (Fig. 8). Is the match of the increased electron density, ionisation parameter, surface brightness as well as the line ratios close to LINER type at 5-6″ to the north-west of the nucleus pure coincidence or does it hint e.g. shocks occurring at these distances? Unfortunately, there is no published information on the radio source in Fairall 51 allowing to discuss a possible jet-NLR interaction. Alternatively, the bar (p.a. °) may influence the NLR, resulting in the observed properties on both sides of the centre (p.a. 160°).
A.2 NGC 6860
The luminous infrared galaxy NGC 6860 shows a composite nature of a Seyfert-1 nucleus embedded in a dusty star formation environment (Lípari et al., 1993). While NED classify NGC 6860 as Seyfert 1, Cid Fernandes et al. (1998) and Lípari et al. (1993) find emission lines typical for a Seyfert 1.5. As the narrow components in both H and H which are superimposed on the broad components are clearly visible in our central spectra, we agree with Lípari et al. (1993) to classify NGC 6860 as Sy1.5.
Lípari et al. (1993) studied NGC 6860 in detail, presenting optical imaging as well as optical and near-infrared spectroscopy. The H+[N ii] image shows a bright emission-line region associated with the AGN activity and a circumnuclear ring of star formation with clear signs of young stars in the spectrum. The [O iii] image reveals emission extended by 10″ in east-west direction, perpendicular to the direction of the bar (p.a.bar 13°). Lípari et al. (1993) use templates from Bica (1988) to fit the stellar population, finding that an S3 template represents the nuclear stellar population, while the rather young population of an S6 template fits the inner star formation ring. The bar reveals a typical spectrum of an old stellar population. A high electron temperature ( K) is observed in the nuclear region. NGC 6860 is classified as a typical intermediate case between AGN activity completely dominating the energy input and starburst galaxy where the ionising continuum is spread over a much larger star-forming region (Lípari et al., 1993). This is strengthened by line ratios in diagnostic diagrams which locate the galaxy in a transitional zone between areas occupied by AGNs and H ii regions.
Besides MCG -05-13-017, NGC 6860 is the other galaxy in our sample which shows, in all three diagnostic diagrams, a clear transition between central line ratios falling in the AGN regime and outer ones typical for H ii regions (Fig. 4). While we detect [O iii] emission at a S/N 3 out to a distance of 10″ in east-west direction, comparable to the maximum extension of the [O iii] groundbased image of Lípari et al. (1993), the emission beyond 5″ can be attributed to circumnuclear star forming regions (Table 7). Our results confirm the classification of NGC 6860 as an intermediate case between AGN activity and starburst galaxy (Lípari et al., 1993). While Lípari et al. (1993) find line ratios in the transitional zone between Seyfert galaxies and H ii regions, we are able to trace the radial varying ratios and determine the radius where the transition takes place in all three diagnostic diagrams. Showing that the transition occurs at the same distance in the second diagnostic diagram is essential to exclude spatial variations of physical parameters resulting in a transition of line ratios from the AGN to the H ii-region regime despite an intrinsic AGN photoionising source (paper I). Thus, we can determine the NLR size of NGC 6860 to a radius of ″ (observed along a p.a. of 85°), i.e. the AGN radiation field dominates over the stellar one in the inner 10″. The maximum [O iii] extent we observe is four times larger than what is observed in the HST [O iii] image by Schmitt et al. (2003a) (″ versus ″).
In the centre, we find a high electron temperature of K, in agreement with the results of Lípari et al. (1993) (Table 4). The reddening values vary rather randomly. Moreover, there is no significant difference between the reddening in the NLR and that in the surrounding H ii regions (Fig. 3). The BLR shows a reddening comparable to that of the NLR (in the central 2″: H/H 5.5, mag). As in Fairall 51, it indicates dust in the host galaxy.
A.3 Mrk 915
Mrk 915 is a highly-inclined (°) Seyfert-1 galaxy with a companion at 126″ to the south-east (Keel, 1996).
Goodrich (1995) observes flux changes in the broad H line which has almost disappeared in 1993 compared to spectra obtained nine years earlier (their Fig. 3). If this change can be explained by an increase in reddening, then mag. The broad H emission we find in our nuclear spectra observed in September 2004 is comparable to that seen by Goodrich (1995) in 1984, i.e. it is significantly higher than that observed in 1993 ( erg s-1 cm-2, erg s-1 cm-2, erg s-1 cm-2). If this change can be attributed to dusty clouds, they have high transverse velocities and must thus be close to, but outside of, the bulk of the BLR itself (Goodrich, 1995). As both the broad and the superimposed narrow components in H and H can be easily recognised in the nuclear spectra, we classify Mrk 915 as Seyfert-1.5 galaxy rather than Sy1. Calculating the reddening of the BLR in the central 2″ yields a reddening value comparable to that of the NLR, indicating that, at the moment, there is no significant dust amount between the broad and narrow Balmer lines (H/H 5; 0.5 mag).
A groundbased H+[N ii] image were taken by Colbert et al. (1996), showing extended emission along the major axis (p.a. 168°) out to a radius of 15″ in south-eastern direction. Along a p.a. of 5°, the H+[N ii] emission extends out to 10″.
The HST [O iii] image of Schmitt et al. (2003a) reveals irregular emission with a major extent of 41 along p.a. = 5° and 26 in the perpendicular direction. We detect [O iii] emission at a S/N 3 out to a radius of 12″, i.e. three times further out than the HST [O iii] image (Table 7). The [O iii] extension obtained from our spectra is comparable to the ″ extension seen in the groundbased H+[N ii] image at a p.a. of 5° [Colbert et al. (1996), see their Fig. 2h]. Emission-line ratios at S/N 3 were traced out to a distance of 6″ from the nucleus. Within this region, all ratios are typical for AGN ionisation and we thus classify the emitting region as NLR (Table 7; Fig. 5).
A.4 NGC 526a
NGC 526a is the brighter member of a strongly interacting pair of galaxies. The Seyfert type is discussed controversially: Mulchaey et al. (1996a) and Whittle (1992) list NGC 526a as Sy2, while RC3 classify it as Sy1.5. Winkler (1992) discuss the presence of broad H and the absence of broad H, suggesting a classification of Sy1.9. Our spectra do not show signs of broad H emission but a broad H component is clearly visible in the central 2″. Thus, we agree with Winkler (1992) in classifying NGC 526a as Sy1.9. The central (narrow) H/H ratio of 4.1 we observe is slightly higher than the value reported by Winkler (1992) () but significantly lower than the reddening of the BLR: We tried to fit any spurious underlying broad H flux and find, in agreement with Winkler (1992), a high reddening of the BLR with H/H 10, corresponding to 1.26 mag, larger than that of the NLR. The BLR reddening implies an absorbing column density of 7.4 1021 cm-2 for a Galactic gas/dust ratio (and in the absence of optical depth effects), which is similar to the amount of X-ray absorption [ cm-2; Landi et al. (2001)].
Groundbased emission-line images in [O iii] and H+[N ii] are presented by Mulchaey et al. (1996a). The images reveal extended line emission out to 10″ in north-west/south-east direction, in approximately the direction of the companion galaxy. Excitation maps show evidence of a bi-conical shape of the highest excitation gas.
We detect extended [O iii] emission at a S/N 3 out to a radius of 20″ (7240 pc) from the nucleus (Table 7), i.e. twice as far as seen in the groundbased emission-line image of Mulchaey et al. (1996a). The line ratios needed for diagnostics and the derivation of physical parameters where determined out to 9″ (3260 pc) to the north-west and south-east from the nucleus. All emission-line ratios within this region indicate AGN ionisation (Table 7; Fig. 5).
A.5 MCG -05-13-017
According to Mulchaey et al. (1996a), the Seyfert-1.5 galaxy MCG -05-13-017 is a strongly perturbed galaxy, showing extended [O iii] emission out to a radius of 11″ to the south-east around an emission component concentrated in the nucleus. The [O iii] emission extends roughly along the host galaxy major axis (p.a. = 160° with °; RC3). The groundbased H image reveals more symmetrically distributed emission, with the strongest off-nuclear emission within the [O iii] extension. From the excitation map, Mulchaey et al. (1996a) concludes that not all of the gas within the south-eastern extension is of high excitation.
The most extensive spectroscopic study of the extended NLR of MCG -05-13-017 has been performed by Fraquelli et al. (2000). Emission-line fluxes were measured along p.a. = 158° out to 17″ from the nucleus. The [O ii]/[O iii] ratio increases with distance from the nucleus, indicating a decreasing ionisation parameter. Comparing these results with groundbased images of Mulchaey et al. (1996a), Fraquelli et al. (2000) suggest that the nuclear continuum ionises the gas in the disk along p.a. = 158°, giving rise to the cone-shaped region observed in [O iii].
We detect [O iii] emission with a S/N 3 out to a radius of 17″ from the photometric centre (Table 7). This is significantly larger than the ″ total extension seen in the HST snapshot image and also larger than what has been determined from the groundbased image of Mulchaey et al. (1996a) (″). The excitation map of Mulchaey et al. (1996a) already indicates that not all of the gas is of high excitation and the diagnostic diagrams in our study can confirm this finding (Fig. 4). Moreover, we can show that only the central 3″ show line ratios typical for AGN ionised gas (marked with 0, A/a, B/b, C,c, respectively in Fig. 4) and that the spectra out to 11″ north-west and out to 6″ south-east have line ratios falling in the regime covered by H ii regions (D/d to F/k). The outer line ratios coincide with the position of H ii regions defined by Tsvetanov & Petrosian (1995): They classify 38 H ii regions in their groundbased H+[N ii] image of MCG -05-13-017, distributed in a cloud around the nucleus with distances between 3-18″ from the nucleus. Along the p.a. of 140° as used in our long-slit observations, H ii regions start at a distance of 4″ from the nucleus and extend out to 11″. While Fraquelli et al. (2000) attribute emission out to 17″ from the nucleus to the extended NLR, we can show that only the central 3″ are gas ionised by the central AGN.
MCG -05-13-017 is the object with the highest central electron temperature in our sample ( 525003000 K: Table 4). The ionisation parameter is also high in the centre. These values reflect in high flux ratios of high-excitation lines (Table 3): The nuclear spectrum shows strong [Ne iii] 3869 Å emission, even exceeding that of [O ii] 3727 Å; it is the highest flux ratio [Ne iii]/H ( = 3.43) observed in our sample. Also the ratios [O iii] 5007 Å/H ( = 16.3; = [O iii] 4959 Å+5007 Å/H 21.7) and [O i] 6300 Å/H ( = 0.79) are the highest ones of our sample. Additionally, strong coronal lines are observed.
The broad Balmer decrement H/H of 5.7 indicates a slightly higher reddening of the BLR with respect to the central NLR ( mag), possibly due to dust in between the two regions. The electron density is highest in the centre ( 246055 cm-3; Table 4). This value is roughly 2.5 times higher than the value reported by Rodríguez-Ardila et al. (2000) which is approximately the factor that we took into account when correcting with the observed central temperature of K505050.
The ionisation parameter is peaked in the nucleus and rapidly decreases within the NLR (Fig. 8). Our observations confirm the results of Fraquelli et al. (2000) who already suggest that the ionisation parameter is decreasing, based on the increased [O ii]/[O iii] ratio (observed along a slightly different p.a. of 20°).
A.6 MCG -6-30-15
The E/S0 galaxy MCG -6-30-15 hosts an X-ray bright AGN of Seyfert 1.2 type (NED). It has been the subject to intense spectroscopic studies in the X-ray band [e.g. Iwasawa et al. (1996)] and is the best candidate for harbouring a relativistically broadened iron line [e.g. Tanaka et al. (1995)].
A multiwavelength study has been performed by Reynolds et al. (1997): In the optical, an extracted host galaxy spectrum with Balmer and Ca ii absorption features is subtracted to gain the absorption-line free AGN spectra. The nuclear spectrum reveals a strong non-stellar continuum, broad Balmer lines, and narrow permitted and forbidden lines. High-excitation forbidden lines (e.g. [Fe x], [Fe xi] 7892 Å, and [Fe xiv] 5303 Å) are clearly displayed. A significant amount of dust extinction is deduced from optical line and continuum emission, lying in the range =0.6–1 mag. Due to the absence of cold (neutral) absorption in the X-ray spectra, Reynolds et al. (1997) postulate that the dust resides in the so-called warm absorber, i.e. ionised gas that absorbs X-rays produced in the accretion disk of the AGN.
VLA observations at both 3.6 and 20 cm show that MCG -6-30-15 is an unresolved radio source (Nagar et al., 1999b). HST continuum images and colour maps from Ferruit et al. (2000) show a dust lane south of the nucleus, running roughly parallel to the photometric major axis of the galaxy (p.a. 115°; 60°). The south-west side of the galaxy is found to be systematically redder than the north-east side, with the central regions redder than the outer ones.
The VLT long-slit spectra of MCG -6-30-15 allow us to trace [O iii] emission out to a distance of 12″ from the optical nucleus, i.e. six times larger than the [O iii] extension seen in the HST image of Schmitt et al. (2003a). We confirm the existence of high-excitation forbidden lines in the central spectra as reported by Reynolds et al. (1997).
MCG -6-30-15 is the only galaxy in our sample in which we were not able to disentangle the broad and narrow Balmer emission lines. This is first due to the classification as Sy1.2 whereas the other Seyfert-1 galaxies (apart from Fairall 51) can be classified as either Sy1.5 or Sy1.9, i.e. a clear separation of the narrow emission line superimposed on the broad one is visible. Second, it is also due to the lower resolution of our VLT/FORS1 spectra while all other type 1s were observed with the higher spectral resolution of the NTT/EMMI. Thus, we cannot determine the central emission line fluxes relative to H. Moreover, it was difficult to disentangle the [O iii] 4363 Å emission line from the broad H and we therefore do not measure the temperature. MCG -6-30-15 is also the only Seyfert-1 galaxy for which we applied a stellar template subtraction. This was necessary as strong Balmer and Ca ii H&K absorption lines were seen in the NLR spectra (Fig. 2), in agreement with the results of Bonatto et al. (2000) who find an old bulge population dominating the stellar contribution, with indications of previous bursts of star formation.
The continuum gets steadily redder towards the nucleus where it reaches the highest reddening value of 0.30.02 mag. This amount of dust extinction is significantly lower than what has been determined by Reynolds et al. (1997). They were also not able to disentangle the broad and narrow emission lines in their low resolution spectra and use instead the total Balmer decrement. They derive a range of 0.6–1 mag. The difference may arise from either additional reddening of the BLR only [as Reynolds et al. (1997) use the total Balmer decrement] or is due to the fact that our reddening value is a value relative to the stellar template and simply reflects the differences of dust extinction between the NLR and the template. If the extinction is at least partially due to dust in the ISM of the host galaxy as proposed by Ballantyne et al. (2003), both the stellar template and the central continuum suffer the same extinction which will then not reflect in the reddening determined by the fitting of the stellar template to the continuum slope of the NLR spectra.
As the broad Balmer lines are limited to the central 2-3″, we are able to measure the narrow line fluxes in the outer regions to a distance of 4″. We find that the line ratios are typical for AGNs when inserting them in the diagnostic diagrams. Given the broad emission lines, it is reasonable to believe that the central values also lie in the AGN regime and that the NLR extends out to at least 4″ distance from the nucleus.
The BH mass we estimate (0.8-3 107 M⊙) is roughly in agreement with the various measurements of the BH mass presented by McHardy et al. (2005) (3-6 106 M⊙), taking into account the errors.
We used the reddening determined from the continuum slope variation relative to the stellar template to correct the observed [O ii]/[O iii] ratio throughout the whole NLR. The thereby derived ionisation parameter may have a greater uncertainty than using the reddening within the NLR as measured from the Balmer decrement: In those objects in which we measured the reddening from both the continuum slope and the narrow H/H value, we observe differences in the reddening distributions and, moreover, a smaller reddening of the continuum is observed (paper I & II). Thus, for MCG -6-30-15, the absolute ionisation parameter values may be overestimated due to a correction by too low reddening values, but we consider the deduced general behaviour as reliable: In paper I, we have shown exemplarily for NGC 1386 that the general distribution of the ionisation parameter does not change significantly using either reddening values for correction.