X-Ray Observations of Type Ia Supernovae with Swift:
Evidence for Circumstellar Interaction for SN 2005ke
Abstract
We present a study of the early (days to weeks) X-ray and UV properties of eight Type Ia supernovae (SNe Ia) which have been extensively observed with the X-Ray Telescope (XRT) and UV/Optical Telescope (UVOT) onboard Swift, ranging from 5–132 days after the outburst. SN 2005ke is tentatively detected (at a 3–3.6 level of significance) in X-rays based on deep monitoring with the XRT ranging from 8 to 120 days after the outburst. The inferred X-ray luminosity [; 0.3–2 keV band] is likely caused by interaction of the SN shock with circumstellar material (CSM), deposited by a stellar wind from the progenitor’s companion star with a mass-loss rate of . Evidence of CSM interaction in X-rays is independently confirmed by an excess of UV emission as observed with the UVOT onboard Swift, starting around 35 days after the explosion. The non-detection of SN 2005ke with Chandra 105 days after the outburst implies a rate of decline steeper than , consistent with the decline expected from the interaction of the SN shock with a spherically symmetric CSM (). None of the other seven SNe Ia is detected in X-rays or shows a UV excess, which allows us to put tight constraints on the mass-loss rates of the progenitor systems.
1 Introduction
Type Ia supernovae (SNe Ia) are a subclass of exploding stars defined observationally by the absence of hydrogen lines in their optical spectra and the presence of lines from elements such as silicon and sulfur (Leibundgut 2000). There is consensus that SNe Ia are explosions of white dwarfs which occur when accretion from a companion star drives the white dwarf mass close to the Chandrasekhar limit (Woosley & Weaver 1986, Nomoto et al. 2003). However, the details of the system are not fully understood, especially with regard to the type of companion (a main sequence star, a red giant). A useful indicator of the properties of the companion is through its mass loss, which depends strongly on the stellar type. The X-rays and the radio regimes are especially well suited to study the interaction of the SN ejecta with the surrounding CSM, which should be dominated by the companion’s wind. However, no SN Ia has ever been detected in either regime.
In this Letter, we present X-ray and UV data for a sample of eight SNe Ia observed with Swift between 5 and 132 days after outburst. The dates of outburst were estimated to be days before the peak in the -band. The highlight of this study is the tentative detection of SN 2005ke in X-rays with Swift, which was discovered on 2005-11-13.33 UT with the Katzman Automatic Imaging Telescope (KAIT; Baek, Prased & Li 2005) and later classified as an under-luminous SN Ia from the presence of the characteristic 420 nm Ti II and 635 nm Si II lines (Patat & Baade 2005).
2 Observations and Data Reduction
A sample of eight SNe Ia was observed with the XRT (Burrows et al. 2005) and UVOT (Roming et al. 2005) instruments onboard the Swift Observatory (Gehrels et al. 2004), ranging from days to weeks after the outburst. Multiple exposures were obtained in the , , , (181–321 nm), (166–268 nm), and (112–264 nm) UVOT filters and with the XRT (0.2–10 keV band) in photon counting (PC) mode.
The Swift data were analyzed using the HEASOFT111http://heasarc.gsfc.nasa.gov/docs/software/lheasoft/ (version 6.04) and Swift Software (version 2.3, build 17) tools and latest calibration products. X-ray counts were extracted from a circular region with an aperture of radius centered at the optical positions of the SNe. The background was extracted locally from two neighboring circular regions of radius located at the same distances from the nuclei of the host galaxies to account for residual diffuse emission from the galaxies.
A 14.8 ks Chandra ACIS-S Director’s Discretionary Time (DDT) observation of SN 2005ke was obtained on 2006-02-19 (sequence 500693), corresponding to day 105 after the outburst. The data were analyzed with CIAO222http://cxc.harvard.edu/ciao/ (version 3.3.0.1) and the latest calibration products.
3 Properties of the Sample
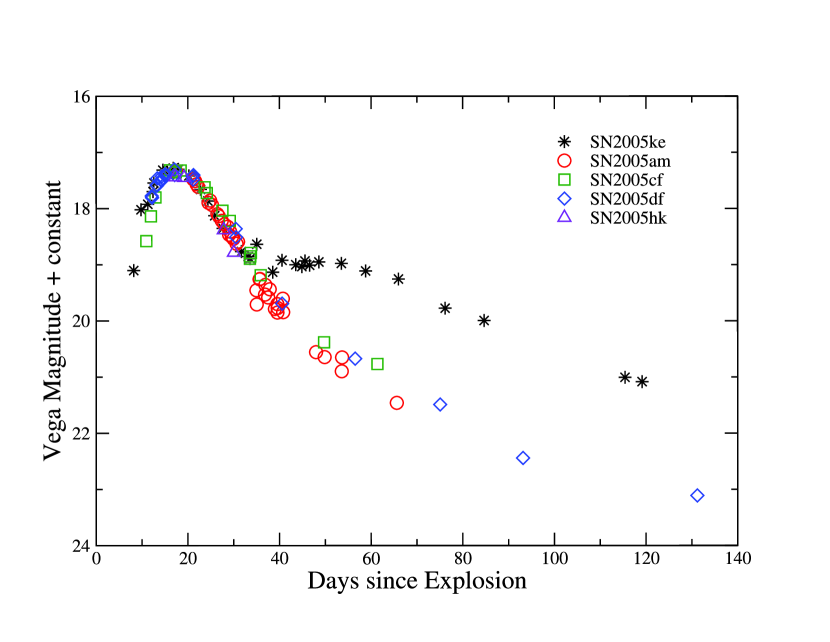
This Swift data set on SNe Ia is unique as it represents the best sample of any SNe Ia observed in the UV. While the UV lightcurves are strikingly similar (see Fig. 1), SN 2005ke shows a significant UV excess starting around day 35 after the outburst. A detailed analysis of the UV lightcurves will be presented in Milne et al. (in preparation).
The upper limits to the X-ray luminosities of SNe 2005am, 2005cf, 2005df, 2005hk, 2006E, and 2006X are a few , implying mass-loss rates lower than a few for thermal emission (see Tab. 1). The mass-loss rate of SN 2005gj is not well constrained owing to the relatively short XRT exposure time (5 ks) and the large distance to the SN (265 Mpc). While the above upper limits are consistent with the X-ray luminosity of SN 2005ke, the SN is peculiar as it is the only SN Ia of our sample showing excess UV emission after peak.
4 Supernova 2005ke
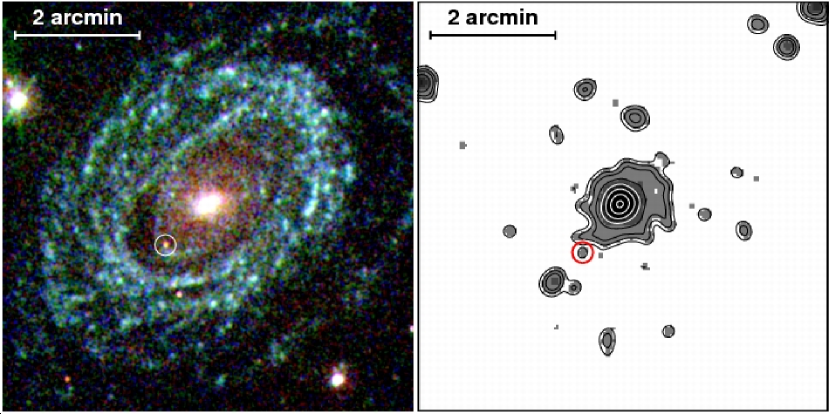
Forty-three individual exposures of SN 2005ke were obtained between 8 and 120 days after the explosion (2005-11-06 days). X-ray and UV images of SN 2005ke and its host galaxy NGC 1371 are shown in Fig. 2.
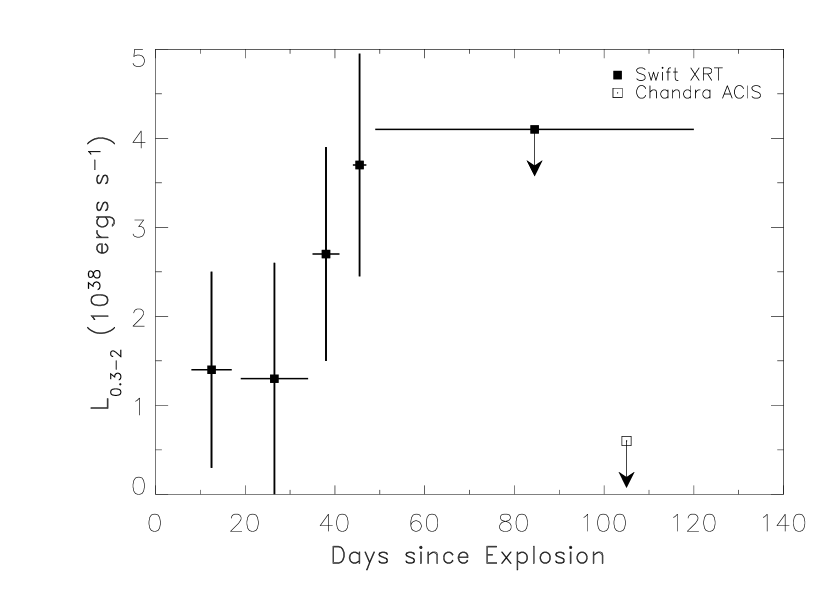
An excess of X-ray counts is detected from the position of SN 2005ke (3–3.6 level of significance depending on the location of the background extraction regions) in the merged XRT data ranging from day 1–54 after the outburst, with a point-spread function, sampling deadtime and vignetting-corrected net count rate of . Adopting a thermal plasma spectrum with a temperature of keV (see Fransson, Lundqvist & Chevalier 1996 and references therein) and assuming a Galactic foreground column density with no intrinsic absorption (; Dickey & Lockman 1990) we obtain a 0.3–2 keV X-ray band flux and luminosity of and , respectively, for a distance of 20.7 Mpc (, , , ; Koribalski et al. 2004). The chance probability of a background AGN at the measured flux being within a radius of of the position of SN 2005ke is estimated to be (Hasinger et al. 2001).
No X-ray source is visible at the position of SN 2005ke in the Chandra observation. The inferred upper limit to the X-ray count rate of corresponds to a flux and luminosity of and , respectively, using the same spectral template above.
The Swift XRT X-ray luminosity inferred for SN 2005ke is lower than the lowest published upper limit of the early X-ray emission of SNe Ia (e.g., for SN 1992A on day 16; Schlegel & Petre 1993). This improvement in the sensitivity of our measurement allows us to place significant constraints on SN Ia models. The SN, however, is not detected at late times (day 105) with Chandra. If the X-ray source detected with Swift is indeed the SN, a rate of decline of with index () is inferred. This is consistent with the X-ray rate of decline expected from the interaction of the SN shock with a spherically symmetric CSM ( for thermal emission), as well as observations of X-ray emitting core-collapse SNe (see Immler & Lewin 2003 and references therein). No other X-ray source or enhancements of the diffuse emission within the host galaxy is visible in the high-resolution ( FWHM ) Chandra images within the XRT counts extraction aperture ( radius), which excludes the possibility that an X-ray binary or clumps in the diffuse emission in NGC 1371 might have caused the excess emission observed with the Swift XRT. Each of the other enhancements in the XRT image, however, have matching Chandra X-rays sources.
In the following we therefore assume that the Swift detection of SN 2005ke in X-rays is real, but even if it is only an upper limit, our analyses hold true.
Our detection implies either X-ray emission from Compton-scattered -rays of the radioactive decay products of the SN ejecta or an interaction of the SN shock with a sufficiently dense CSM. For comparison of the observed X-ray luminosity (or upper limit) with the expected X-ray luminosity from SN Ia models, we calculated the emergent hard X-ray spectrum of model W7 (Nomoto, Thielemann, & Yokoi 1994) using a Monte Carlo -ray transport code to simulate the propagation of photons produced by the radioactive-decay of 56Ni and 56Co and experiencing Compton scattering, photo-electric absorption, and pair production processes (Burrows & The 1990). Bremsstrahlung emission is expected to dominate the radiation in the 0.3–2.0 keV band (Clayton & The 1991). We calculate the bremsstrahlung emergent spectrum of model W7 (as in Clayton & The 1991) but with much improved statistics. The bremsstrahlung component extends to keV at days and lower at later times. The total luminosities in the energy range of 0.3–2.0 keV are , , and at , 38, and 46 days. Clearly, the bremsstrahlung emission from SN Ia models is far below the observed luminosity from SN 2005ke.
A more likely source of the X-ray emission is circumstellar interaction, probably with mass lost by the companion. The reported velocity of the Si II 6,355Å absorption line minimum (; Patat & Baade 2005) provides a lower limit to the shock velocity of the interaction. Models of hydrodynamic interaction for a typical SN Ia density structure show that the forward shock velocity may be (Chevalier & Fransson, in preparation). Assuming a constant mass loss rate and wind velocity from the progenitor’s companion, the thermal X-ray luminosity of the forward shock region is (Immler, Wilson & Terashima 2002)333Note the missing factor 4 as a correction to Immler, Wilson & Terashima (2002), where is the mean mass per particle ( g for a H+He plasma) and the cooling function of the heated plasma at temperature . Because of the higher density at the reverse shock, it is likely for the reverse shock component to dominate the luminosity by a factor of – (Chevalier 1982). Adopting , an effective cooling function of for an optically thin thermal plasma with temperature of K for the forward shock (Fransson, Lundqvist & Chevalier 1996; Raymond, Cox & Smith 1976), and , a mass-loss rate of with an uncertainty of a factor of 2–3 is inferred. Assuming different plasma temperatures in the range – K would lead to changes in the emission measure of .
The mass-loss rate is one of the lowest reported for any SN progenitor system detected either in X-rays (Immler & Lewin 2003) or in the radio (Weiler et al. 2002). However, Panagia et al. (2006) have recently presented upper limits on the radio emission from a number of SNe Ia which are interpreted as setting upper limits on as low as . In addition, Soderberg (2006) reports the nondetection of SN 2005ke at 8.46 GHz, although flux limits are not given.
X-ray emission from SNe is usually interpreted as thermal radiation. At low circumstellar densities, nonthermal mechanisms may dominate and could be as low as for in SN 2005ke (Chevalier & Fransson in preparation). However, the nondetection of radio emission could limit the applicability of these mechanisms.
We rebinned 268 ks of XRT data of SN 2005ke into five consecutive time bins with similar exposure times (47, 47, 62, 56, and 55 ks) to further study the temporal behavior of the X-ray emission (see Fig. 3, left-hand panel). Although the X-ray light curve is consistent with a constant X-ray luminosity during the period monitored, we find marginal evidence that the X-ray luminosity might have increased during the early observations. The X-ray rise could be due to decreasing absorption by material along the line of sight to the hot gas as the expanding shell becomes optically thin, although we do not expect local absorption to be important for our deduced parameters.
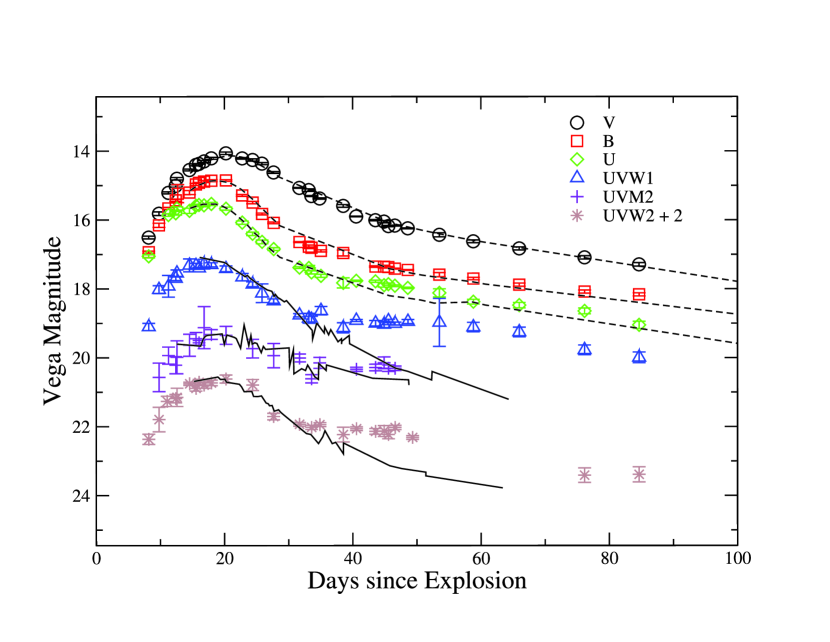
Significant excess in the UV output of SN 2005ke starts around day 35 after the explosion, especially in the and filters (see Fig. 3, right-hand panel). No such excess is observed in the optical band lightcurves. Possible effects of CSM interaction on UV emission are inverse Compton scattering of photospheric photons by hot electrons or a reduction of UV line blanketing due to heating and ionization by circumstellar radiation. The luminosity of the UV excess dropped by a factor of between days 45 and 105, as estimated from comparisons with the other SN Ia light curves. If the X-ray luminosity experienced a similar drop during that time period, the Chandra upper limit may not be in conflict with the XRT detection.
Evidence for CSM interaction has only been reported for a few SNe Ia (e.g., SNe 1999ee, Mazzali et al. 2005; 2002ic, Hamuy et al. 2003, Chugai, Chevalier & Lundqvist 2004, Kotak et al. 2004, Deng et al. 2004, Nomoto et al. 2005; 2003du, Gerardy et al. 2004; 2005cg, Quimby et al. 2006; and 2005gj, Prieto et al. 2005) based on optical spectroscopy. Our detection of CSM interaction in X-rays is independently confirmed by the excess of UV emission after maximum. The most plausible explanation for the presence of dense CSM is that a more massive companion star () blew-off its outer layers via stellar winds or Roche lobe overflow over the last few ten thousand years before the accreted mass from the companion star pushed the progenitor close to the Chandrasekhar limit, resulting in a SN Ia explosion.
References
- (1) Baek, M., Prased R. R., Li, W. 2005, IAU Circ. 8630, 1
- (2) Brown, P. J., et al. 2005, ApJ 635, 1192
- (3) Burrows, D. N. et al. 2005, Space Science Reviews 120, 165
- (4) Burrows, A., The, L.-S. 1990, ApJ 360, 626
- (5) Chevalier, R. A. 1982, ApJ 259, 302
- (6) Chugai, N. N., Chevalier, R. A., Lundqvist, P. 2004, MNRAS 355, 627
- (7) Clayton, D. D., The, L.-S. 1991, ApJ 375, 221
- (8) Deng, J. et al. 2004, ApJ 605, L37
- (9) Dickey, J. M., Lockman, F., J. 1990, ARA&A 28, 215
- (10) Fransson, C., Lundqvist, P., Chevalier, R. A. 1996, ApJ 461, 993
- (11) Garnavich, P. M. et al. 2004, ApJ 613, 1120
- (12) Gehrels, N. et al. 2004, ApJ 611, 1005
- (13) Gerardy. G. L. et al. 2004, ApJ 607, 391
- (14) Hamuy, M. et al. 2003, Nature 424, 651
- (15) Hasinger, G., et al. 2001, A&A 365, L45
- (16) Immler, S., Wilson, A. S., Terashima, Y. 2002, ApJ 573, L27
- (17) Immler, S., Lewin, W. 2003, in Supernovae and Gamma-Ray Bursters (ed K. Weiler), Lecture Notes in Physics, 598, 91
- (18) Koribalski, B. S., et al. 2004, AJ 128, 16
- (19) Kotak, R., Meikle, W. P. S., Adamson, A., Leggett, S. 2004, MNRAS354, L13
- (20) Leibundgut, B. 2000, The Astron. and Astroph. Rev. 10, 209
- (21) Mazzali P. A. et al. 2005, MNRAS 357, 200
- (22) Nomoto. K., et al. 2005, in “1604-2004: Supernovae as Cosmological Lighthouses”, ASP Conf. Ser. 342, eds. M. Turatto, et al. (ASP), 105
- (23) Nomoto. K., et al. 2003, in “From Twilight to Highlight: The Physics of Supernovae,” eds. W. Hillebrandt & B. Leibundgut (Springer), 115 (astro-ph/0308138)
- (24) Nomoto. K., Thielemann, F.-K., Yokoi K. 1984, ApJ 286, 644
- (25) Panagia, N., Van Dyk, S. D., Weiler, K. W., Sramek, R. A., Stockdale, C. J., & Murata, K. P. 2006, ApJ, in press (astro-ph/0603808)
- (26) Patat, F., Baade, D. 2005, IAU Circ. 8631, 1
- (27) Prieto, J. et al. 2005, IAU Circ. 8633, 1
- (28) Quimby R. et al. 2006, ApJ 636, 400
- (29) Raymond, J. C., Cox, D. P., Smith, B. W. 1976, ApJ 204, 290
- (30) Roming, P. W. A. et al. 2005, Space Science Reviews 120, 95
- (31) Schlegel, E. M., Petre, R. 1993, ApJ 412, L29
- (32) Soderberg, A. M. 2006, ATel 722
- (33) Weiler, K. W., Panagia, N., Montes, M. J., Sramek, R. A. 2002, ARA&A 40, 387
- (34) Woosley, S. E., Weaver, Th. A. 1986, ARA&A 24, 205
| SN | Galaxy | Start | Stop | Distance | Exposure | Rate | ||||
|---|---|---|---|---|---|---|---|---|---|---|
| [MJD] | [MJD] | [Mpc] | [] | [ks] | [] | [] | [] | [] | ||
| (1) | (2) | (3) | (4) | (5) | (6) | (7) | (8) | (9) | (10) | (11) |
| 2005am | NGC 2811 | 53433.94 | 53507.14 | 33.6 | 4.5 | 62.6 | ||||
| 2005cf | MCG -01-39-3 | 53525.04 | 53574.67 | 27.4 | 7.0 | 53.8 | ||||
| 2005df | NGC 1559 | 53592.11 | 53711.25 | 18.4 | 2.7 | 25.8 | ||||
| 2005ke | NGC 1371 | 53688.68 | 53799.72 | 20.7 | 1.4 | 267.8 | ||||
| 2005gj | anonymous | 53698.13 | 53698.33 | 264.5 | 7.1 | 5.0 | ||||
| 2005hk | UGC 272 | 53677.75 | 53744.66 | 55.6 | 2.8 | 45.1 | ||||
| 2006E | NGC 5338 | 53748.83 | 53763.23 | 11.5 | 2.1 | 10.1 | ||||
| 2006X | NGC 4321 | 53774.34 | 53806.77 | 17.1 | 2.4 | 25.3 |
Note. — (1) Name of the SN; (2) host galaxy; (3) start of the observation in Modified Julian Day; (4) end of the observation in Modified Julian Day; (5) distance in units of Mpc, using the NED redshifts of the host galaxies and assuming , , ; (6) Galactic foreground column density in units of , Dickey & Lockman 1990; (7) Swift XRT exposure time in units of ks; (8) upper limit to the 0.2–10 keV count rate in units of ; (9) upper limit to the 0.2–10 keV X-ray band flux in units of ; (10) upper limit to the 0.2–10 keV X-ray band luminosity in units of ; (11) mass-loss rate of the progenitor systems in units of .