A Database of 2MASS Near-Infrared Colors of Magellanic Cloud Star Clusters
Abstract
The (rest-frame) near-IR domain contains important stellar population diagnostics and is often used to estimate masses of galaxies at low as well as high redshifts. However, many stellar population models are still relatively poorly calibrated in this part of the spectrum. To allow an improvement of this calibration we present a new database of integrated near-infrared JHKs magnitudes for 75 star clusters in the Magellanic Clouds, using the 2-Micron All-Sky Survey (2MASS). The majority of the clusters in our sample have robust age and metallicity estimates from color-magnitude diagrams available in the literature, and populate a range of ages from 10 Myr to 15 Gyr and a range in [Fe/H] from to dex. A comparison with matched star clusters in the 2MASS Extended Source Catalog (XSC) reveals that the XSC only provides a good fit to the unresolved component of the cluster stellar population. We also compare our results with the often-cited single-channel JHK photometry of Persson et al. (1983), and find significant differences, especially for their 30″-diameter apertures up to mag in the -band, more than 1 mag in , and up to 0.5 mag in . Using simulations to center apertures based on maximum light throughput (as performed by Persson et al.), we show that these differences can be attributed to near-IR-bright cluster stars (e.g., Carbon stars) located away from the true center of the star clusters. The wide age and metallicity coverage of our integrated JHKs photometry sample constitutes a fundamental dataset for testing population synthesis model predictions, and for direct comparison with near-IR observations of distant stellar populations.
1 Introduction
Much of our understanding of galaxy formation and evolution comes from studying stellar populations in different galaxy types, both in the present and early universe. Two key parameters of stellar systems which are widely used throughout the literature are mean ages and metallicities. Ages and/or metallicities of stellar systems in photometric surveys are estimated by comparing measured integrated colors with the predictions of evolutionary synthesis models (e.g. Bruzual & Charlot, 1993, 2003; Worthey, 1994; Vazdekis, 1999; Maraston, 1998, 2005). These models utilize stellar isochrone libraries, which are synthesized in appropriate combinations to represent stellar systems at different ages and metallicities. There are however, two important limitations inherent to these models. First, the stellar libraries themselves contain mostly stars in the solar neighborhood, which have a star formation history that is not necessarily typical for extragalactic populations (e.g., relatively little variation in chemical composition). Second, the synthesis models oversimplify the more rapid (but very luminous) phases of stellar evolution (e.g., thermally pulsing asymptotic giant branch stars). Given the very fundamental nature of the information that is derived by comparison with these models, it is imperative that population synthesis models be as accurate as possible.
Simple stellar population (SSP) models are empirically calibrated to observations of real star clusters for which ages and metallicities are known from independent analysis, e.g., color-magnitude diagrams (e.g. Bruzual et al., 1997; Maraston et al., 2003). While much of the work to date has been carried out at optical wavelengths, the near-infrared (NIR) regime contains some very important diagnostics for deriving basic properties of stellar systems. In fact, this wavelength regime has been shown to be very important for sorting out the effects of age and metallicity, particularly in stellar populations older than about 300 Myr (e.g. Goudfrooij et al., 2001; Puzia et al., 2002; Hempel & Kissler-Patig, 2004). Due to recent advances in the instrumentation and detector capabilities in the NIR passbands, and considering the focus on the infrared in the next generation of telescopes, it is clear that the accuracy of SSP models in the NIR is going to be even more important in the future.
In this work, we present integrated NIR colors of a large sample of star clusters in the Large and Small Magellanic Cloud (hereafter LMC and SMC). We make use of data from the Two Micron All Sky Survey (2MASS Skrutskie et al., 1997), which offers uniform, high-quality imaging of the entire sky in three bands, (1.25 m), (1.65 m), and 111For a description of the ” short” () band, see Persson et al. (1998). (2.16 m). Our main goal is to provide a new database of intrinsic NIR magnitudes and colors of clusters with well-known ages and metallicities from deep color-magnitude diagrams (CMDs), that can be utilized as a calibration dataset by existing and future generation SSP models. The clusters in the Magellanic Clouds are very suitable for addressing this issue. They cover a wide range of ages, and they are close enough for detailed CMD studies using the Hubble Space Telescope (HST), (in some cases also with large telescopes from the ground). Unlike the globular cluster system (GCS) of our Galaxy, there are a significant number of objects with intermediate ages ( Gyr) in the LMC and SMC. The integrated-light properties of these systems are affected strongly by AGB stars which are extremely luminous in the NIR, and their contribution to the light in that part of the spectrum is largely underestimated by most existing SSP models (see Maraston, 2005).
The measurement of integrated magnitudes and colors of star clusters in the Magellanic Clouds is complicated by several factors. One problem is that of accurate centering of the aperture. Many of these clusters are superposed onto a relatively high surface density of stars associated with the LMC or SMC, and some have a rather irregular field distribution and/or are not particularly symmetric due to the superposition of bright stars (be it supergiants or AGB stars, associated with the cluster itself, those from the body of the LMC or SMC, or Galactic foreground stars). On the other hand, it should be recognized that the use of 2-dimensional imagery renders these problems much less severe than they were for often-cited previous studies which used single-channel photometers and diaphragms which were centered either by eye or by maximum throughput.
The present study is complementary to the information about Magellanic Cloud clusters in 2MASS Extended Source Catalog (XSC Jarrett et al., 2000) in three ways: (i) providing photometry for a set of clusters that are not present in the 2MASS XSC; (ii) we take into account the flux from the point sources associated with the star clusters, which are rejected by the XSC pipeline (see §3.2 for details); (iii) better sampling of the curves of growth with a step of 1″, instead of 11 fixed circular apertures.
This paper is organized as follows: Section 2 describes the sample selection, data acquisition and reduction. The results, including comparison with previous works and 2MASS XSC are presented in §3. Finally, a summary is provided in §4.
2 Near-Infrared Data
2.1 Sample selection
Our original sample of star clusters was adopted from Mackey & Gilmore (2003a, b), and most have accurate CMD ages and metallicities from the literature. We particularly pay attention to the largest possible coverage of the available age/metallicity parameter space. In addition, we select intermediate-age and young clusters which have no known counterparts in the Milky Way globular cluster system. The adopted distance moduli are and for the SMC (Harries et al., 2003) and LMC (Alves, 2004) respectively. Basic information for all objects is provided in Tables A Database of 2MASS Near-Infrared Colors of Magellanic Cloud Star Clusters and A Database of 2MASS Near-Infrared Colors of Magellanic Cloud Star Clusters (respectively for star clusters in the SMC and LMC).
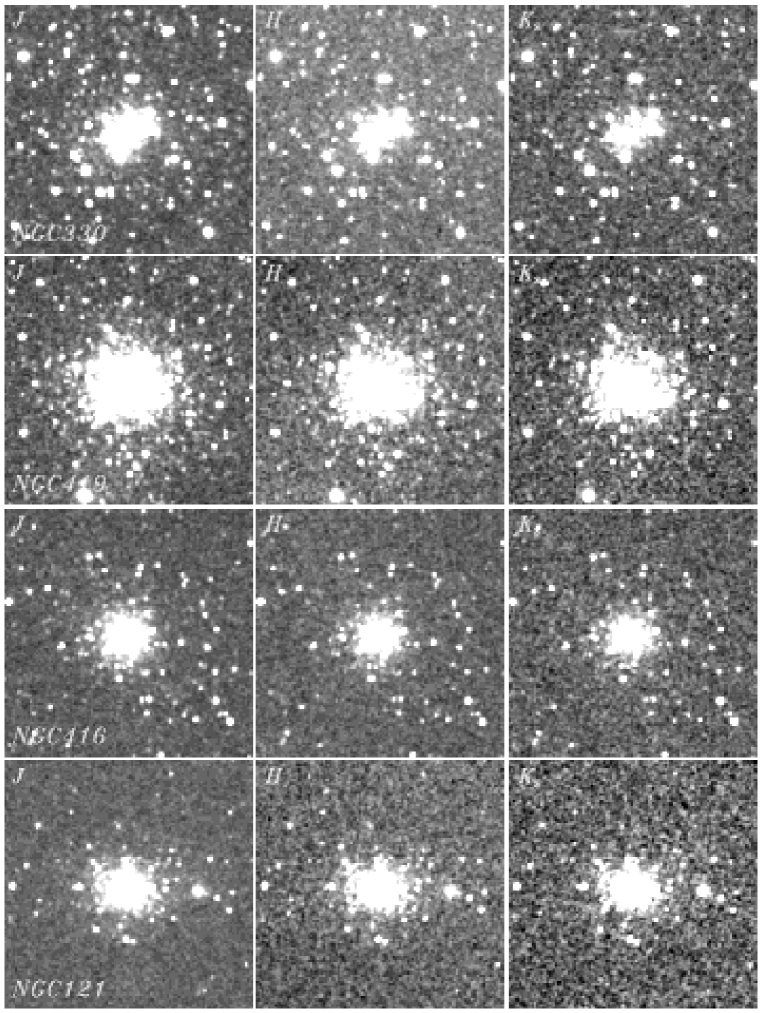
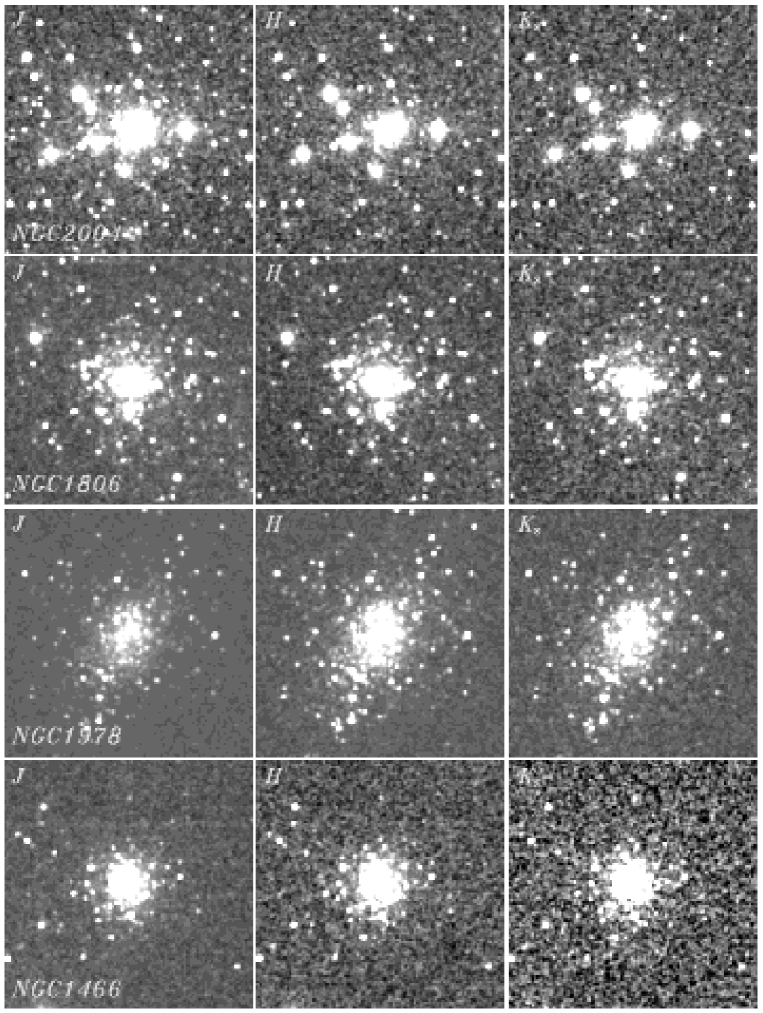
The young SMC cluster NGC 176 was included in the original list, but after inspection of the 2MASS images it became clear that the NIR data is too shallow to derive reliable integrated colors. R136 in LMC, the youngest object in the preliminary selection, is embedded in an extensive emission region that would affect the results of the integrated photometry. We decided not to include these two clusters in the final list. , , and postage stamp images of representative objects in our sample are presented in Figure 1 (SMC) and 2 (LMC). -band frames for the majority of the SMC objects, included in this work, can be found in Hill & Zaritsky (2005).
2.2 2MASS Atlas Images
The 2MASS Atlas Images originate from 6∘-long survey scans using an effective integration time of 7.8 seconds per tile. , , and images were retrieved using the 2MASS interactive image service222http://irsa.ipac.caltech.edu/applications/2MASS/IM/intera ctive.html. The queries were usually sent by object name and in some cases, when the name qualifier was not recognized, by coordinates. In most cases an object could be found on several sets of frames, allowing us to choose the best one, taking into account the relative position of the cluster and the characteristics of each field. Tables 3 and 4 provide information on the Atlas Images, selected for our study, for SMC and LMC clusters, respectively. Column 2 in these tables provides the number of different sets of images retrieved for each object.
The raw survey data was reduced at the Infrared Processing and Analysis Center with the pipeline specifically developed for 2MASS. The imaging data is resampled to 1″/ pixel, calibrated to one second integration time and contain both the astrometric solution and the photometric zero points for each individual Atlas Image (Cutri et al., 2003). The astrometric solutions are obtained in the International Celestial Reference System via the Tycho-2 Reference Catalog. Taking into account the higher value of the extended source uncertainty (Cutri et al., 2003), all cluster positions derived in the present work were rounded to the nearest half pixel (05).
The photometric zero points are based on observations of fields, covering the NIR standards from the list of Persson et al. (1998) or the UKIRT group of faint, equatorial NIR standard stars (Casali & Hawarden, 1992). The solution is derived independently for each band and minimizes the residuals by a least square fit of the zero point, airmass, and atmospheric extinction (Nikolaev et al., 2000). The distributions of the zero point differences for all standard fields in all survey nights turned out to be Gaussian with RMS residual values of 0.011, 0.007 and 0.007 magnitudes in , and , respectively (Cutri et al., 2003). These values are added in quadrature to the photometric errors in this work.
2.3 Data analysis
In order to measure the integrated cluster magnitudes, the following multistep procedure was applied to each object of the sample:(i) PSF-fitting photometry of the point sources; (ii) determination of the center position for the integrated curve of growth photometry; (iii) subtraction of the background/foreground point source luminosity function (LF) from the LF of the cluster field; (iv) integrated photometry of the total, background-subtracted and unresolved component of the object in each survey band; (v) calculation of the photometric errors for each measurement aperture.
For basic data analysis we use the suite of IRAF333IRAF is distributed by the National Optical Astronomical Observatory, which is operated by the Associations of Universities for Research in Astronomy Inc., under cooperative agreement with the National Science Foundation. tasks and perform DAOPHOTII/ALLSTAR photometry (Stetson, 1987) on each frame. Typically several bright and well-isolated stars were used to construct the PSF for each frame. As this is only an intermediate stage in the process of deriving the total integrated cluster magnitudes, aperture corrections are not applied at this point. The ALLSTAR routine is used to produce frames on which individual stars are removed after being measured. We will refer to these frames as ”residual frames”, which will later be used to study the part of the cluster stellar population not resolved in the 2MASS images.
In many cases the coordinates taken from cluster catalogs in the literature do not provide an accurate position for the center of individual clusters. We applied a simple and robust method to derive the centers in the present paper. The original frames and the residual frames in each survey band were smoothed with a large Gaussian kernel. The size of the kernel varied as a function of the cluster size on the frames, where the sensitivity of 2MASS reaches its peak. The maximum flux values on an image subsection of the smoothed images in each of the survey bands, derived by the IRAF task MINMAX were used to determine the individual cluster centers in and . They were later averaged to derive the final center coordinates that were used for the integrated photometry in the present paper. Possible sources of confusion (e.g., bright stars outside the cluster area, present on the original Atlas frames) were avoided by performing the procedure described earlier on an image subsection, covering the rough cluster position on the smoothed images. We point out that the cluster images in Figures 1 and 2 are extracted from the 2MASS frames, using the centers derived with this procedure. Each image covers 200″ 200″ and is representative of the size of the largest aperture used to measure integrated cluster magnitudes.
In a few cases the object was situated close to the edge of the Atlas frame. This is not a serious problem for most clusters because we were still able to sample the flux out to large enough radii to derive the total integrated magnitudes. One exception was Lindsay 1 which was split almost equally between two sets of frames. The special data reduction procedure, applied to this object is described in Section 2.7 below.
2.4 Stellar Background Subtraction
To estimate the contamination of our globular cluster fields by foreground stars and stars associated with the body of the LMC or SMC we used the portion of the frames outside of the largest aperture used for integrated-light photometry, (typically 100 ″). The luminosity function (LF) for the point sources in these background regions was scaled to the cluster area used for photometry. This was statistically subtracted from the point source LF measured inside the photometric radius. The area of the background regions slightly varied as a function of the largest aperture size, but even in the case of 100 ″aperture radii it was more than 15 times larger than the photometry area. In this way we achieve a good estimate of the background/foreground contamination, one which is much less affected by local stellar variations and therefore superior to just subtracting a normalized background flux from a neighboring annulus. To illustrate our procedure, in Figure 3 we show the LFs of the background, cluster, and the cleaned LF after the background subtraction, for the heavily contaminated cluster NGC 330.
In cases where bright stars (not sampled by the field star LF) are present in the cluster aperture, after the background subtraction we are utilizing their ALLSTAR PSF magnitudes and corresponding colors to make a rough estimation of the spectral and luminosity class using the work of Ducati et al. (2001). The visual magnitudes of these objects were recovered using the visual – infrared colors from the same study for a certain spectral and luminosity class. The results were compared with the age of the cluster and the expected absolute visual magnitudes of these stars at the distance to SMC or LMC. If there was a discrepancy between the measured and expected magnitudes or if such stars were unlikely to be found in a cluster with the given age, they were subtracted. There are several examples of this procedure described in Section 2.7.
2.5 Integrated Cluster Photometry
The aperture photometry of the clusters was performed with IRAF APPHOT package on a set of three residual images in each survey band. The images are a result by the application of DAOPHOT/ALLSTAR and the IRAF SUBSTAR procedure on the original atlas frames. On the first of them all detected point sources were removed (actually this is the output residual image from ALLSTAR), on the second the LF of the background field was subtracted from the cluster area using SUBSTAR with a exclude file, containing the stars remaining after the statistical subtraction, the third image contained all the point sources within the photometry aperture. The images were used to measure the flux from the unresolved component, background subtracted and the total flux from the object, using a set of apertures ranging from 1″ to 100 ″ in radius with a step size of 1″. We computed curves of growth for all sample globular clusters in the three survey bands. The sky background level in each frame was estimated in a sky annulus encircling our largest aperture with width at least 10 pixels. The exclusion of the stars outside of the largest aperture prior to the final integrated photometry is providing a better estimate of the sky background. In those cases where the cluster was situated close to the frame edge, we used the largest aperture possible, and the background levels were measured in a nearby region that matched or exceeded the equivalent area of a full background annulus circle.
For each aperture the error introduced by the stochastic fluctuations in the stellar population of the foreground/background was estimated. We computed the luminosity function (LF) of objects outside each photometry aperture for each particular object. The corresponding flux was integrated over the entire LF and the standard deviation of stellar counts were calculated in bins of mag. These values were then normalized to the area used for the cluster photometry. Bright stars close to saturation were identified on the images and excluded from the photometry prior to the procedures described above. The error values listed in Tables 5 and 5 in each survey band are the quadrature sum of the photometry errors from APPHOT, the 2MASS zero point errors and the calculated background stochastic fluctuations. In general, the errors of our photometry increase as a function of aperture radius and depend on background properties.
Example curves of growth of the photometry for the SMC cluster NGC 411 and LMC cluster NGC 2231 are presented in Figures 4 and 5, respectively. The solid line shows the magnitude of the cluster after background subtraction. The estimated errors due to stochastic background fluctuations are overplotted with dotted lines. The dashed curve represents the total flux from the cluster (without background subtraction), and the unresolved component is plotted with dot-dashed lines. NGC 2231 in Figure 5 also illustrates what could be the effect on the integrated magnitudes of the cluster if there is improper handling of the background subtraction. This cluster lie in a region of rellativelly high apparent stellar density and there are several bright stars present. The stochastic fluctustions of the stellar background show the possibility of a severe overestimation of the cluster total magnitude if the influence of the bright stellar objects is not taken into account. Note that the error values in Table 5 are calculated with the bright stars excluded from the background LF. Integrated magnitudes and photometric curves of growth for all star clusters analyzed in this study are available upon request from the first author.
2.6 Extinction correction
In order to determine the intrinsic magnitudes and colors of our sample clusters, the measurements must be corrected for the effect of extinction. Cluster extinction values were obtained from three independent studies: Burstein & Heiles (1982), Schlegel et al. (1998), and the Magellanic Clouds Photometric Survey (MCPS, Zaritsky et al., 1997): see Zaritsky et al. (2002) for SMC and Zaritsky et al. (2004) for LMC. The study by Burstein & Heiles is based on maps of the HI emission, while the Schlegel et al. maps use IRAS/DIRBE data of the FIR sky emission. The corrections provided by Schlegel et al. (1998) are superior to those of Burstein & Heiles (1982), because of the improved spatial resolution and the fact that they estimate the extinction from the dust properties directly, not using HI as an intermediate agent. But there is an important caveat - the Schlegel et al. maps are highly uncertain in the inner regions of the Clouds because their temperature structure wasn’t sufficiently resolved by DIRBE. The most recent development in Magellanic Clouds extinction work is the MCPS data. This survey covers the central 44∘ of the SMC and 88∘ of the LMC in UBVI. The limiting magnitude of the MCPS maps (set primarily by crowding) is mag. However, these maps cover only the inner body of the Magellanic Clouds and extinction information for star clusters located in the outer regions is not available.
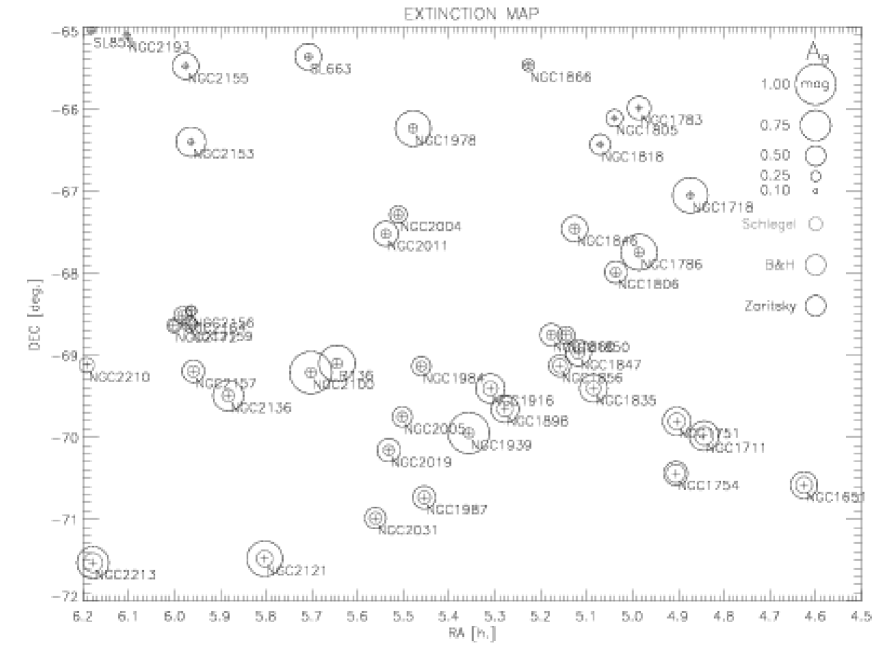
Extinction estimates based on HI emission and IRAS/DIRBE dust maps were retrieved for all objects from NASA/IPAC Extragalactic Database (NED). The values from MCPS were retrieved using the online tools available on the webpage of the project444http://ngala.as.arizona.edu/dennis/mcsurvey.html. The MCPS maps provide a statistical approach to the extinction: stellar atmosphere models are fit to their measured UBVI magnitudes of all the stars in an user defined search radius with good quality photometry and good model fits (Zaritsky, 1999). The distribution of the extinction values is built and the result of the mean extinction and of the distribution is given. There are different options available, but for the current work we chose to use the estimates based on ”cool” stars (T K) in the search radius. Since cool stars are more homogeneously distributed than hot stars, extinction measurements from cool stars should provide a more representative estimate of the true extinction value. The extinction map of the central region of the LMC, showing all the objects with estimates available from the three studies is presented in Figure 6. Generally the values from Burstein & Heiles (1982) and Schlegel et al. (1998) are in good agreement, but, in most cases, lower than those derived from Zaritsky et al. (2004). Using a search radius of 2′, which is slightly larger than our largest photometry aperture, we achieve a robust estimate of the extinction towards a specific object.
We use the extinction values based on the MCPS maps. In those cases where no MCPS data is available, we adopt a typical extinction value, derived from all objects with extinction estimates from MCPS. These mean values were derived by fitting the extinction distribution for 40 LMC and 9 SMC clusters by a gaussian (see Figure 7). The adopted values are: and for LMC, and for SMC. They are higher than the mean values from Schlegel et al., which are and for LMC and SMC, respectively. This result is consistent with the fact that the extinction values for LMC and SMC listed in Schlegel et al. (1998) only provide lower limits: They only account for Galactic dust, whereas the dust in the Clouds is not taken into consideration.
We adopt the extinction law of Bessell & Brett (1988).
To account for the younger stellar population in objects in our sample with , we are using the extinction values based on all stars. This approach is providing a better estimate than ”hot” star (T K) alone, because it is reducing the influence of the relatively shallow MCPS band photometry.
2.7 Notes on individual objects
There are a few cases in which the data reduction and photometry differed slightly from the procedure described above. Additional remarks for these clusters are provided below.
NGC 121 There is a relatively bright star located ″ W from the center of the cluster. An inspection of 2MASS and optical images (from SIMBAD555http://simbad.u-strasbg.fr/) showed that it is most likely a foreground star superposed on the cluster. Its magnitudes from ALLSTAR output files are , and . The extinction correction values are taken from Burstein & Heiles (1982) and Schlegel et al. (1998) (we discuss extinction corrections in detail in Section 2.6). They are and 0.16, respectively, and we use their mean in this analysis. The measured colors are: , , . Comparing with the results of Ducati et al. (2001) for intrinsic NIR colors of stars shows that its colors are consistent with a K main-sequence, G giant or supergiant star. In the latter case, rough derivation of the absolute visual magnitude at the distance of SMC gives mag. This is consistent with the star being a supergiant, but it is not likely that such an object is found in a Gyr old star cluster. Therefore, we assume that the star belongs to the foreground and subtract it prior to the final cluster photometry.
NGC 339 This object is relatively close to the edge of the Atlas Image. The radius of the largest aperture used for photometric measurements is 90″. In all cases, when the maximal size of the apertures was smaller than the typical value of 200″, the last entries for the particular object in Table 5 or 6 are the magnitudes measured in the largest apertures used.
NGC 419 There is a bright star in the aperture area ″ SSE from the center used for photometry. It is clearly visible on the optical frames retrieved from SIMBAD. Given its colors of and we conclude that it is most likely a foreground object and subtract it prior to the final measurements.
NGC 458 This young cluster is barely visible in the 2MASS frames, in particular in and where the infrared sky background is significantly higher. The curves of growth in these bands start to decline for aperture diameters larger than 80″. We provide integrated magnitudes only up to 90″ aperture radius, due to the proximity of this cluster to the edge of the Atlas Image, but the results for the largest radius must be treated with caution.
Lindsay 1 The cluster was split almost equally between two sets of frames. To derive its integrated magnitudes we could not use the usual centering routine and the center was derived ”by eye”, accounting for the appearance and position of the cluster on each image. The fluxes from the two halves were measured independently, summed together, and converted into magnitude values. The frames originate from the same scan, acquired on Aug. 8 1998 between 07:03:03.00 and 07:08:51.00 UT. The regions of the sky on these images were observed at 07:03:43.51 and 07:04:01:38 UT one after another. Hence, we averaged the zero points of the frames and used that value for the derivation of the magnitudes. The mean zero points were 20.8522, 20.4090 and 19.8725 in , and , respectively. The errors of the photometry were estimated in accordance to the described procedure.
NGC 1711 There is a chain of so-called persistence artifacts in close vicinity to the cluster. These features most likely originate from a bright star outside of the current Atlas Image. Two of them affect the photometry, are located at distances 47″ and 66″ from the center. They are well outside of the unresolved cluster component, and were measured independently on the residual frames. Their flux was subtracted from the affected apertures before calculation of the magnitude values. The rest of the artifacts were avoided by specifying a larger radius for the background annulus. The resulting errors for this cluster were estimated by taking into account the effect of the artifact removal.
NGC 1754 A bright star is present ″ SE from the center of the cluster, also clearly visible on the visual frames from SIMBAD. The magnitude values derived from our PSF photometry are =9.31, =8,79, =8.68 mag and the resulting colors: = 0.52, = 0.11, = 0.63. This case is similar to NGC 121 in the SMC. The extinction value towards that object was retrieved from the reddening estimator for LMC on the webpage of MCPS = 0.4. The corrected colors of the star are then , and . These colors best match those of a G4 giant from Ducati et al. (2001). The measured absolute visual magnitude is not compatible with the predictions for a G4 giant. The estimated age of the cluster ( 15Gyr) is rules out the possibility that the star is a supergiant. Most likely it is a foreground star and we excluded it from the measurements of the total cluster luminosity.
NGC 2136 This is one of the most interesting objects in our sample. The cluster is 100 Myr old and there is a ”satellite cluster” clearly visible on both visual and near-infrared images 80″ from the central position derived in the present work. The difference between the coordinates retrieved from SIMBAD and the actual center is 166 pixels on the 2MASS frame. The object is also off-centered on the optical frame downloaded from the same database as the coordinates. We conclude that the most probable cause of this discrepancy is a mistake in the coordinates listed in SIMBAD. They are given in Table A Database of 2MASS Near-Infrared Colors of Magellanic Cloud Star Clusters, and the values derived for the centering in the present work are listed in Table 6.
There are two bright stars in the set of apertures used to built the curve-of-growth. An analysis similar to the case of the stars in the field of NGC 121 and NGC 1754 led us to the conclusion that the absolute visual magnitudes differ from these expected for luminous stars of these spectral types. We chose at that point to exclude them from the final photometry.
NGC 2153 This object was situated too close to the frame edges on all the sets of Atlas Images available. We chose those with the best possible location, but the largest aperture radius is still only 40″ before running into the frame edge. However, the cluster is compact and even in that significantly smaller aperture set (compared to that typically used in this work) the curves-of-growth indicate sampling of the entire flux from the object. In fact there is some decline observed in for aperture radii larger than 20″. The most likely explanation is local variation in the background, typical for the band. Due to the position of the object the background levels were estimated in a region of the sky close to the cluster. We present the results for the complete set of apertures, but the values of magnitudes must be treated with caution for radii exceeding 20″.
SL 842 This compact cluster is barely detected by 2MASS. Photometry is performed with the entire set of apertures, but the results become highly unreliable for aperture radii exceeding 30″. This aperture appears to encompass the measurable flux from the object and these are the results listed in Table 6.
SL855 The cluster is barely visible on the Atlas Images. The photometry was initially performed with the entire set of apertures. The shape of the curves-of-growth and inspection of the frames led us adopt a more conservative approach, and we list only the results to aperture radius 10″.
ESO121-003 The cluster is faint and extended. It is detected by 2MASS, but the curves of growth are noisy.
3 Results
The results from the integrated 2MASS photometry of the entire Magellanic Clouds cluster sample are presented in Tables 5 and 6. (The entire tables are available in the electronic version of the journal.) A set of typical NIR , , and curves of growth of four SMC clusters, ranging in age from 25 Myr to 12 Gyr is given on Figure 8. A closer look at the curve of the youngest cluster NGC 330 reveals well visible ”bumps”. These are bright stars contributing to the total light; these are common for young and some of the intermediate-age clusters, and are most likely massive young supergiants and carbon stars, which emit significant amounts of light in the NIR. Figure 9 presents curves of growth for LMC clusters also covering a representative age range. The corresponding images of these objects are presented in Figures 1 and 2 for the SMC and LMC, respectively.
The carbon stars present in some intermediate-age clusters are easily distinguished by their colors and luminosity as mentioned by Frogel et al. (1990). They also affect the curve of growth in a typical way, leaving a ”fingerprint” of their presence. A good example is the LMC cluster NGC 2190. The curves of growth for this cluster cover the carbon star KDMK6996 (Kontizas et al., 2001) and another candidate carbon star closer to the cluster center (see Figure 10). The features at ″ and 60″ radii are caused by carbon stars entering the aperture. Note the steeper increase of the curve of growth for compared to those for and , and the corresponding features in the flux curves. The carbon star identification is based on the magnitudes and colors from their PSF photometry. It is easy to detect the red colors of these objects in the NIR passbands. Their intrinsic colors are expected to be , and (Ducati et al., 2001).
3.1 Comparison with previous studies
We compare our results with the work of Persson et al. (1983) in this section. There are 52 objects in common between our study and their paper: 10 SMC and 42 LMC clusters, respectively. The data in that early work was gathered using three different photo tubes and an InSb detector system, mounted on three different telescopes: The 1-m Swope and 2.5-m du Pont telescopes of the Las Campanas Observatory and the 0.9-m CTIO telescope. The observations of Magellanic Cloud clusters were presented in , and filters of the California Institute of Technology infrared photometric system (CIT) (for details see Frogel et al., 1978).
There are several issues that complicate a direct comparison of the obtained results in the two works: (i) Due to the use of an iris diaphragm at the du Pont and CTIO telescopes at the time, the aperture diameters were only known to ″ (Persson et al., 1983). This could lead to uncertainties in the cluster magnitudes and colors. (ii) Another serious problem we became aware of during a series of experiments is related to the centering of the cluster. In many cases the diaphragm apertures used by Persson et al. appear to cover the brightest part of the cluster, because their strategy was to maximize the flux through the aperture. This however leaves this technique vulnerable to the effect of stochastic fluctuations of the observed stellar population, in particular for young clusters or clusters that are contaminated by bright stars. Extended clusters without a clear central peak are also difficult to center using this technique. (iii) The cross-calibration between the CIT and 2MASS photometric system was only based on three stars with (Carpenter, 2001). However, one might expect differences in calibration from CIT to 2MASS for late-type giants vs. supergiants or carbon stars (i.e., stars with ), since the latter two have stronger CO bandhead absorption features (which affects much more than it does ). As this may be relevant for intermediate-age star clusters whose near-IR colors are dominated by light from AGB stars, we tested the significance of this effect by using the synphot package within IRAF/STSDAS along with – and -band spectra of late-type giants, supergiants, and carbon stars taken by Lançon & Rocca-Volmerange (1992) and filter throughput curves taken from Cutri et al. (2003). As Fig. 11 shows, the offset between and for the different types of late-type stars only starts being significant redward of . Since the clusters in our sample all have (cf. Tables 5 and 6), we conclude that color term differences between supergiants and carbon stars do not significantly influence the integrated-light photometry of our clusters, and hence the cross-calibrations of Carpenter (2001) should be adequate for our purposes.
The CIT magnitude values as well as () and () colors from Persson et al. (1983) were thus converted into the 2MASS system by using the transformation equations derived by Carpenter (2001)666The most recent update of the transformations is available online at: http://www.astro.caltech.edu/ jmc/2mass/v3/transformations/. The comparison plots between magnitudes and the colors for the SMC clusters in common between our work and Persson et al. are presented in Figures 12–14. The mean offsets between the magnitude values from the two studies are () and () for SMC and LMC, respectively. For color we calculated mean offset () and () for the SMC and LMC. The mean offsets for the two galaxies are () and ().
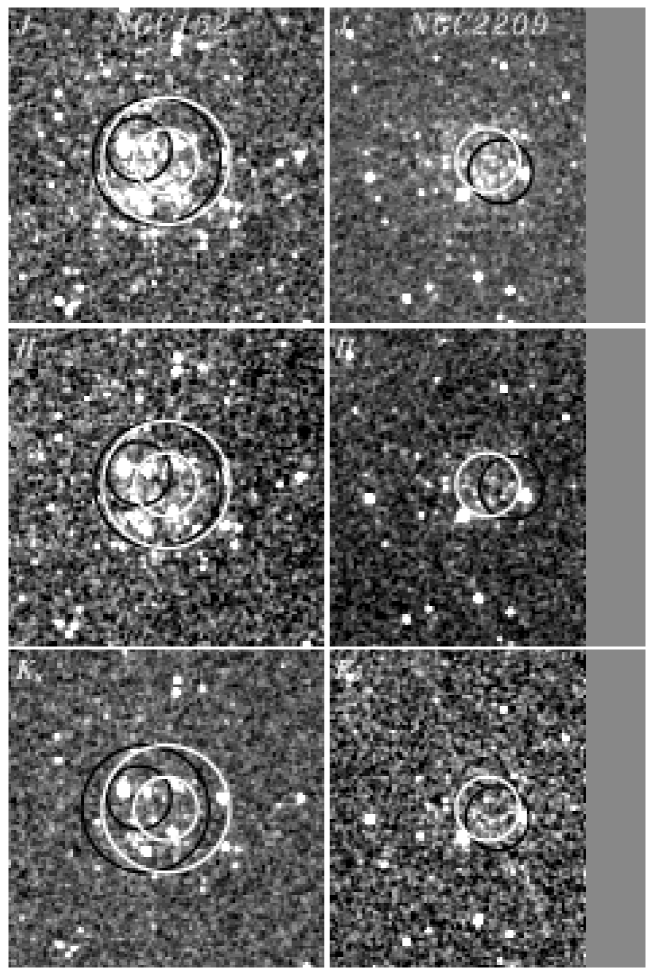
The largest differences appear in the case of NGC 152, situated in the SMC and NGC 2209 in the LMC. If we can explain the nature of these discrepancies it is plausible to assume that it is possible to explain the smaller offsets arising for the rest of the objects in the sample as well.
To investigate this in more detail we plot the , and frames of NGC 152 on the right side of Figure 15. The images are centered on the cluster position derived in this paper (as explained above). To simulate the measurements of Persson et al. (1983) who maximized the count rate received through their single-channel detector, we used an aperture of their size and let its center drift across a 40″ 40″ subimage located around the center position of our apertures. The step size was 1 pixel (or arcsec) and after the row or column was completed, the aperture center moved to the next one until the entire section was scanned. The measurement with the maximal flux value is assumed to be the center of that aperture in Persson et al. (1983). These simulations were done for each passband independently. The results are listed in Table 7 and Table 8. For illustration purposes, we plot the apertures used in our study and the reproduction of those used by Persson et al. together in Figure 15. NGC 152 is an intermediate-age SMC cluster, and there are several bright red stars which dominate the flux in the near-infrared. (Their presence was also noted by Persson et al.) The faintness of the cluster, the bright stars and the extended nature of the cluster render the centering extremely hard for single-channel photometry. The problem is most serious for the smaller aperture, but there is a better agreement for the bigger one. The results of the comparison are shown in Table 7.
NGC 2209 is the most extreme example of differences between our study and that of Persson et al. (1983), amounting to 2.5 magnitudes in the -band. The 2MASS images of this cluster are shown in the left three panels of Figure 15. The object is a faint cluster with an age of 1 Gyr. There are two bright stars dominating the flux, which are carbon stars identified as W46 and W50 by Walker (1971). Persson et al. note that they may affect the centering of their aperture and therefore likely the results of their photometry, which was performed with a single 30″ aperture. The offsets of the Persson’s aperture centers, reproduced by maximal flux experiments is between 10.5 and 17.5 pixels away from our position, depending on the passband used. The magnitude and color values listed in Table 2 of Persson et al. (1983) and the curves of growth from our work (presented in Figure 16) suggest that the flux of the carbon stars in NGC 2209 affects the total cluster magnitudes of Persson et al. To test our simulated position of Persson et al.’s aperture, we converted the magnitudes of Persson et al. (1983) to the 2MASS system and compared them with the corresponding values from our work after recentering our aperture on the simulated position used by Persson et al. The results are presented in Table 8. There is good agreement between magnitudes and colors, is a little off, but there still is good agreement at the 3 level. The most probable reason is a slight difference in the magnitude values. This is not surprising taking into account that the band magnitudes could be affected by rapid variations of the water vapor content in the atmosphere. In this particular case the differences between our results and the photometry of Persson et al. are mainly caused by centering problems. We are taking into account only the photometric uncertainty and the errors of the 2MASS zero points in the analysis above. Due to the presence of several relatively bright stars in the background field and the low signal from the cluster, the errors associated with the stochastic fluctuations in the stellar background are quite high. If we take them into account, there is much better agreement between the magnitudes and colors reproduced by our experiment and the values of Persson et al. (1983).
In general, we were able to achieve agreement between our results and those of Persson et al. by assuming a center location for their measurements which is significantly off the ‘true’ center of the cluster in question. The centering discrepancies are smaller for the larger apertures, but still large enough to alter the total magnitudes significantly.
Figure 12 is perhaps the best illustration of the effects mentioned above. The total magnitudes of the clusters in Persson et al. (1983) for the 30″ aperture compared to the data in the present paper are underestimated for 6 of 8 objects and the most probable explanation is centering of the aperture over the brightest part of the cluster population. There is an overestimate in the case of KRON 3, which is a little surprising taking into account the compact nature and the shape of the object. On the other hand a more careful inspection shows that if the aperture is placed on the geometrical center of KRON 3 it is not sampling the most luminous part of the stellar population. In general we have good agreement for the compact and bright clusters, residing in regions of relatively homogeneous foreground or Magellanic clouds stellar population (e.g. NGC419, NGC121), especially for the larger 60″ aperture. This is also the case for NGC 458, a faint cluster, measured by Persson et al. only in a single 30″ aperture. The values of and colors of the clusters for the smaller 30″ aperture are systematically higher in Persson et al.. The observed trend is also consistent with the expected results from the flux-maximization.
Kyeong et al. (2003) presented 2-dimensional NIR imaging of a smaller sample of 28 LMC clusters. Their observations were conducted in December 1996 with CASPIR (Cryogenic Array Spectrometer/Imager) instrument at the 2.3m telescope of the Siding Spring Observatory. The clusters were observed in the passbands of the SAAO NIR system. The flux from the background fields was subtracted from the flux measured in the photometry aperture. The authors took advantage from their imaging data to determine the centers of the objects by visual inspection and used them to measure the integrated magnitudes of the clusters in 11 concentric apertures. Unfortunately the center positions were never published, so it is impossible to provide a detailed comparison between our photometry and the values in the earlier work. We transformed the values of the , and total magnitudes for their largest apperture (D=100″) into 2MASS magnitudes for the 22 objects in common, using the work of Carpenter (2001). The comparison between the datasets showed mean offsets (by means of difference between our magnitudes and the values of Kyeong et al.) : , and in and respectively. An inspection of the observing log published in their Table 2 revealed notes about non-photometric conditions concerning clusters observed during two of the nights. This is a possible explanation for the larger differences between our photometry and the results of Kyeong et al. in and bands which are much more affected by rapid changes of the atmospheric transition and water vapor content.
3.2 Comparison with 2MASS Extended Source Catalogue
The Extended Source Catalogue (hereafter XSC) processor in the 2MASS pipeline was designed to provide a flux measurement of the diffuse light of extended sources such as distant galaxies. As described in Jarrett et al. (2000), the XSC processor masks out point sources and substitutes the flux in the masked pixels with the surface brightness of the underlying diffuse light. When applied to star clusters in the Magellanic Clouds, one can therefore expect the XSC processor to eliminate stars that are actually genuine members of the star clusters, some of which contribute significantly to the total flux. As shown in Fig. 17, we indeed find that the XSC magnitudes (which are given for 11 concentric circular apertures) are in very good agreement with our photometry of the unresolved component of the clusters. However, as the total magnitudes of the clusters are significantly brighter than this, we discourage use of the XSC catalog for partially resolved targets such as those considered here.
4 Summary and Conclusions
We present a highly uniform dataset of integrated , and magnitudes for 75 star clusters in the Magellanic Clouds, using 2MASS survey data. There are reliable age and metallicity estimates available in the literature for the vast majority of the objects in the sample. This is the first extensive NIR survey of the clusters in these galaxies since the single-channel photometry of Persson et al. (1983). Comparing the results of their photometry with the magnitudes from our infrared array curve-of-growth measurements, we find significant differences for some objects, which we can reproduce as being due to centering problems in the early Persson et al. study.
Keeping in mind that the Persson et al. (1983) results were used to calibrate some of the most recent SSP models (Bruzual & Charlot, 2003; Maraston, 2005), we suggest that the photometry derived in the present work be used to calibrate and improve the existing and future SSP models in the near-IR part of the spectrum. We intend to perform a detailed comparison with the predictions of a set of simple stellar population models in a forthcoming paper, utilizing new optical data from Goudfrooij et al. (2006).
Acknowledgments
The authors would like to thank to the anonymous referee for the helpful suggestions and comments that improved the paper. The authors are thankful to Dennis Zaritsky and his collaborators for the kind and quick response of the inquiry about the MCPS extinction estimation tool and providing access to their online utility. This publication makes use of data products from the Two Micron All-Sky Survey, which is a joint project of the University of Massachusetts and the Infrared Processing and Analysis Center/California Institute of Technology, funded by the National Aeronautics and Space Administration and the National Science Foundation. This research has made use of the NASA/IPAC Extragalactic Database (NED) which is operated by the Jet Propulsion Laboratory, California Institute of Technology, under contract with the National Aeronautics and Space Administration. Support for this work was provided in part by NASA through a Spitzer Space Telescope Program, through a contract issued by the Jet Propulsion Laboratory, California Institute of Technology under a contract with NASA. Support for this work was also provided in part by the STScI Director’s Discretionary Research Fund.
References
- Alcaino (1978) Alcaino, G. 1978, A&AS, 34, 431
- Alves & Sarajedini (1999) Alves, D. R., & Sarajedini, A. 1999, ApJ, 511, 225
- Alves (2004) Alves, D. R. 2004, New Astronomy Review, 48, 659
- Beasley et al. (2002) Beasley, M. A., Hoyle, F., & Sharples, R. M. 2002, MNRAS, 336, 168
- Bessell & Brett (1988) Bessell, M. S., & Brett, J. M. 1988, PASP, 100, 1134
- Bica et al. (1996) Bica, E., Claria, J. J., Dottori, H., Santos, J. F. C., & Piatti, A. E. 1996, ApJS, 102, 57
- Bica et al. (1998) Bica, E., Geisler, D., Dottori, H., Clariá, J. J., Piatti, A. E., & Santos, J. F. C. 1998, AJ, 116, 723
- Bruzual & Charlot (1993) Bruzual, A. G., & Charlot, S. 1993, ApJ, 405, 538
- Bruzual et al. (1997) Bruzual, G., Barbuy, B., Ortolani, S., Bica, E., Cuisinier, F., Lejeune, T., & Schiavon, R. P. 1997, AJ, 114, 1531
- Bruzual & Charlot (2003) Bruzual, G., & Charlot, S. 2003, MNRAS, 344, 1000
- Burstein & Heiles (1982) Burstein, D., & Heiles, C. 1982, AJ, 87, 1165
- Carpenter (2001) Carpenter, J. M. 2001, AJ, 121, 2851
- Casali & Hawarden (1992) Casali, M. M. & Hawarden, T. G. 1992, JCMT-UKIRT Newsletter, No. 4, 33
- Chiosi et al. (1995) Chiosi, C., Vallenari, A., Bressan, A., Deng, L., & Ortolani, S. 1995, A&A, 293, 710
- Crowl et al. (2001) Crowl, H. H., Sarajedini, A., Piatti, A. E., Geisler, D., Bica, E., Clariá, J. J., & Santos, J. F. C. 2001, AJ, 122, 220
- Cutri et al. (2003) Cutri, R. M., et al. 2003, VizieR Online Data Catalog, 2246
- Da Costa & Hatzidimitriou (1998) Da Costa, G. S., & Hatzidimitriou, D. 1998, AJ, 115, 1934
- de Grijs et al. (2002) de Grijs, R., Gilmore, G. F., Johnson, R. A., & Mackey, A. D. 2002, MNRAS, 331, 245
- Dirsch et al. (2000) Dirsch, B., Richtler, T., Gieren, W. P., & Hilker, M. 2000, A&A, 360, 133
- Ducati et al. (2001) Ducati, J. R., Bevilacqua, C. M., Rembold, S. B., & Ribeiro, D. 2001, ApJ, 558, 309
- Elson & Fall (1988) Elson, R. A., & Fall, S. M. 1988, AJ, 96, 1383
- Elson (1991) Elson, R. A. W. 1991, ApJS, 76, 185
- Frogel et al. (1978) Frogel, J. A., Persson, S. E., Matthews, K., & Aaronson, M. 1978, ApJ, 220, 75
- Frogel et al. (1990) Frogel, J. A., Mould, J., & Blanco, V. M. 1990, ApJ, 352, 96
- Geisler et al. (1997a) Geisler, D., Bica, E., Dottori, H., Piatti, A. E., & Claria, J. J. 1997, Bulletin of the American Astronomical Society, 29, 841
- Geisler et al. (1997b) Geisler, D., Bica, E., Dottori, H., Claria, J. J., Piatti, A. E., & Santos, J. F. C. 1997, AJ, 114, 1920
- Goudfrooij et al. (2001) Goudfrooij, P., Alonso, M. V., Maraston, C., & Minniti, D. 2001, MNRAS, 328, 237
- Goudfrooij et al. (2006) Goudfrooij, P., Gilmore, D., Kissler-Patig, M., & Maraston, C., 2006, MNRAS, in press
- Harries et al. (2003) Harries, T. J., Hilditch, R. W., & Howarth, I. D. 2003, MNRAS, 339, 157
- Hempel & Kissler-Patig (2004) Hempel, M., & Kissler-Patig, M. 2004, A&A, 419, 863
- Hill (1999) Hill, V. 1999, A&A, 345, 430
- Hill et al. (2000) Hill, V., François, P., Spite, M., Primas, F., & Spite, F. 2000, A&A, 364, L19
- Hill & Zaritsky (2005) Hill, A. & Zaritsky, D. 2005, in prep
- Hodge & Flower (1987) Hodge, P., & Flower, P. 1987, PASP, 99, 734
- Hunter et al. (1995) Hunter, D. A., Shaya, E. J., Holtzman, J. A., Light, R. M., O’Neil, E. J., & Lynds, R. 1995, ApJ, 448, 179
- Jarrett et al. (2000) Jarrett, T. H., Chester, T., Cutri, R., Schneider, S., Skrutskie, M., & Huchra, J. P. 2000, AJ, 119, 2498
- Jasniewicz & Thevenin (1994) Jasniewicz, G., & Thevenin, F. 1994, A&A, 282, 717
- Johnson et al. (2001) Johnson, R. A., Beaulieu, S. F., Gilmore, G. F., Hurley, J., Santiago, B. X., Tanvir, N. R., & Elson, R. A. W. 2001, MNRAS, 324, 367
- Kontizas et al. (1990) Kontizas, M., Morgan, D. H., Hatzidimitriou, D., & Kontizas, E. 1990, A&AS, 84, 527
- Kontizas et al. (2001) Kontizas, E., Dapergolas, A., Morgan, D. H., & Kontizas, M. 2001, A&A, 369, 932
- Kyeong et al. (2003) Kyeong, J.-M., Tseng, M.-J., & Byun, Y.-I. 2003, A&A, 409, 479
- Lançon & Rocca-Volmerange (1992) Lançon, A., & Rocca-Volmerange, B., 1992, A&AS, 96, 593
- Mackey & Gilmore (2003a) Mackey, A. D., & Gilmore, G. F. 2003, MNRAS, 338, 85
- Mackey & Gilmore (2003b) Mackey, A. D., & Gilmore, G. F. 2003, MNRAS, 338, 120
- Maraston (1998) Maraston, C. 1998, MNRAS, 300, 872
- Maraston et al. (2001) Maraston, C., Kissler-Patig, M., Brodie, J. P., Barmby, P., & Huchra, J. P. 2001, A&A, 370, 176
- Maraston (2005) Maraston, C. 2005, MNRAS, 362, 799
- Maraston et al. (2003) Maraston, C., Greggio, L., Renzini, A., Ortolani, S., Saglia, R. P., Puzia, T. H., & Kissler-Patig, M. 2003, A&A, 400, 823
- Mighell et al. (1998) Mighell, K. J., Sarajedini, A., & French, R. S. 1998, ApJ, 494, L189
- Nikolaev et al. (2000) Nikolaev, S., Weinberg, M. D., Skrutskie, M. F., Cutri, R M., Wheelock, S. L., Gizis, J. E.; Howard, E. M. 2000, AJ, 120, 3340
- Oliva & Origlia (1998) Oliva, E., & Origlia, L. 1998, A&A, 332, 46
- Olsen et al. (1998) Olsen, K. A. G., Hodge, P. W., Mateo, M., Olszewski, E. W., Schommer, R. A., Suntzeff, N. B., & Walker, A. R. 1998, MNRAS, 300, 665
- Olszewski et al. (1991) Olszewski, E. W., Schommer, R. A., Suntzeff, N. B., & Harris, H. C. 1991, AJ, 101, 515
- Persson et al. (1983) Persson, S. E., Aaronson, M., Cohen, J. G., Frogel, J. A., & Matthews, K. 1983, ApJ, 266, 105
- Persson et al. (1998) Persson, S. E., Murphy, D. C., Krzeminski, W., Roth, M., & Rieke, M. J. 1998, AJ, 116, 2475
- Puzia et al. (2002) Puzia, T. H., Zepf, S. E., Kissler-Patig, M., Hilker, M., Minniti, D., & Goudfrooij, P. 2002, A&A, 391, 453
- Seggewiss & Richtler (1989) Seggewiss, W., & Richtler, T. 1989, Recent Developments of Magellanic Cloud Research. A European Colloquium, held in Paris, France, May 9-11, 1989. Editors, K.S. de Boer, F. Spite, G. Stasinska; Publisher, Observatoire de Paris, Section Astrophysique de Meudon, Meudon, France, 1989. LC # QB858.5.M33 R42 1989. ISBN # NONE. P. 45, 1989, 45
- Rich et al. (2001) Rich, R. M., Shara, M. M., & Zurek, D. 2001, AJ, 122, 842
- Schlegel et al. (1998) Schlegel, D. J., Finkbeiner, D. P., & Davis, M. 1998, ApJ, 500, 525
- Sirianni et al. (2000) Sirianni, M., Nota, A., Leitherer, C., De Marchi, G., & Clampin, M. 2000, ApJ, 533, 203
- Skrutskie et al. (1997) Skrutskie, M. F., et al. 1997, ASSL Vol. 210: The Impact of Large Scale Near-IR Sky Surveys, 25
- Stetson (1987) Stetson, P. B. 1987, PASP, 99, 191
- Suntzeff et al. (1992) Suntzeff, N. B., Schommer, R. A., Olszewski, E. W., & Walker, A. R. 1992, AJ, 104, 1743
- Vazdekis (1999) Vazdekis, A. 1999, ApJ, 513, 224
- van den Bergh (1981) van den Bergh, S. 1981, A&AS, 46, 79
- Walker (1971) Walker, M. F. 1971, ApJ, 167, 1
- Worthey (1994) Worthey, G. 1994, ApJS, 95, 107
- Zaritsky et al. (1997) Zaritsky, D., Harris, J., & Thompson, I. 1997, AJ, 114, 1002
- Zaritsky (1999) Zaritsky, D. 1999, AJ, 118, 2824
- Zaritsky et al. (2002) Zaritsky, D., Harris, J., Thompson, I. B., Grebel, E. K., & Massey, P. 2002, AJ, 123, 855
- Zaritsky et al. (2004) Zaritsky, D., Harris, J., Thompson, I. B., & Grebel, E. K. 2004, AJ, 128, 1606
| ID | aaPositions (hh:mm:ss), (dd:mm:ss) are retrieved from Simbad Astronomical Database | aaPositions (hh:mm:ss), (dd:mm:ss) are retrieved from Simbad Astronomical Database | Age, Errors & RefbbThe age for the clusters is given as log(age). The CMDs of the last three objects are providing only a crude age estimation, and the errors are not given. | [Fe/H], Err & Ref | ccThe extinction information is retrieved from the website of the MCPS | errccThe extinction information is retrieved from the website of the MCPS | |||||
|---|---|---|---|---|---|---|---|---|---|---|---|
| NGC121 | 00:26:49 | –71:32:10 | 10.08 | +0.05 | –0.05 | 7 | –1.71 | 0.10 | 7 | 0.18 | 0.02 |
| NGC152 | 00:32:56 | –73:06:59 | 9.15 | +0.06 | –0.07 | 3 | –0.94 | 0.15 | 3 | 0.19 | 0.02 |
| NGC176 | 00:35:59 | –73:09:57 | 8.30 | +0.30 | –0.30 | 6;8 | –0.6 | 8 | 0.24 | 0.03 | |
| NGC330 | 00:56:20 | –72:27:44 | 7.40 | +0.20 | –0.40 | 2;4 | –0.82 | 0.11 | 5 | 0.37 | 0.02 |
| NGC339 | 00:57:45 | –74:28:21 | 9.80 | +0.08 | –0.10 | 7 | –1.50 | 0.14 | 7 | 0.18 | 0.02 |
| NGC361 | 01:02:11 | –71:36:25 | 9.91 | +0.06 | –0.07 | 7 | –1.45 | 0.11 | 7 | 0.17 | 0.02 |
| NGC411 | 01:07:56 | –71:46:09 | 9.15 | +0.06 | –0.07 | 1;3 | –0.68 | 0.07 | 1;3 | 0.17 | 0.02 |
| NGC416 | 01:07:58 | –72:21:25 | 9.84 | +0.06 | –0.08 | 7 | –1.44 | 0.12 | 7 | 0.20 | 0.02 |
| NGC458 | 01:14:54 | –71:32:58 | 8.30 | +0.18 | –0.30 | 4 | –0.23 | 0.25 | 4 | 0.23 | 0.02 |
| KRON3 | 00:24:46 | –72:47:37 | 9.78 | +0.09 | –0.11 | 7 | –1.16 | 0.09 | 7 | 0.18 | 0.02 |
| NGC419 | 01:08:19 | –72:53:03 | 9.08 | 9 | –0.6 | 9 | 0.32 | 0.02 | |||
| Lindsay1 | 00:04:00 | –73:28:00 | 9.89 | 7 | –1.35 | 7 | 0.18 | 0.02 | |||
| Lindsay113 | 01:49:30 | –73:43:00 | 9.60 | 7 | –1.24 | 7 | 0.18 | 0.02 | |||
| ID | aafootnotemark: | aafootnotemark: | Age, Errors & Refbbfootnotemark: | [Fe/H], Err & Ref | ccfootnotemark: | errccfootnotemark: | |||||
|---|---|---|---|---|---|---|---|---|---|---|---|
| NGC1466 | 03:44:33 | –71:40:18 | 10.10 | +0.01 | –0.01 | 5 | –2.17 | 0.20 | 12 | 0.39 | 0.02 |
| NGC1651 | 04:37:32 | –70:35:06 | 9.30 | +0.08 | –0.10 | 5 | –0.37 | 0.20 | 12 | 0.35 | 0.05 |
| NGC1711 | 04:50:37 | –69:59:06 | 7.70 | +0.05 | –0.05 | 2 | –0.57 | 0.17 | 2 | 0.56 | 0.01 |
| NGC1718 | 04:52:25 | –67:03:06 | 9.30 | +0.30 | –0.30 | 4 | –0.42 | 20 | 0.51 | 0.06 | |
| NGC1754 | 04:54:17 | –70:26:30 | 10.19 | +0.06 | –0.07 | 11 | –1.54 | 0.20 | 12 | 0.40 | 0.04 |
| NGC1777 | 04:55:48 | –74:17:00 | 9.08 | +0.12 | –0.18 | 5 | –0.35 | 0.20 | 12 | 0.39 | 0.02 |
| NGC1786 | 04:59:06 | –67:44:42 | 10.18 | +0.01 | –0.01 | 5 | –1.87 | 0.20 | 12 | 0.62 | 0.04 |
| NGC1805 | 05:02:21 | –66:06:42 | 7.00 | +0.30 | –0.10 | 1 | –0.25 | 1;9 | 0.32 | 0.02 | |
| NGC1818 | 05:04:14 | –66:26:06 | 7.40 | +0.30 | –0.10 | 1 | –0.25 | 1;9 | 0.39 | 0.02 | |
| NGC1831 | 05:06:16 | –64:55:06 | 8.50 | +0.30 | –0.30 | 4 | +0.01 | 0.20 | 12 | 0.39 | 0.02 |
| NGC1835 | 05:05:05 | –69:24:12 | 10.22 | +0.07 | –0.08 | 11 | –1.79 | 0.20 | 12 | 0.35 | 0.07 |
| NGC1841 | 04:45:23 | –83:59:48 | 10.09 | +0.01 | –0.01 | 5 | –2.11 | 0.10 | 15 | 0.39 | 0.02 |
| NGC1847 | 05:07:08 | –68:58:18 | 7.42 | +0.30 | –0.30 | 4 | –0.37 | 20 | 0.49 | 0.02 | |
| NGC1850 | 05:08:44 | –68:45:36 | 7.50 | +0.20 | –0.20 | 3 | –0.12 | 0.20 | 8 | 0.33 | 0.01 |
| NGC1856 | 05:09:29 | –69:07:36 | 8.12 | +0.30 | –0.30 | 4 | –0.52 | 20 | 0.22 | 0.03 | |
| NGC1860 | 05:10:39 | –68:45:12 | 8.28 | +0.30 | –0.30 | 4 | –0.52 | 20 | 0.27 | 0.07 | |
| NGC1866 | 05:13:39 | –65:27:54 | 8.12 | +0.30 | –0.30 | 4 | –0.50 | 0.10 | 6 | 0.28 | 0.06 |
| NGC1868 | 05:14:36 | –63:57:18 | 8.74 | +0.30 | –0.30 | 4 | –0.50 | 0.20 | 12 | 0.39 | 0.02 |
| NGC1898 | 05:16:42 | –69:39:24 | 10.15 | +0.06 | –0.08 | 11 | –1.37 | 0.20 | 12 | 0.43 | 0.05 |
| NGC1916 | 05:18:39 | –69:24:24 | 10.20 | +0.09 | –0.09 | 20 | –2.08 | 0.20 | 12 | 0.42 | 0.05 |
| NGC1984 | 05:27:40 | –69:08:06 | 7.06 | +0.30 | –0.30 | 4 | –0.90 | 0.40 | 10 | 0.36 | 0.02 |
| NGC2004 | 05:30:40 | –67:17:12 | 7.30 | +0.20 | –0.20 | 3 | –0.56 | 0.20 | 8 | 0.33 | 0.02 |
| NGC2005 | 05:30:09 | –69:45:06 | 10.22 | +0.12 | –0.16 | 11 | –1.92 | 0.20 | 12 | 0.47 | 0.04 |
| NGC2011 | 05:32:19 | –67:31:18 | 6.99 | +0.30 | –0.30 | 4 | –0.47 | 0.40 | 10 | 0.47 | 0.02 |
| NGC2019 | 05:31:56 | –70:09:36 | 10.25 | +0.07 | –0.09 | 11 | –1.81 | 0.20 | 12 | 0.44 | 0.06 |
| NGC2031 | 05:33:41 | –70:59:12 | 8.20 | +0.10 | –0.10 | 2 | –0.52 | 0.21 | 2 | 0.40 | 0.03 |
| NGC2100 | 05:42:08 | –69:12:42 | 7.20 | +0.20 | –0.20 | 3 | –0.32 | 0.20 | 8 | 0.80 | 0.02 |
| NGC2121 | 05:48:12 | –71:28:48 | 9.51 | +0.06 | –0.07 | 13 | –0.61 | 0.20 | 12 | 0.53 | 0.04 |
| NGC2136 | 05:53:17 | –69:31:42 | 8.00 | +0.10 | –0.10 | 2 | –0.55 | 0.23 | 2 | 0.58 | 0.02 |
| NGC2153 | 05:57:51 | –66:24:00 | 9.11 | +0.12 | –0.16 | 5 | –0.42 | 20 | 0.27 | 0.05 | |
| NGC2155 | 05:58:33 | –65:28:36 | 9.51 | +0.06 | –0.07 | 13 | –0.55 | 0.20 | 12 | 0.43 | 0.04 |
| NGC2156 | 05:57:45 | –68:27:36 | 7.60 | +0.20 | –0.20 | 3 | –0.45 | 20 | 0.20 | 0.02 | |
| NGC2157 | 05:57:34 | –69:11:48 | 7.60 | +0.20 | –0.20 | 3 | –0.45 | 20 | 0.42 | 0.02 | |
| NGC2159 | 05:57:57 | –68:37:24 | 7.60 | +0.20 | –0.20 | 3 | –0.45 | 20 | 0.29 | 0.03 | |
| NGC2162 | 06:00:31 | –63:43:18 | 9.11 | +0.12 | –0.16 | 5 | –0.23 | 0.20 | 12 | 0.39 | 0.02 |
| NGC2164 | 05:58:54 | –68:31:06 | 7.70 | +0.20 | –0.20 | 3 | –0.45 | 20 | 0.33 | 0.02 | |
| NGC2172 | 06:00:05 | –68:38:12 | 7.60 | +0.20 | –0.20 | 3 | –0.44 | 20 | 0.26 | 0.03 | |
| NGC2173 | 05:57:58 | –72:58:42 | 9.33 | +0.07 | –0.09 | 5 | –0.24 | 0.20 | 12 | 0.39 | 0.02 |
| NGC2193 | 06:06:17 | –65:05:54 | 9.34 | +0.09 | –0.11 | 13 | –0.60 | 0.20 | 13 | 0.39 | 0.02 |
| NGC2209 | 06:08:34 | –73:50:30 | 8.98 | +0.15 | –0.24 | 5 | –0.47 | 20 | 0.39 | 0.02 | |
| NGC2210 | 06:11:31 | –69:07:18 | 10.20 | +0.01 | –0.01 | 5 | –1.97 | 0.20 | 12 | 0.39 | 0.02 |
| NGC2213 | 06:10:42 | –71:31:42 | 9.20 | +0.10 | –0.12 | 5 | –0.01 | 0.20 | 12 | 0.40 | 0.04 |
| NGC2214 | 06:12:57 | –68:15:36 | 7.60 | +0.20 | –0.20 | 3 | –0.45 | 20 | 0.39 | 0.02 | |
| NGC2231 | 06:20:44 | –67:31:06 | 9.18 | +0.10 | –0.13 | 5 | –0.67 | 0.20 | 12 | 0.39 | 0.02 |
| NGC2249 | 06:25:49 | –68:55:12 | 8.82 | +0.30 | –0.30 | 4 | –0.47 | 20 | 0.39 | 0.02 | |
| NGC2257 | 06:30:12 | –64:19:36 | 10.20 | +0.10 | –0.10 | 2 | –1.63 | 0.21 | 2 | 0.39 | 0.02 |
| SL663 | 05:42:29 | –65:21:48 | 9.51 | +0.06 | –0.07 | 13 | –0.60 | 0.20 | 13 | 0.38 | 0.04 |
| SL842 | 06:08:15 | –62:59:18 | 9.30 | +0.08 | –0.10 | 5 | –0.36 | 0.20 | 12 | 0.39 | 0.02 |
| SL855 | 06:10:53 | –65:02:36 | 9.13 | +0.30 | –0.30 | 4 | –0.42 | 20 | 0.39 | 0.02 | |
| HODGE4 | 05:31:54 | –64:42:00 | 9.34 | +0.09 | –0.11 | 13 | –0.15 | 0.20 | 12 | 0.39 | 0.02 |
| HODGE11 | 06:14:22 | –69:50:54 | 10.18 | +0.01 | –0.01 | 5 | –2.06 | 0.20 | 12 | 0.39 | 0.02 |
| HODGE14 | 05:28:39 | –73:37:48 | 9.26 | +0.09 | –0.11 | 5 | –0.66 | 0.20 | 12 | 0.39 | 0.02 |
| R136 | 05:38:43 | –69:06:03 | 6.48 | +0.12 | –0.18 | 14 | –0.40 | 7;14 | 0.39 | 0.02 | |
| ESO121-003 | 06:03:24 | –60:31:00 | 9.95 | 12;16 | –0.93 | 12;16 | 0.39 | 0.02 | |||
| LW431 | 06:13:27 | –70:41:43 | 9.26 | 17 | –0.85 | 17 | 0.39 | 0.02 | |||
| NGC1751 | 04:54:12 | –69:48.24 | 9.18 | 19 | –0.18 | 19 | 0.65 | 0.06 | |||
| NGC1783 | 04:59:08 | –65:59:20 | 9.11 | 18 | 18 | 0.30 | 0.03 | ||||
| NGC1806 | 05:02:11 | –67:59:20 | 8.70 | 19 | –0.71 | 19 | 0.25 | 0.04 | |||
| NGC1846 | 05:07:35 | –67:27:39 | 9.46 | 19 | –0.70 | 19 | 0.41 | 0.04 | |||
| NGC1939 | 05:21:27 | –69:56:59 | 10.04 | 19 | –2.00 | 19 | 0.62 | 0.05 | |||
| NGC1978 | 05:28:45 | –66:14:12 | 9.32 | 18 | –0.42 | 18 | 0.76 | 0.05 | |||
| NGC1987 | 05:27:17 | –70:44:06 | 9.40 | 19 | –0.50 | 19 | 0.28 | 0.03 | |||
| NGC2190 | 06:01:02 | –74:43:30 | 9.04 | 19 | –0.12 | 19 | 0.39 | 0.02 | |||
| NGC2203 | 06:04:42 | –75:26:20 | 9.26 | 18 | –0.52 | 18 | 0.39 | 0.02 | |||
References. — 1. de Grijs et al. (2002) 2. Dirsch et al. (2000) 3. Elson (1991) 4. Elson & Fall (1988) 5. Geisler et al. (1997a) 6. Hill et al. (2000) 7. Hunter et al. (1995) 8. Jasniewicz & Thevenin (1994) 9. Johnson et al. (2001) 10. Oliva & Origlia (1998) 11. Olsen et al. (1998) 12. Olszewski et al. (1991) 13. Rich et al. (2001) 14. Sirianni et al. (2000) 15. Suntzeff et al. (1992) 16. Seggewiss & Richtler (1989) 17. Bica et al. (1998) 18. Geisler et al. (1997b) 19. Beasley et al. (2002) 20.Mackey & Gilmore (2003a)
| Cluster ID | N | |||
|---|---|---|---|---|
| NGC121 | 3 | s4_aJ_asky_981020s0400256.fits | s5_aH_asky_981020s0400256.fits | s6_aK_asky_981020s0400256.fits |
| NGC152 | 3 | s7_aJ_asky_980808s0580221.fits | s8_aH_asky_980808s0580221.fits | s9_aK_asky_980808s0580221.fits |
| NGC330 | 2 | s4_aJ_asky_980809s0930245.fits | s5_aH_asky_980809s0930245.fits | s6_aK_asky_980809s0930245.fits |
| NGC339 | 3 | s7_aJ_asky_980809s0940115.fits | s8_aH_asky_980809s0940115.fits | s9_aK_asky_980809s0940115.fits |
| NGC361 | 2 | s4_aJ_asky_981021s0450256.fits | s5_aH_asky_981021s0450256.fits | s6_aK_asky_981021s0450256.fits |
| NGC411 | 3 | s7_aJ_asky_981021s0560009.fits | s8_aH_asky_981021s0560009.fits | s9_aK_asky_981021s0560009.fits |
| NGC416 | 1 | s1_aJ_asky_980809s1060021.fits | s2_aH_asky_980809s1060021.fits | s3_aK_asky_980809s1060021.fits |
| NGC419 | 3 | s1_aJ_asky_980809s1060044.fits | s2_aH_asky_980809s1060044.fits | s3_aK_asky_980809s1060044.fits |
| NGC458 | 2 | s4_aJ_asky_981021s0680021.fits | s5_aH_asky_981021s0680021.fits | s6_aK_asky_981021s0680021.fits |
| KRON3 | 2 | s4_aJ_asky_980808s0470044.fits | s5_aH_asky_980808s0470044.fits | s6_aK_asky_980808s0470044.fits |
| LINDSAY1 | 3 | s1_aJ_asky_980808s0210068.fits | s2_aH_asky_980808s0210068.fits | s3_aK_asky_980808s0210068.fits |
| s4_aJ_asky_980808s0210080.fits | s5_aH_asky_980808s0210080.fits | s6_aK_asky_980808s0210080.fits | ||
| LINDSAY113 | 4 | s7_aJ_asky_981008s0590186.fits | s8_aH_asky_981008s0590186.fits | s9_aK_asky_981008s0590186.fits |
| Cluster ID | N | |||
|---|---|---|---|---|
| NGC1466 | 2 | s1_aJ_asky_981027s0940021.fits | s2_aH_asky_981027s0940021.fits | s3_aK_asky_981027s0940021.fits |
| NGC1651 | 2 | s1_aJ_asky_991026s1140068.fits | s2_aH_asky_991026s1140068.fits | s3_aK_asky_991026s1140068.fits |
| NGC1711 | 2 | s1_aJ_asky_980401s0140186.fits | s2_aH_asky_980401s0140186.fits | s3_aK_asky_980401s0140186.fits |
| NGC1718 | 1 | s1_aJ_asky_981025s0810056.fits | s2_aH_asky_981025s0810056.fits | s3_aK_asky_981025s0810056.fits |
| NGC1754 | 3 | s1_aJ_asky_981025s0820068.fits | s2_aH_asky_981025s0820068.fits | s3_aK_asky_981025s0820068.fits |
| NGC1777 | 3 | s1_aJ_asky_981202s0710162.fits | s2_aH_asky_981202s0710162.fits | s3_aK_asky_981202s0710162.fits |
| NGC1786 | 3 | s1_aJ_asky_981025s0860186.fits | s2_aH_asky_981025s0860186.fits | s3_aK_asky_981025s0860186.fits |
| NGC1805 | 2 | s1_aJ_asky_981025s0950009.fits | s2_aH_asky_981025s0950009.fits | s3_aK_asky_981025s0950009.fits |
| NGC1818 | 2 | s4_aJ_asky_981025s0970033.fits | s5_aH_asky_981025s0970033.fits | s6_aK_asky_981025s0970033.fits |
| NGC1831 | 3 | s1_aJ_asky_990129s0150221.fits | s2_aH_asky_990129s0150221.fits | s3_aK_asky_990129s0150221.fits |
| NGC1835 | 2 | s4_aJ_asky_981025s0980115.fits | s5_aH_asky_981025s0980115.fits | s6_aK_asky_981025s0980115.fits |
| NGC1841 | 5 | s4_aJ_asky_000221s0250009.fits | s5_aH_asky_000221s0250009.fits | s6_aK_asky_000221s0250009.fits |
| NGC1847 | 2 | s4_aJ_asky_981026s0820139.fits | s5_aH_asky_981026s0820139.fits | s6_aK_asky_981026s0820139.fits |
| NGC1850 | 3 | s7_aJ_asky_981026s0830127.fits | s8_aH_asky_981026s0830127.fits | s9_aK_asky_981026s0830127.fits |
| NGC1856 | 2 | s1_aJ_asky_981026s0830150.fits | s2_aH_asky_981026s0830150.fits | s3_aK_asky_981026s0830150.fits |
| NGC1860 | 3 | s1_aJ_asky_981026s0840139.fits | s2_aH_asky_981026s0840139.fits | s3_aK_asky_981026s0840139.fits |
| NGC1866 | 1 | s1_aJ_asky_981210s0290245.fits | s2_aH_asky_981210s0290245.fits | s3_aK_asky_981210s0290245.fits |
| NGC1868 | 1 | s1_aJ_asky_000218s0270092.fits | s2_aH_asky_000218s0270092.fits | s3_aK_asky_000218s0270092.fits |
| NGC1898 | 3 | s4_aJ_asky_981220s0810174.fits | s5_aH_asky_981220s0810174.fits | s6_aK_asky_981220s0810174.fits |
| NGC1916 | 2 | s4_aJ_asky_981220s0830162.fits | s5_aH_asky_981220s0830162.fits | s6_aK_asky_981220s0830162.fits |
| NGC1984 | 2 | s1_aJ_asky_000209s0340150.fits | s2_aH_asky_000209s0340150.fits | s3_aK_asky_000209s0340150.fits |
| NGC2004 | 1 | s1_aJ_asky_000228s0210068.fits | s2_aH_asky_000228s0210068.fits | s3_aK_asky_000228s0210068.fits |
| NGC2005 | 2 | s1_aJ_asky_000228s0210174.fits | s2_aH_asky_000228s0210174.fits | s3_aK_asky_000228s0210174.fits |
| NGC2011 | 2 | s4_aJ_asky_000327s0270198.fits | s5_aH_asky_000327s0270198.fits | s6_aK_asky_000327s0270198.fits |
| NGC2019 | 1 | s1_aJ_asky_000327s0270080.fits | s2_aH_asky_000327s0270080.fits | s3_aK_asky_000327s0270080.fits |
| NGC2031 | 3 | s1_aJ_asky_000206s0210044.fits | s2_aH_asky_000206s0210044.fits | s3_aK_asky_000206s0210044.fits |
| NGC2100 | 2 | s4_aJ_asky_980321s0070127.fits | s5_aH_asky_980321s0070127.fits | s6_aK_asky_980321s0070127.fits |
| NGC2121 | 3 | s7_aJ_asky_980321s0120245.fits | s8_aH_asky_980321s0120245.fits | s9_aK_asky_980321s0120245.fits |
| NGC2136 | 2 | s4_aJ_asky_981025s1070162.fits | s5_aH_asky_981025s1070162.fits | s6_aK_asky_981025s1070162.fits |
| NGC2153 | 3 | s7_aJ_asky_981025s1110033.fits | s8_aH_asky_981025s1110033.fits | s9_aK_asky_981025s1110033.fits |
| NGC2155 | 3 | s1_aJ_asky_981212s0540245.fits | s2_aH_asky_981212s0540245.fits | s3_aK_asky_981212s0540245.fits |
| NGC2156 | 2 | s4_aJ_asky_981025s1110115.fits | s5_aH_asky_981025s1110115.fits | s6_aK_asky_981025s1110115.fits |
| NGC2157 | 2 | s1_aJ_asky_981025s1110150.fits | s2_aH_asky_981025s1110150.fits | s3_aK_asky_981025s1110150.fits |
| NGC2159 | 1 | s1_aJ_asky_981025s1110127.fits | s2_aH_asky_981025s1110127.fits | s3_aK_asky_981025s1110127.fits |
| NGC2162 | 2 | s1_aJ_asky_981212s0560174.fits | s2_aH_asky_981212s0560174.fits | s3_aK_asky_981212s0560174.fits |
| NGC2164 | 3 | s4_aJ_asky_981025s1120150.fits | s5_aH_asky_981025s1120150.fits | s6_aK_asky_981025s1120150.fits |
| NGC2172 | 2 | s4_aJ_asky_981026s1010127.fits | s5_aH_asky_981026s1010127.fits | s6_aK_asky_981026s1010127.fits |
| NGC2173 | 2 | s4_aJ_asky_981204s0690056.fits | s5_aH_asky_981204s0690056.fits | s6_aK_asky_981204s0690056.fits |
| NGC2193 | 2 | s1_aJ_asky_981212s0680233.fits | s2_aH_asky_981212s0680233.fits | s3_aK_asky_981212s0680233.fits |
| NGC2209 | 2 | s4_aJ_asky_981204s0820186.fits | s5_aH_asky_981204s0820186.fits | s6_aK_asky_981204s0820186.fits |
| NGC2210 | 2 | s1_aJ_asky_981026s1220127.fits | s2_aH_asky_981026s1220127.fits | s3_aK_asky_981026s1220127.fits |
| NGC2213 | 3 | s7_aJ_asky_981026s1220021.fits | s8_aH_asky_981026s1220021.fits | s9_aK_asky_981026s1220021.fits |
| NGC2214 | 3 | s1_aJ_asky_981026s1230103.fits | s2_aH_asky_981026s1230103.fits | s3_aK_asky_981026s1230103.fits |
| NGC2231 | 1 | s1_aJ_asky_981208s0760080.fits | s2_aH_asky_981208s0760080.fits | s3_aK_asky_981208s0760080.fits |
| NGC2249 | 2 | s1_aJ_asky_981208s0800139.fits | s2_aH_asky_981208s0800139.fits | s3_aK_asky_981208s0800139.fits |
| NGC2257 | 2 | s4_aJ_asky_981212s1110080.fits | s5_aH_asky_981212s1110080.fits | s6_aK_asky_981212s1110080.fits |
| SL663 | 2 | s1_aJ_asky_981210s0820033.fits | s2_aH_asky_981210s0820033.fits | s3_aK_asky_981210s0820033.fits |
| SL842 | 2 | s1_aJ_asky_981212s0700139.fits | s2_aH_asky_981212s0700139.fits | s3_aK_asky_981212s0700139.fits |
| SL855 | 1 | s1_aJ_asky_981212s0730044.fits | s2_aH_asky_981212s0730044.fits | s3_aK_asky_981212s0730044.fits |
| HODGE4 | 3 | s7_aJ_asky_981210s0600056.fits | s8_aH_asky_981210s0600056.fits | s9_aK_asky_981210s0600056.fits |
| HODGE11 | 3 | s7_aJ_asky_981026s1240174.fits | s8_aH_asky_981026s1240174.fits | s9_aK_asky_981026s1240174.fits |
| HODGE14 | 2 | s4_aJ_asky_981202s1100080.fits | s5_aH_asky_981202s1100080.fits | s6_aK_asky_981202s1100080.fits |
| ESO121-003 | 1 | s1_aJ_asky_981212s0580033.fits | s2_aH_asky_981212s0580033.fits | s3_aK_asky_981212s0580033.fits |
| LW431 | 3 | s7_aJ_asky_981026s1240056.fits | s8_aH_asky_981026s1240056.fits | s9_aK_asky_981026s1240056.fits |
| NGC1751 | 2 | s1_aJ_asky_981025s0820103.fits | s2_aH_asky_981025s0820103.fits | s3_aK_asky_981025s0820103.fits |
| NGC1783 | 3 | s7_aJ_asky_981029s0370009.fits | s8_aH_asky_981029s0370009.fits | s9_aK_asky_981029s0370009.fits |
| NGC1806 | 2 | s1_aJ_asky_981025s0950092.fits | s2_aH_asky_981025s0950092.fits | s3_aK_asky_981025s0950092.fits |
| NGC1846 | 3 | s7_aJ_asky_981026s0820198.fits | s8_aH_asky_981026s0820198.fits | s9_aK_asky_981026s0820198.fits |
| NGC1939 | 2 | s1_aJ_asky_981220s0850186.fits | s2_aH_asky_981220s0850186.fits | s3_aK_asky_981220s0850186.fits |
| NGC1978 | 2 | s1_aJ_asky_000212s0190021.fits | s2_aH_asky_000212s0190021.fits | s3_aK_asky_000212s0190021.fits |
| NGC1987 | 3 | s4_aJ_asky_000209s0340221.fits | s5_aH_asky_000209s0340221.fits | s6_aK_asky_000209s0340221.fits |
| NGC2190 | 2 | s4_aJ_asky_981204s0710127.fits | s5_aH_asky_981204s0710127.fits | s6_aK_asky_981204s0710127.fits |
| NGC2203 | 2 | s1_aJ_asky_981204s0730162.fits | s2_aH_asky_981204s0730162.fits | s3_aK_asky_981204s0730162.fits |
| Cluster ID | ″ | Flag | ″ | ||||||||
|---|---|---|---|---|---|---|---|---|---|---|---|
| LINDSAY1 | 00:03:55.2 | -73:28:12.4 | 16.5 | BBB | 20 | 14.63 | 0.06 | 14.37 | 0.12 | 14.97 | 0.27 |
| 40 | 12.60 | 0.03 | 12.23 | 0.04 | 12.27 | 0.05 | |||||
| 60 | 11.67 | 0.03 | 11.29 | 0.03 | 11.17 | 0.04 | |||||
| 80 | 10.88 | 0.02 | 10.42 | 0.03 | 10.30 | 0.03 | |||||
| 100 | 10.52 | 0.03 | 10.04 | 0.03 | 9.97 | 0.03 | |||||
| 120 | 10.35 | 0.03 | 9.87 | 0.03 | 9.82 | 0.03 | |||||
| 140 | 10.25 | 0.04 | 9.79 | 0.04 | 9.73 | 0.04 | |||||
| 160 | 10.09 | 0.04 | 9.61 | 0.04 | 9.57 | 0.04 | |||||
| 180 | 9.92 | 0.04 | 9.40 | 0.04 | 9.37 | 0.05 | |||||
| 200 | 9.83 | 0.05 | 9.31 | 0.05 | 9.30 | 0.05 | |||||
| KRON3 | 00:24:42.1 | -72:47:35.2 | 17 | AAA | 20 | 12.04 | 0.02 | 11.91 | 0.01 | 11.92 | 0.02 |
| 40 | 10.90 | 0.01 | 10.36 | 0.01 | 10.24 | 0.01 | |||||
| 60 | 10.34 | 0.01 | 9.88 | 0.01 | 9.70 | 0.01 | |||||
| 80 | 10.00 | 0.01 | 9.57 | 0.01 | 9.41 | 0.01 | |||||
| 100 | 9.79 | 0.02 | 9.38 | 0.01 | 9.23 | 0.01 | |||||
| 120 | 9.60 | 0.02 | 9.19 | 0.01 | 9.05 | 0.01 | |||||
| 140 | 9.44 | 0.02 | 9.05 | 0.01 | 8.89 | 0.02 | |||||
| 160 | 9.38 | 0.02 | 9.03 | 0.01 | 8.86 | 0.02 | |||||
| NGC121 | 00:26:48.4 | -71:32:08.3 | 3.5 | AAB | 20 | 10.63 | 0.01 | 9.95 | 0.01 | 9.81 | 0.01 |
| 40 | 9.84 | 0.01 | 9.20 | 0.01 | 9.07 | 0.01 | |||||
| 60 | 9.54 | 0.01 | 8.92 | 0.01 | 8.83 | 0.01 | |||||
| 80 | 9.37 | 0.01 | 8.77 | 0.01 | 8.67 | 0.01 | |||||
| 100 | 9.23 | 0.01 | 8.65 | 0.01 | 8.58 | 0.01 | |||||
| 120 | 9.19 | 0.02 | 8.62 | 0.01 | 8.55 | 0.01 | |||||
| 140 | 9.16 | 0.02 | 8.61 | 0.02 | 8.53 | 0.02 | |||||
| 160 | 9.12 | 0.02 | 8.57 | 0.02 | 8.50 | 0.02 | |||||
| 180 | 9.07 | 0.03 | 8.53 | 0.02 | 8.47 | 0.02 | |||||
| 200 | 9.04 | 0.03 | 8.51 | 0.03 | 8.45 | 0.03 | |||||
| NGC152 | 00:32:54.4 | -73:06:54.1 | 8.5 | AAA | 20 | 13.63 | 0.03 | 13.63 | 0.04 | 13.22 | 0.04 |
| 40 | 11.65 | 0.02 | 10.95 | 0.01 | 10.62 | 0.01 | |||||
| 60 | 10.81 | 0.02 | 10.01 | 0.01 | 9.67 | 0.01 | |||||
| 80 | 10.51 | 0.02 | 9.68 | 0.01 | 9.35 | 0.01 | |||||
| 100 | 10.31 | 0.02 | 9.51 | 0.02 | 9.17 | 0.01 | |||||
| 120 | 10.23 | 0.03 | 9.46 | 0.02 | 9.12 | 0.02 | |||||
| 140 | 10.16 | 0.03 | 9.41 | 0.03 | 9.08 | 0.02 | |||||
| 160 | 10.07 | 0.04 | 9.32 | 0.03 | 9.03 | 0.03 | |||||
| 180 | 9.97 | 0.04 | 9.27 | 0.04 | 8.98 | 0.03 | |||||
| 200 | 9.94 | 0.05 | 9.23 | 0.04 | 8.97 | 0.04 | |||||
| NGC330 | 00:56:18.0 | -72:27:46.4 | 9.5 | AAA | 20 | 9.66 | 0.01 | 9.19 | 0.01 | 9.10 | 0.01 |
| 40 | 8.70 | 0.01 | 8.17 | 0.01 | 8.03 | 0.01 | |||||
| 60 | 8.34 | 0.01 | 7.79 | 0.01 | 7.62 | 0.01 | |||||
| 80 | 8.31 | 0.01 | 7.77 | 0.01 | 7.60 | 0.01 | |||||
| 100 | 8.12 | 0.01 | 7.54 | 0.01 | 7.33 | 0.01 | |||||
| 120 | 8.06 | 0.02 | 7.51 | 0.02 | 7.31 | 0.02 | |||||
| 140 | 8.03 | 0.02 | 7.49 | 0.02 | 7.30 | 0.02 | |||||
| 160 | 7.99 | 0.03 | 7.44 | 0.03 | 7.25 | 0.03 | |||||
| 180 | 7.94 | 0.03 | 7.39 | 0.03 | 7.23 | 0.04 | |||||
| 200 | 7.91 | 0.04 | 7.38 | 0.04 | 7.21 | 0.04 | |||||
| NGC339 | 00:57:45.2 | -74:28:14.3 | 7 | AAB | 20 | 13.08 | 0.02 | 12.49 | 0.02 | 12.33 | 0.02 |
| 40 | 11.82 | 0.02 | 11.23 | 0.02 | 11.06 | 0.02 | |||||
| 60 | 11.10 | 0.02 | 10.74 | 0.02 | 10.45 | 0.02 | |||||
| 80 | 10.72 | 0.02 | 10.30 | 0.02 | 10.15 | 0.02 | |||||
| 100 | 10.52 | 0.03 | 10.16 | 0.03 | 9.96 | 0.03 | |||||
| 120 | 10.35 | 0.03 | 10.08 | 0.04 | 9.83 | 0.03 | |||||
| 140 | 10.22 | 0.04 | 10.02 | 0.05 | 9.72 | 0.04 | |||||
| 160 | 10.15 | 0.04 | 10.02 | 0.06 | 9.69 | 0.05 | |||||
| 180 | 10.06 | 0.05 | 9.91 | 0.07 | 9.56 | 0.06 | |||||
| NGC361 | 01:02:10.8 | -71:36:19.3 | 5 | AAA | 20 | 12.68 | 0.02 | 11.20 | 0.01 | 11.09 | 0.01 |
| 40 | 11.45 | 0.02 | 10.51 | 0.01 | 10.39 | 0.01 | |||||
| 60 | 10.80 | 0.02 | 10.02 | 0.01 | 9.87 | 0.02 | |||||
| 80 | 10.48 | 0.02 | 9.71 | 0.02 | 9.62 | 0.02 | |||||
| 100 | 10.30 | 0.03 | 9.55 | 0.02 | 9.42 | 0.02 | |||||
| 120 | 10.18 | 0.03 | 9.46 | 0.02 | 9.21 | 0.03 | |||||
| 140 | 10.06 | 0.04 | 9.37 | 0.03 | 9.16 | 0.04 | |||||
| 160 | 9.97 | 0.05 | 9.29 | 0.04 | 9.15 | 0.05 | |||||
| 180 | 9.92 | 0.06 | 9.24 | 0.04 | 9.11 | 0.06 | |||||
| 200 | 9.87 | 0.07 | 9.21 | 0.05 | 9.10 | 0.07 | |||||
| NGC411 | 01:07:54.4 | -71:46:01.4 | 10.5 | AAA | 20 | 12.26 | 0.02 | 11.69 | 0.02 | 11.44 | 0.02 |
| 40 | 10.90 | 0.02 | 10.16 | 0.02 | 9.82 | 0.01 | |||||
| 60 | 10.53 | 0.03 | 9.86 | 0.03 | 9.65 | 0.02 | |||||
| 80 | 10.26 | 0.04 | 9.72 | 0.04 | 9.47 | 0.04 | |||||
| 100 | 10.14 | 0.05 | 9.58 | 0.06 | 9.36 | 0.05 | |||||
| 120 | 10.09 | 0.07 | 9.50 | 0.07 | 9.29 | 0.07 | |||||
| 140 | 10.01 | 0.09 | 9.40 | 0.09 | 9.21 | 0.09 | |||||
| 160 | 9.96 | 0.11 | 9.35 | 0.12 | 9.20 | 0.11 | |||||
| 180 | 9.88 | 0.13 | 9.26 | 0.14 | 9.12 | 0.13 | |||||
| 200 | 9.86 | 0.16 | 9.21 | 0.16 | 9.09 | 0.16 | |||||
| NGC416 | 01:07:58.8 | -72:21:18.6 | 7 | AAA | 20 | 10.80 | 0.01 | 10.28 | 0.01 | 10.35 | 0.01 |
| 40 | 10.08 | 0.01 | 9.47 | 0.01 | 9.42 | 0.01 | |||||
| 60 | 9.79 | 0.01 | 9.18 | 0.01 | 9.09 | 0.01 | |||||
| 80 | 9.66 | 0.02 | 9.03 | 0.01 | 8.95 | 0.01 | |||||
| 100 | 9.60 | 0.02 | 8.95 | 0.02 | 8.86 | 0.02 | |||||
| 120 | 9.53 | 0.02 | 8.89 | 0.02 | 8.78 | 0.03 | |||||
| 140 | 9.44 | 0.03 | 8.80 | 0.03 | 8.71 | 0.03 | |||||
| 160 | 9.40 | 0.03 | 8.76 | 0.04 | 8.69 | 0.04 | |||||
| 180 | 9.34 | 0.04 | 8.69 | 0.04 | 8.61 | 0.05 | |||||
| 200 | 9.29 | 0.05 | 8.62 | 0.05 | 8.58 | 0.06 | |||||
| NGC419 | 01:08:18.0 | -72:52:60.0 | 4 | BBB | 20 | 10.05 | 0.01 | 9.32 | 0.01 | 9.01 | 0.01 |
| 40 | 9.15 | 0.01 | 8.43 | 0.01 | 8.09 | 0.01 | |||||
| 60 | 8.76 | 0.01 | 8.06 | 0.01 | 7.69 | 0.01 | |||||
| 80 | 8.50 | 0.01 | 7.80 | 0.01 | 7.43 | 0.01 | |||||
| 100 | 8.41 | 0.02 | 7.70 | 0.01 | 7.36 | 0.01 | |||||
| 120 | 8.36 | 0.02 | 7.64 | 0.01 | 7.32 | 0.01 | |||||
| 140 | 8.31 | 0.02 | 7.60 | 0.02 | 7.28 | 0.02 | |||||
| 160 | 8.27 | 0.03 | 7.55 | 0.02 | 7.22 | 0.02 | |||||
| 180 | 8.24 | 0.04 | 7.53 | 0.03 | 7.19 | 0.03 | |||||
| 200 | 8.19 | 0.04 | 7.47 | 0.03 | 7.13 | 0.03 | |||||
| NGC458 | 01:14:53.1 | -71:33:00.3 | 5 | AAB | 20 | 12.27 | 0.01 | 11.92 | 0.01 | 11.85 | 0.02 |
| 40 | 11.38 | 0.01 | 11.12 | 0.01 | 10.99 | 0.02 | |||||
| 60 | 11.01 | 0.01 | 10.80 | 0.01 | 10.64 | 0.02 | |||||
| 80 | 10.81 | 0.02 | 10.69 | 0.02 | 10.50 | 0.02 | |||||
| 100 | 10.70 | 0.02 | 10.77 | 0.03 | 10.43 | 0.03 | |||||
| 120 | 10.64 | 0.02 | 10.87 | 0.04 | 10.42 | 0.04 | |||||
| 140 | 10.60 | 0.03 | 11.05 | 0.06 | 10.49 | 0.05 | |||||
| 160 | 10.56 | 0.03 | 11.12 | 0.08 | 10.37 | 0.06 | |||||
| 180 | 10.54 | 0.04 | 11.62 | 0.17 | 10.44 | 0.08 | |||||
| LINDSAY113 | 01:49:25.8 | -73:43:32.3 | 36.5 | BBA | 20 | 14.43 | 0.04 | 13.45 | 0.04 | 13.90 | 0.08 |
| 40 | 12.88 | 0.03 | 11.87 | 0.02 | 12.13 | 0.04 | |||||
| 60 | 11.52 | 0.02 | 10.54 | 0.01 | 10.36 | 0.01 | |||||
| 80 | 11.09 | 0.02 | 10.07 | 0.01 | 9.99 | 0.02 | |||||
| 100 | 10.62 | 0.02 | 9.57 | 0.01 | 9.51 | 0.01 | |||||
| 120 | 10.51 | 0.03 | 9.39 | 0.02 | 9.41 | 0.02 | |||||
| 130 | 10.47 | 0.03 | 9.31 | 0.02 | 9.35 | 0.02 |
| Cluster ID | ″ | Flag | ″ | ||||||||
|---|---|---|---|---|---|---|---|---|---|---|---|
| NGC1466 | 03:44:32.8 | -71:40:16.6 | 2.5 | AAA | 20 | 10.94 | 0.01 | 10.44 | 0.01 | 10.35 | 0.01 |
| 40 | 10.17 | 0.01 | 9.70 | 0.01 | 9.60 | 0.01 | |||||
| 60 | 9.83 | 0.02 | 9.39 | 0.01 | 9.30 | 0.01 | |||||
| 80 | 9.67 | 0.02 | 9.23 | 0.01 | 9.12 | 0.02 | |||||
| 100 | 9.58 | 0.03 | 9.15 | 0.02 | 9.03 | 0.02 | |||||
| 120 | 9.55 | 0.04 | 9.12 | 0.03 | 9.00 | 0.03 | |||||
| 140 | 9.52 | 0.05 | 9.08 | 0.03 | 8.95 | 0.04 | |||||
| 160 | 9.48 | 0.07 | 9.06 | 0.04 | 8.91 | 0.05 | |||||
| 180 | 9.45 | 0.08 | 9.03 | 0.05 | 8.88 | 0.06 | |||||
| 200 | 9.44 | 0.10 | 9.02 | 0.07 | 8.87 | 0.08 | |||||
| NGC1651 | 04:37:33.2 | -70:35:20.0 | 15.5 | AAA | 20 | 12.98 | 0.02 | 12.55 | 0.02 | 12.34 | 0.03 |
| 40 | 11.64 | 0.02 | 11.06 | 0.02 | 11.09 | 0.03 | |||||
| 60 | 11.10 | 0.02 | 10.49 | 0.02 | 10.43 | 0.03 | |||||
| 80 | 10.23 | 0.02 | 9.46 | 0.02 | 9.25 | 0.02 | |||||
| 100 | 10.00 | 0.02 | 9.23 | 0.02 | 9.10 | 0.02 | |||||
| 120 | 9.92 | 0.03 | 9.13 | 0.02 | 9.03 | 0.03 | |||||
| 140 | 9.78 | 0.04 | 9.01 | 0.03 | 8.86 | 0.03 | |||||
| 160 | 9.72 | 0.05 | 8.91 | 0.04 | 8.77 | 0.04 | |||||
| 180 | 9.71 | 0.06 | 8.88 | 0.04 | 8.73 | 0.05 | |||||
| 200 | 9.69 | 0.07 | 8.85 | 0.05 | 8.72 | 0.06 | |||||
| NGC1841 | 04:45:22.6 | -83:59:53.1 | 6 | AAB | 20 | 12.59 | 0.02 | 12.07 | 0.02 | 11.88 | 0.02 |
| 40 | 11.40 | 0.02 | 10.82 | 0.02 | 10.69 | 0.02 | |||||
| 60 | 10.64 | 0.02 | 10.09 | 0.02 | 9.99 | 0.02 | |||||
| 80 | 10.26 | 0.03 | 9.68 | 0.03 | 9.62 | 0.03 | |||||
| 100 | 9.97 | 0.03 | 9.36 | 0.03 | 9.33 | 0.04 | |||||
| 120 | 9.75 | 0.04 | 9.12 | 0.04 | 9.06 | 0.04 | |||||
| NGC1711 | 04:50:36.8 | -69:58:58.9 | 6 | AAA | 20 | 10.28 | 0.01 | 9.53 | 0.01 | 9.52 | 0.01 |
| 40 | 9.50 | 0.01 | 8.96 | 0.01 | 9.02 | 0.01 | |||||
| 60 | 9.36 | 0.01 | 8.88 | 0.01 | 8.93 | 0.02 | |||||
| 80 | 9.07 | 0.02 | 8.58 | 0.02 | 8.69 | 0.02 | |||||
| 100 | 8.97 | 0.02 | 8.50 | 0.02 | 8.59 | 0.03 | |||||
| 120 | 8.89 | 0.03 | 8.44 | 0.03 | 8.51 | 0.04 | |||||
| 140 | 8.81 | 0.03 | 8.34 | 0.04 | 8.40 | 0.05 | |||||
| 160 | 8.74 | 0.04 | 8.27 | 0.05 | 8.32 | 0.06 | |||||
| 180 | 8.70 | 0.05 | 8.20 | 0.06 | 8.25 | 0.08 | |||||
| 200 | 8.60 | 0.05 | 8.16 | 0.07 | 8.13 | 0.09 | |||||
| NGC1718 | 04:52:27.1 | -67:03:02.0 | 13.5 | ABA | 20 | 11.43 | 0.01 | 11.12 | 0.01 | 10.43 | 0.01 |
| 40 | 10.39 | 0.01 | 9.70 | 0.01 | 9.53 | 0.01 | |||||
| 60 | 10.07 | 0.01 | 9.21 | 0.01 | 9.04 | 0.01 | |||||
| 80 | 9.80 | 0.01 | 8.93 | 0.01 | 8.63 | 0.01 | |||||
| 100 | 9.71 | 0.02 | 8.85 | 0.01 | 8.58 | 0.01 | |||||
| 120 | 9.66 | 0.02 | 8.82 | 0.01 | 8.55 | 0.02 | |||||
| 140 | 9.57 | 0.02 | 8.77 | 0.02 | 8.49 | 0.02 | |||||
| 160 | 9.33 | 0.02 | 8.52 | 0.02 | 8.24 | 0.02 | |||||
| 180 | 9.12 | 0.03 | 8.32 | 0.02 | 8.01 | 0.02 | |||||
| 200 | 9.06 | 0.03 | 8.30 | 0.02 | 7.92 | 0.03 | |||||
| NGC1751 | 04:54:11.4 | -69:48:33.1 | 10.5 | BBA | 20 | 11.63 | 0.01 | 10.79 | 0.01 | 10.27 | 0.01 |
| 40 | 10.16 | 0.01 | 9.25 | 0.01 | 8.81 | 0.01 | |||||
| 60 | 9.88 | 0.02 | 8.84 | 0.01 | 8.41 | 0.01 | |||||
| 80 | 9.66 | 0.02 | 8.68 | 0.02 | 8.30 | 0.02 | |||||
| 100 | 9.52 | 0.03 | 8.60 | 0.02 | 8.23 | 0.02 | |||||
| 120 | 9.45 | 0.04 | 8.56 | 0.03 | 8.19 | 0.03 | |||||
| 140 | 9.39 | 0.05 | 8.52 | 0.04 | 8.17 | 0.04 | |||||
| 160 | 9.28 | 0.06 | 8.42 | 0.05 | 8.08 | 0.05 | |||||
| 180 | 9.24 | 0.07 | 8.40 | 0.07 | 8.05 | 0.06 | |||||
| 200 | 9.19 | 0.08 | 8.37 | 0.08 | 8.03 | 0.07 | |||||
| NGC1754 | 04:54:18.4 | -70:26:29.1 | 8 | AAB | 20 | 10.78 | 0.01 | 10.23 | 0.01 | 10.21 | 0.01 |
| 40 | 10.21 | 0.02 | 9.70 | 0.01 | 9.57 | 0.02 | |||||
| 60 | 9.99 | 0.03 | 9.41 | 0.02 | 9.33 | 0.02 | |||||
| 80 | 9.86 | 0.04 | 9.33 | 0.03 | 9.18 | 0.04 | |||||
| 100 | 9.74 | 0.06 | 9.24 | 0.04 | 9.08 | 0.05 | |||||
| 120 | 9.66 | 0.08 | 9.16 | 0.06 | 9.04 | 0.07 | |||||
| 140 | 9.63 | 0.10 | 9.13 | 0.07 | 9.01 | 0.10 | |||||
| 160 | 9.60 | 0.13 | 9.10 | 0.10 | 8.98 | 0.12 | |||||
| NGC1777 | 04:55:51.3 | -74:16:59.3 | 14 | AAA | 20 | 11.21 | 0.01 | 10.74 | 0.01 | 10.60 | 0.01 |
| 40 | 9.05 | 0.01 | 8.57 | 0.01 | 8.44 | 0.01 | |||||
| 60 | 8.65 | 0.01 | 8.24 | 0.01 | 8.12 | 0.01 | |||||
| 80 | 8.60 | 0.01 | 8.19 | 0.01 | 8.07 | 0.01 | |||||
| 100 | 8.55 | 0.01 | 8.15 | 0.01 | 8.05 | 0.02 | |||||
| 120 | 8.53 | 0.01 | 8.13 | 0.02 | 8.03 | 0.02 | |||||
| 140 | 8.52 | 0.01 | 8.11 | 0.03 | 8.03 | 0.03 | |||||
| 160 | 8.51 | 0.01 | 8.10 | 0.03 | 8.02 | 0.03 | |||||
| 180 | 8.50 | 0.01 | 8.09 | 0.04 | 8.01 | 0.04 | |||||
| 200 | 8.48 | 0.01 | 8.07 | 0.05 | 8.01 | 0.05 | |||||
| NGC1786 | 04:59:07.3 | -67:44:40.9 | 8 | AAB | 20 | 9.08 | 0.01 | 8.63 | 0.01 | 8.54 | 0.01 |
| 40 | 8.71 | 0.01 | 8.24 | 0.01 | 8.14 | 0.01 | |||||
| 60 | 8.57 | 0.01 | 8.09 | 0.01 | 8.00 | 0.01 | |||||
| 80 | 8.51 | 0.01 | 8.03 | 0.01 | 7.94 | 0.01 | |||||
| 98 | 8.48 | 0.01 | 7.99 | 0.01 | 7.91 | 0.01 | |||||
| NGC1783 | 04:59:08.8 | -65:59:12.8 | 8 | BBB | 20 | 10.83 | 0.01 | 10.13 | 0.01 | 10.06 | 0.01 |
| 40 | 9.69 | 0.01 | 9.04 | 0.01 | 8.93 | 0.01 | |||||
| 60 | 9.23 | 0.01 | 8.62 | 0.01 | 8.52 | 0.01 | |||||
| 80 | 8.90 | 0.01 | 8.26 | 0.01 | 8.17 | 0.01 | |||||
| 100 | 8.69 | 0.01 | 8.05 | 0.01 | 7.95 | 0.01 | |||||
| 120 | 8.46 | 0.02 | 7.78 | 0.01 | 7.64 | 0.01 | |||||
| 134 | 8.40 | 0.02 | 7.70 | 0.02 | 7.53 | 0.02 | |||||
| NGC1806 | 05:02:12.4 | -67:59:09.1 | 14 | BBA | 20 | 10.31 | 0.01 | 9.84 | 0.01 | 9.19 | 0.01 |
| 40 | 9.67 | 0.01 | 9.16 | 0.01 | 8.73 | 0.01 | |||||
| 60 | 9.19 | 0.01 | 8.62 | 0.01 | 8.21 | 0.01 | |||||
| 80 | 8.95 | 0.01 | 8.33 | 0.01 | 7.97 | 0.01 | |||||
| 100 | 8.85 | 0.01 | 8.24 | 0.01 | 7.89 | 0.01 | |||||
| 120 | 8.77 | 0.02 | 8.17 | 0.01 | 7.82 | 0.01 | |||||
| 140 | 8.70 | 0.02 | 8.12 | 0.02 | 7.78 | 0.02 | |||||
| 160 | 8.65 | 0.02 | 8.05 | 0.02 | 7.73 | 0.02 | |||||
| 180 | 8.55 | 0.02 | 7.91 | 0.02 | 7.59 | 0.02 | |||||
| 200 | 8.52 | 0.03 | 7.90 | 0.03 | 7.57 | 0.02 | |||||
| NGC1805 | 05:02:20.8 | -66:06:41.1 | 0 | ABB | 20 | 8.73 | 0.01 | 8.02 | 0.01 | 7.66 | 0.01 |
| 40 | 8.63 | 0.01 | 7.96 | 0.01 | 7.61 | 0.01 | |||||
| 60 | 8.55 | 0.01 | 7.91 | 0.01 | 7.57 | 0.01 | |||||
| 80 | 8.50 | 0.01 | 7.87 | 0.01 | 7.53 | 0.01 | |||||
| 100 | 8.49 | 0.01 | 7.87 | 0.01 | 7.52 | 0.01 | |||||
| 120 | 8.47 | 0.01 | 7.86 | 0.01 | 7.52 | 0.02 | |||||
| 140 | 8.46 | 0.01 | 7.86 | 0.02 | 7.51 | 0.02 | |||||
| 150 | 8.43 | 0.01 | 7.84 | 0.02 | 7.50 | 0.02 | |||||
| NGC1818 | 05:04:13.8 | -66:26:04.4 | 1 | ABA | 20 | 9.38 | 0.01 | 8.71 | 0.01 | 8.52 | 0.01 |
| 40 | 8.51 | 0.01 | 7.91 | 0.01 | 8.05 | 0.01 | |||||
| 60 | 8.31 | 0.01 | 7.66 | 0.01 | 7.77 | 0.01 | |||||
| 80 | 8.26 | 0.01 | 7.63 | 0.01 | 7.74 | 0.01 | |||||
| 100 | 8.19 | 0.01 | 7.62 | 0.01 | 7.72 | 0.01 | |||||
| 120 | 8.05 | 0.01 | 7.46 | 0.01 | 7.53 | 0.01 | |||||
| 140 | 8.03 | 0.01 | 7.44 | 0.01 | 7.49 | 0.01 | |||||
| 160 | 7.98 | 0.01 | 7.37 | 0.01 | 7.40 | 0.01 | |||||
| 180 | 7.96 | 0.01 | 7.36 | 0.01 | 7.40 | 0.01 | |||||
| 200 | 7.95 | 0.01 | 7.35 | 0.01 | 7.39 | 0.01 | |||||
| NGC1835 | 05:05:06.3 | -69:24:13.1 | 7 | AAB | 20 | 6.85 | 0.01 | 6.39 | 0.01 | 6.26 | 0.01 |
| 40 | 6.36 | 0.01 | 5.89 | 0.01 | 5.77 | 0.01 | |||||
| 60 | 6.18 | 0.01 | 5.66 | 0.01 | 5.54 | 0.01 | |||||
| 80 | 6.05 | 0.01 | 5.54 | 0.01 | 5.44 | 0.02 | |||||
| 100 | 5.99 | 0.02 | 5.48 | 0.02 | 5.40 | 0.02 | |||||
| 120 | 5.94 | 0.02 | 5.44 | 0.03 | 5.35 | 0.03 | |||||
| 130 | 5.92 | 0.03 | 5.41 | 0.03 | 5.33 | 0.04 | |||||
| NGC1831 | 05:06:15.9 | -64:55:05.2 | 0 | AAA | 20 | 11.78 | 0.01 | 11.51 | 0.01 | 11.46 | 0.01 |
| 40 | 10.56 | 0.01 | 10.22 | 0.01 | 10.34 | 0.01 | |||||
| 60 | 9.86 | 0.01 | 9.34 | 0.01 | 9.15 | 0.01 | |||||
| 80 | 9.65 | 0.02 | 9.10 | 0.02 | 8.92 | 0.01 | |||||
| 100 | 9.50 | 0.02 | 8.96 | 0.02 | 8.81 | 0.02 | |||||
| 120 | 9.40 | 0.03 | 8.90 | 0.03 | 8.73 | 0.02 | |||||
| 140 | 9.28 | 0.03 | 8.85 | 0.03 | 8.59 | 0.03 | |||||
| 160 | 9.17 | 0.04 | 8.72 | 0.04 | 8.50 | 0.03 | |||||
| 180 | 9.11 | 0.05 | 8.66 | 0.05 | 8.44 | 0.04 | |||||
| 200 | 9.08 | 0.06 | 8.64 | 0.06 | 8.43 | 0.05 | |||||
| NCC1847 | 05:07:07.5 | -68:58:22.1 | 5 | ABA | 20 | 10.53 | 0.01 | 10.19 | 0.01 | 9.93 | 0.01 |
| 40 | 10.02 | 0.01 | 9.45 | 0.01 | 9.40 | 0.01 | |||||
| 60 | 9.82 | 0.02 | 9.36 | 0.02 | 9.30 | 0.03 | |||||
| 80 | 9.68 | 0.02 | 9.23 | 0.03 | 9.17 | 0.04 | |||||
| 100 | 9.55 | 0.03 | 9.07 | 0.04 | 9.01 | 0.05 | |||||
| 120 | 9.44 | 0.04 | 9.05 | 0.05 | 8.87 | 0.07 | |||||
| 140 | 9.38 | 0.05 | 9.01 | 0.07 | 8.81 | 0.09 | |||||
| 160 | 9.30 | 0.06 | 8.94 | 0.09 | 8.69 | 0.11 | |||||
| 180 | 9.25 | 0.08 | 8.91 | 0.11 | 8.65 | 0.13 | |||||
| 200 | 9.13 | 0.09 | 8.68 | 0.11 | 8.40 | 0.13 | |||||
| NGC1846 | 05:07:34.9 | -67:27:45.5 | 7 | BBB | 20 | 11.03 | 0.01 | 10.35 | 0.01 | 10.10 | 0.01 |
| 40 | 9.85 | 0.01 | 9.13 | 0.01 | 8.79 | 0.01 | |||||
| 60 | 9.18 | 0.01 | 8.42 | 0.01 | 8.07 | 0.01 | |||||
| 80 | 8.82 | 0.02 | 8.08 | 0.01 | 7.76 | 0.01 | |||||
| 100 | 8.59 | 0.02 | 7.85 | 0.01 | 7.51 | 0.01 | |||||
| 120 | 8.42 | 0.02 | 7.66 | 0.02 | 7.30 | 0.02 | |||||
| 140 | 8.36 | 0.03 | 7.63 | 0.02 | 7.26 | 0.02 | |||||
| 160 | 8.30 | 0.03 | 7.58 | 0.03 | 7.21 | 0.03 | |||||
| NGC1850 | 05:08:45.4 | -68:45:41.5 | 10.5 | AAB | 20 | 9.81 | 0.01 | 9.51 | 0.01 | 9.30 | 0.01 |
| 40 | 8.79 | 0.01 | 8.40 | 0.01 | 8.26 | 0.01 | |||||
| 60 | 8.27 | 0.01 | 7.85 | 0.01 | 7.71 | 0.01 | |||||
| 80 | 8.01 | 0.01 | 7.57 | 0.02 | 7.42 | 0.02 | |||||
| 100 | 7.88 | 0.02 | 7.39 | 0.02 | 7.30 | 0.02 | |||||
| 120 | 7.74 | 0.02 | 7.26 | 0.02 | 7.16 | 0.02 | |||||
| 140 | 7.66 | 0.02 | 7.16 | 0.03 | 7.05 | 0.03 | |||||
| 160 | 7.53 | 0.03 | 7.01 | 0.03 | 6.89 | 0.03 | |||||
| NGC1856 | 05:09:29.8 | -69:07:40.7 | 6.5 | ABA | 20 | 10.19 | 0.01 | 9.90 | 0.01 | 9.60 | 0.01 |
| 40 | 9.33 | 0.01 | 8.93 | 0.01 | 8.80 | 0.01 | |||||
| 60 | 8.98 | 0.02 | 8.59 | 0.02 | 8.44 | 0.02 | |||||
| 80 | 8.76 | 0.02 | 8.33 | 0.03 | 8.14 | 0.03 | |||||
| 100 | 8.57 | 0.03 | 8.12 | 0.03 | 7.94 | 0.03 | |||||
| 120 | 8.46 | 0.04 | 7.99 | 0.04 | 7.83 | 0.05 | |||||
| 140 | 8.40 | 0.05 | 7.92 | 0.05 | 7.78 | 0.06 | |||||
| 160 | 8.26 | 0.06 | 7.74 | 0.06 | 7.61 | 0.07 | |||||
| 180 | 8.17 | 0.07 | 7.69 | 0.07 | 7.54 | 0.08 | |||||
| 200 | 8.06 | 0.07 | 7.58 | 0.08 | 7.49 | 0.10 | |||||
| NGC1860 | 05:10:38.8 | -68:45:11.0 | 0 | ABB | 20 | 13.49 | 0.07 | 13.23 | 0.10 | 13.68 | 0.18 |
| 40 | 12.66 | 0.12 | 12.54 | 0.19 | 12.49 | 0.21 | |||||
| 60 | 12.21 | 0.18 | 12.36 | 0.36 | 11.98 | 0.30 | |||||
| 80 | 11.62 | 0.18 | 11.40 | 0.26 | 11.57 | 0.37 | |||||
| 100 | 11.06 | 0.17 | 10.46 | 0.17 | 10.57 | 0.22 | |||||
| 120 | 11.01 | 0.24 | 10.30 | 0.21 | 10.47 | 0.30 | |||||
| NGC1866 | 05:13:38.5 | -65:27:51.3 | 2.5 | AAA | 20 | 10.11 | 0.01 | 9.63 | 0.01 | 9.50 | 0.01 |
| 40 | 9.05 | 0.01 | 8.59 | 0.01 | 8.41 | 0.01 | |||||
| 60 | 8.72 | 0.01 | 8.28 | 0.01 | 8.11 | 0.01 | |||||
| 80 | 8.48 | 0.02 | 8.03 | 0.01 | 7.87 | 0.01 | |||||
| 100 | 8.23 | 0.02 | 7.72 | 0.01 | 7.51 | 0.01 | |||||
| 120 | 8.16 | 0.02 | 7.66 | 0.02 | 7.45 | 0.02 | |||||
| 140 | 8.10 | 0.03 | 7.58 | 0.02 | 7.38 | 0.02 | |||||
| 160 | 8.07 | 0.04 | 7.56 | 0.03 | 7.36 | 0.03 | |||||
| 180 | 8.04 | 0.04 | 7.53 | 0.03 | 7.33 | 0.03 | |||||
| 200 | 8.01 | 0.05 | 7.51 | 0.04 | 7.29 | 0.04 | |||||
| NGC1868 | 05:14:35.8 | -63:57:14.3 | 4.5 | AAA | 20 | 11.01 | 0.01 | 10.47 | 0.01 | 10.39 | 0.01 |
| 40 | 10.34 | 0.01 | 9.83 | 0.01 | 9.70 | 0.01 | |||||
| 60 | 10.20 | 0.01 | 9.71 | 0.01 | 9.57 | 0.01 | |||||
| 80 | 10.13 | 0.02 | 9.66 | 0.02 | 9.52 | 0.02 | |||||
| 100 | 10.10 | 0.02 | 9.63 | 0.02 | 9.49 | 0.03 | |||||
| 120 | 10.08 | 0.03 | 9.60 | 0.03 | 9.47 | 0.04 | |||||
| 140 | 10.04 | 0.04 | 9.58 | 0.04 | 9.41 | 0.05 | |||||
| 160 | 9.98 | 0.05 | 9.52 | 0.05 | 9.31 | 0.05 | |||||
| 180 | 9.97 | 0.06 | 9.52 | 0.07 | 9.26 | 0.07 | |||||
| 200 | 9.94 | 0.07 | 9.49 | 0.08 | 9.17 | 0.08 | |||||
| NGC1898 | 05:16:41.2 | -69:39:24.8 | 3.5 | AAA | 20 | 10.92 | 0.01 | 10.65 | 0.02 | 10.26 | 0.01 |
| 40 | 10.11 | 0.02 | 9.61 | 0.02 | 9.37 | 0.02 | |||||
| 60 | 9.61 | 0.02 | 9.23 | 0.03 | 9.02 | 0.03 | |||||
| 80 | 9.34 | 0.03 | 8.96 | 0.04 | 8.86 | 0.05 | |||||
| 100 | 9.23 | 0.04 | 8.81 | 0.06 | 8.70 | 0.06 | |||||
| 120 | 9.15 | 0.06 | 8.70 | 0.08 | 8.59 | 0.08 | |||||
| 140 | 9.04 | 0.07 | 8.55 | 0.09 | 8.46 | 0.10 | |||||
| 160 | 8.93 | 0.09 | 8.43 | 0.11 | 8.37 | 0.12 | |||||
| 180 | 8.80 | 0.10 | 8.27 | 0.12 | 8.24 | 0.14 | |||||
| 200 | 8.68 | 0.11 | 8.15 | 0.13 | 8.11 | 0.15 | |||||
| NGC1916 | 05:18:37.1 | -69:24:23.7 | 9.5 | AAA | 20 | 8.82 | 0.01 | 8.31 | 0.01 | 8.07 | 0.01 |
| 40 | 8.40 | 0.01 | 7.96 | 0.01 | 7.71 | 0.01 | |||||
| 60 | 8.22 | 0.02 | 7.77 | 0.01 | 7.53 | 0.01 | |||||
| 80 | 8.11 | 0.02 | 7.63 | 0.02 | 7.40 | 0.02 | |||||
| 100 | 8.04 | 0.03 | 7.57 | 0.03 | 7.34 | 0.03 | |||||
| 120 | 7.97 | 0.04 | 7.51 | 0.04 | 7.28 | 0.04 | |||||
| 140 | 7.91 | 0.05 | 7.38 | 0.05 | 7.24 | 0.05 | |||||
| 160 | 7.86 | 0.06 | 7.31 | 0.06 | 7.15 | 0.06 | |||||
| 180 | 7.80 | 0.07 | 7.26 | 0.07 | 7.10 | 0.07 | |||||
| 200 | 7.74 | 0.08 | 7.20 | 0.08 | 7.04 | 0.09 | |||||
| NGC1939 | 05:21:25.9 | -69:56:55.3 | 5.5 | BBA | 20 | 11.03 | 0.01 | 10.66 | 0.01 | 10.55 | 0.01 |
| 40 | 10.30 | 0.02 | 9.84 | 0.02 | 9.78 | 0.02 | |||||
| 60 | 9.98 | 0.03 | 9.52 | 0.03 | 9.39 | 0.03 | |||||
| 80 | 9.80 | 0.04 | 9.30 | 0.04 | 9.20 | 0.05 | |||||
| 100 | 9.68 | 0.05 | 9.18 | 0.06 | 9.14 | 0.07 | |||||
| 120 | 9.54 | 0.06 | 9.02 | 0.07 | 8.94 | 0.08 | |||||
| 140 | 9.35 | 0.07 | 8.89 | 0.08 | 8.81 | 0.10 | |||||
| 160 | 9.26 | 0.09 | 8.80 | 0.10 | 8.70 | 0.12 | |||||
| 180 | 9.13 | 0.10 | 8.66 | 0.11 | 8.56 | 0.13 | |||||
| 200 | 9.05 | 0.11 | 8.57 | 0.13 | 8.42 | 0.14 | |||||
| NGC1987 | 05:27:18.1 | -70:44:06.1 | 7 | BBA | 20 | 11.05 | 0.01 | 10.30 | 0.01 | 10.05 | 0.01 |
| 40 | 10.66 | 0.01 | 9.99 | 0.01 | 9.73 | 0.01 | |||||
| 60 | 10.16 | 0.02 | 9.48 | 0.01 | 9.04 | 0.01 | |||||
| 80 | 9.96 | 0.02 | 9.23 | 0.02 | 8.89 | 0.02 | |||||
| 100 | 9.89 | 0.03 | 9.18 | 0.03 | 8.84 | 0.02 | |||||
| 120 | 9.69 | 0.04 | 9.00 | 0.03 | 8.66 | 0.03 | |||||
| 140 | 9.52 | 0.04 | 8.93 | 0.04 | 8.42 | 0.03 | |||||
| 160 | 9.46 | 0.05 | 8.81 | 0.05 | 8.36 | 0.04 | |||||
| 180 | 9.40 | 0.06 | 8.76 | 0.06 | 8.34 | 0.05 | |||||
| 200 | 9.32 | 0.07 | 8.70 | 0.07 | 8.29 | 0.06 | |||||
| NGC1984 | 05:27:40.0 | -69:08:02.5 | 6 | AAB | 20 | 8.95 | 0.01 | 8.39 | 0.01 | 8.10 | 0.01 |
| 40 | 8.84 | 0.01 | 8.34 | 0.01 | 8.05 | 0.01 | |||||
| 60 | 8.78 | 0.02 | 8.31 | 0.02 | 8.02 | 0.03 | |||||
| 80 | 8.76 | 0.03 | 8.30 | 0.04 | 8.00 | 0.05 | |||||
| 100 | 8.73 | 0.05 | 8.30 | 0.06 | 7.98 | 0.07 | |||||
| 120 | 8.15 | 0.04 | 7.56 | 0.04 | 7.26 | 0.05 | |||||
| 140 | 8.10 | 0.05 | 7.52 | 0.06 | 7.20 | 0.07 | |||||
| 160 | 8.09 | 0.07 | 7.52 | 0.07 | 7.19 | 0.09 | |||||
| 180 | 8.08 | 0.09 | 7.52 | 0.09 | 7.21 | 0.11 | |||||
| HODGE14 | 05:28:38.2 | -73:37:44.9 | 3.5 | AAA | 20 | 13.19 | 0.02 | 12.35 | 0.02 | 12.48 | 0.03 |
| 40 | 12.41 | 0.02 | 11.72 | 0.02 | 11.76 | 0.03 | |||||
| 60 | 12.08 | 0.03 | 11.40 | 0.03 | 11.47 | 0.04 | |||||
| 80 | 11.85 | 0.03 | 11.19 | 0.04 | 11.31 | 0.05 | |||||
| 100 | 11.75 | 0.04 | 10.98 | 0.05 | 11.06 | 0.06 | |||||
| 120 | 11.59 | 0.05 | 10.87 | 0.06 | 10.90 | 0.08 | |||||
| 140 | 11.46 | 0.07 | 10.77 | 0.07 | 10.76 | 0.09 | |||||
| 160 | 11.42 | 0.08 | 10.70 | 0.09 | 10.75 | 0.12 | |||||
| 180 | 11.22 | 0.09 | 10.68 | 0.11 | 10.54 | 0.12 | |||||
| 200 | 11.21 | 0.11 | 10.60 | 0.13 | 10.47 | 0.14 | |||||
| NGC1978 | 05:28:44.8 | -66:14:08.2 | 3 | BBA | 20 | 10.02 | 0.01 | 9.22 | 0.01 | 8.85 | 0.01 |
| 40 | 9.10 | 0.01 | 8.37 | 0.01 | 8.09 | 0.01 | |||||
| 60 | 8.74 | 0.01 | 8.04 | 0.01 | 7.81 | 0.01 | |||||
| 80 | 8.50 | 0.01 | 7.81 | 0.02 | 7.60 | 0.01 | |||||
| 100 | 8.34 | 0.01 | 7.66 | 0.02 | 7.45 | 0.01 | |||||
| 120 | 8.23 | 0.01 | 7.57 | 0.03 | 7.30 | 0.01 | |||||
| 140 | 8.16 | 0.02 | 7.51 | 0.04 | 7.25 | 0.01 | |||||
| 160 | 8.07 | 0.02 | 7.41 | 0.05 | 7.18 | 0.02 | |||||
| 180 | 8.03 | 0.02 | 7.37 | 0.06 | 7.14 | 0.02 | |||||
| 200 | 8.00 | 0.03 | 7.35 | 0.07 | 7.14 | 0.03 | |||||
| NGC2005 | 05:30:10.0 | -69:45:07.8 | 5.5 | AAB | 20 | 10.07 | 0.01 | 9.52 | 0.01 | 9.80 | 0.01 |
| 40 | 9.66 | 0.02 | 9.17 | 0.02 | 9.32 | 0.02 | |||||
| 60 | 9.51 | 0.03 | 8.96 | 0.04 | 9.15 | 0.04 | |||||
| 80 | 9.43 | 0.04 | 8.85 | 0.06 | 9.04 | 0.06 | |||||
| 100 | 9.33 | 0.06 | 8.75 | 0.08 | 8.92 | 0.08 | |||||
| 120 | 9.27 | 0.08 | 8.65 | 0.10 | 8.85 | 0.11 | |||||
| 140 | 9.23 | 0.11 | 8.58 | 0.14 | 8.80 | 0.15 | |||||
| NGC2004 | 05:30:41.6 | -67:17:14.6 | 11 | AAA | 20 | 8.58 | 0.01 | 7.84 | 0.01 | 7.57 | 0.01 |
| 40 | 8.10 | 0.01 | 7.39 | 0.01 | 7.12 | 0.01 | |||||
| 60 | 7.87 | 0.01 | 7.17 | 0.01 | 6.89 | 0.01 | |||||
| 80 | 7.65 | 0.01 | 6.96 | 0.01 | 6.69 | 0.01 | |||||
| 100 | 7.32 | 0.02 | 6.62 | 0.01 | 6.36 | 0.01 | |||||
| 120 | 7.27 | 0.02 | 6.57 | 0.02 | 6.30 | 0.02 | |||||
| 140 | 7.15 | 0.02 | 6.45 | 0.02 | 6.19 | 0.02 | |||||
| 160 | 7.14 | 0.03 | 6.44 | 0.03 | 6.19 | 0.03 | |||||
| 180 | 7.12 | 0.03 | 6.44 | 0.03 | 6.18 | 0.04 | |||||
| 200 | 7.10 | 0.04 | 6.43 | 0.04 | 6.18 | 0.05 | |||||
| NGC2019 | 05:31:56.0 | -70:09:33.4 | 2 | AAA | 20 | 9.80 | 0.01 | 9.28 | 0.01 | 9.21 | 0.01 |
| 40 | 9.29 | 0.01 | 8.84 | 0.01 | 8.73 | 0.01 | |||||
| 60 | 9.10 | 0.02 | 8.65 | 0.02 | 8.54 | 0.02 | |||||
| 80 | 8.94 | 0.02 | 8.57 | 0.02 | 8.46 | 0.03 | |||||
| 100 | 8.84 | 0.03 | 8.52 | 0.03 | 8.39 | 0.04 | |||||
| 120 | 8.77 | 0.03 | 8.46 | 0.05 | 8.31 | 0.05 | |||||
| 140 | 8.69 | 0.04 | 8.36 | 0.06 | 8.19 | 0.06 | |||||
| 160 | 8.58 | 0.05 | 8.20 | 0.07 | 8.14 | 0.08 | |||||
| 180 | 8.52 | 0.06 | 8.13 | 0.08 | 8.07 | 0.10 | |||||
| 200 | 8.47 | 0.07 | 7.97 | 0.09 | 7.86 | 0.10 | |||||
| NGC2011 | 05:32:19.0 | -67:31:24.9 | 8 | AAA | 20 | 9.17 | 0.01 | 8.37 | 0.01 | 8.05 | 0.01 |
| 40 | 8.76 | 0.01 | 8.03 | 0.01 | 7.72 | 0.01 | |||||
| 60 | 8.48 | 0.01 | 7.75 | 0.01 | 7.46 | 0.01 | |||||
| 80 | 8.46 | 0.02 | 7.74 | 0.01 | 7.45 | 0.01 | |||||
| 100 | 8.42 | 0.02 | 7.71 | 0.01 | 7.45 | 0.02 | |||||
| 120 | 8.40 | 0.03 | 7.68 | 0.02 | 7.42 | 0.02 | |||||
| 140 | 8.31 | 0.03 | 7.63 | 0.02 | 7.38 | 0.03 | |||||
| 160 | 7.83 | 0.03 | 7.11 | 0.02 | 6.82 | 0.02 | |||||
| 180 | 7.68 | 0.03 | 6.96 | 0.02 | 6.68 | 0.02 | |||||
| 200 | 7.64 | 0.03 | 6.94 | 0.03 | 6.66 | 0.03 | |||||
| HODGE4 | 05:32:25.0 | -64:44:02.1 | 8 | AAA | 20 | 13.25 | 0.02 | 12.94 | 0.03 | 12.63 | 0.03 |
| 40 | 12.01 | 0.02 | 11.66 | 0.03 | 11.36 | 0.03 | |||||
| 60 | 11.32 | 0.02 | 10.85 | 0.02 | 10.71 | 0.03 | |||||
| 80 | 11.05 | 0.03 | 10.63 | 0.03 | 10.47 | 0.04 | |||||
| 100 | 10.83 | 0.04 | 10.40 | 0.04 | 10.28 | 0.05 | |||||
| 120 | 10.74 | 0.05 | 10.32 | 0.06 | 10.22 | 0.07 | |||||
| 140 | 10.63 | 0.06 | 10.20 | 0.07 | 10.12 | 0.08 | |||||
| 160 | 10.59 | 0.08 | 10.15 | 0.08 | 10.15 | 0.11 | |||||
| 180 | 10.53 | 0.09 | 10.07 | 0.10 | 10.08 | 0.13 | |||||
| 200 | 10.48 | 0.11 | 10.06 | 0.12 | 10.04 | 0.16 | |||||
| NGC2031 | 05:33:41.4 | -70:59:12.8 | 3 | AAB | 20 | 10.82 | 0.01 | 10.10 | 0.01 | 10.43 | 0.01 |
| 40 | 9.55 | 0.01 | 8.78 | 0.01 | 8.64 | 0.01 | |||||
| 60 | 9.40 | 0.01 | 8.68 | 0.01 | 8.55 | 0.01 | |||||
| 80 | 9.29 | 0.02 | 8.60 | 0.02 | 8.48 | 0.02 | |||||
| 100 | 9.18 | 0.02 | 8.49 | 0.02 | 8.38 | 0.02 | |||||
| 120 | 9.09 | 0.03 | 8.43 | 0.03 | 8.30 | 0.03 | |||||
| 140 | 8.98 | 0.03 | 8.31 | 0.03 | 8.19 | 0.04 | |||||
| 160 | 8.85 | 0.04 | 8.18 | 0.04 | 8.04 | 0.04 | |||||
| 170 | 8.80 | 0.04 | 8.14 | 0.04 | 7.99 | 0.04 | |||||
| NGC2100 | 05:42:08.0 | -69:12:46.9 | 6 | AAB | 20 | 9.49 | 0.01 | 8.88 | 0.01 | 8.64 | 0.01 |
| 40 | 8.21 | 0.01 | 7.51 | 0.01 | 7.19 | 0.01 | |||||
| 60 | 7.64 | 0.01 | 6.94 | 0.01 | 6.64 | 0.01 | |||||
| 80 | 7.47 | 0.02 | 6.76 | 0.01 | 6.46 | 0.01 | |||||
| 100 | 7.27 | 0.02 | 6.57 | 0.01 | 6.29 | 0.01 | |||||
| 120 | 7.23 | 0.02 | 6.55 | 0.02 | 6.27 | 0.02 | |||||
| 140 | 7.05 | 0.02 | 6.35 | 0.02 | 6.08 | 0.02 | |||||
| 150 | 7.04 | 0.03 | 6.35 | 0.02 | 6.07 | 0.03 | |||||
| SL663 | 05:42:30.2 | -65:21:38.8 | 12 | AAA | 20 | 13.86 | 0.04 | 13.63 | 0.06 | 13.19 | 0.06 |
| 40 | 12.34 | 0.03 | 12.14 | 0.05 | 11.84 | 0.05 | |||||
| 60 | 11.22 | 0.02 | 11.08 | 0.04 | 11.02 | 0.04 | |||||
| 80 | 11.09 | 0.04 | 10.94 | 0.06 | 10.92 | 0.07 | |||||
| 100 | 10.95 | 0.05 | 10.81 | 0.08 | 10.76 | 0.09 | |||||
| 120 | 10.82 | 0.06 | 10.63 | 0.10 | 10.53 | 0.11 | |||||
| 140 | 10.78 | 0.08 | 10.50 | 0.12 | 10.20 | 0.11 | |||||
| 160 | 10.76 | 0.10 | 10.40 | 0.14 | 10.11 | 0.13 | |||||
| 180 | 10.74 | 0.13 | 10.38 | 0.18 | 10.07 | 0.16 | |||||
| 200 | 10.63 | 0.14 | 10.37 | 0.22 | 10.04 | 0.19 | |||||
| NGC2121 | 05:48:11.9 | -71:28:42.4 | 5 | AAA | 20 | 12.75 | 0.03 | 12.29 | 0.03 | 11.91 | 0.03 |
| 40 | 11.38 | 0.03 | 10.88 | 0.03 | 10.27 | 0.02 | |||||
| 60 | 10.47 | 0.03 | 9.79 | 0.03 | 9.22 | 0.02 | |||||
| 80 | 9.94 | 0.03 | 9.44 | 0.04 | 8.99 | 0.03 | |||||
| 100 | 9.75 | 0.04 | 9.24 | 0.05 | 8.85 | 0.04 | |||||
| 120 | 9.58 | 0.05 | 9.06 | 0.06 | 8.65 | 0.05 | |||||
| 140 | 9.47 | 0.06 | 8.96 | 0.07 | 8.54 | 0.06 | |||||
| 160 | 9.38 | 0.07 | 8.84 | 0.08 | 8.44 | 0.07 | |||||
| 180 | 9.14 | 0.07 | 8.48 | 0.08 | 8.15 | 0.07 | |||||
| 200 | 9.05 | 0.08 | 8.39 | 0.09 | 8.07 | 0.08 | |||||
| NGC2136 | 05:52:57.3 | -69:29:29.3 | 166 | AAB | 20 | 10.17 | 0.01 | 9.55 | 0.01 | 9.74 | 0.01 |
| 40 | 9.49 | 0.01 | 8.90 | 0.01 | 8.96 | 0.01 | |||||
| 60 | 9.29 | 0.02 | 8.79 | 0.01 | 8.80 | 0.01 | |||||
| 80 | 9.20 | 0.02 | 8.72 | 0.02 | 8.71 | 0.02 | |||||
| 100 | 9.06 | 0.03 | 8.60 | 0.03 | 8.54 | 0.03 | |||||
| 120 | 9.02 | 0.04 | 8.52 | 0.03 | 8.46 | 0.04 | |||||
| 140 | 8.97 | 0.05 | 8.42 | 0.04 | 8.32 | 0.04 | |||||
| 160 | 8.89 | 0.06 | 8.39 | 0.05 | 8.28 | 0.06 | |||||
| 180 | 8.81 | 0.07 | 8.33 | 0.07 | 8.23 | 0.07 | |||||
| 200 | 8.75 | 0.08 | 8.27 | 0.08 | 8.15 | 0.08 | |||||
| NGC2157 | 05:57:34.5 | -69:11:45.2 | 4.5 | ABB | 20 | 10.28 | 0.01 | 9.83 | 0.01 | 9.64 | 0.01 |
| 40 | 9.23 | 0.01 | 8.69 | 0.01 | 8.53 | 0.01 | |||||
| 60 | 9.01 | 0.01 | 8.48 | 0.01 | 8.34 | 0.01 | |||||
| 80 | 8.93 | 0.02 | 8.39 | 0.01 | 8.26 | 0.01 | |||||
| 100 | 8.86 | 0.02 | 8.30 | 0.02 | 8.18 | 0.02 | |||||
| 120 | 8.83 | 0.03 | 8.25 | 0.02 | 8.15 | 0.02 | |||||
| 132 | 8.82 | 0.04 | 8.21 | 0.03 | 8.13 | 0.03 | |||||
| NGC2156 | 05:57:49.6 | -68:27:37.9 | 17 | ABA | 20 | 12.34 | 0.02 | 11.74 | 0.02 | 11.57 | 0.02 |
| 40 | 11.61 | 0.03 | 11.31 | 0.04 | 11.03 | 0.04 | |||||
| 60 | 11.32 | 0.05 | 11.01 | 0.06 | 10.83 | 0.06 | |||||
| 80 | 11.13 | 0.07 | 10.85 | 0.10 | 10.60 | 0.09 | |||||
| 100 | 11.06 | 0.10 | 10.75 | 0.14 | 10.48 | 0.13 | |||||
| 120 | 11.00 | 0.13 | 10.64 | 0.18 | 10.44 | 0.18 | |||||
| 140 | 10.84 | 0.16 | 10.45 | 0.21 | 10.47 | 0.26 | |||||
| 160 | 10.69 | 0.18 | 10.39 | 0.26 | 10.31 | 0.29 | |||||
| 180 | 10.64 | 0.22 | 10.34 | 0.32 | 10.23 | 0.35 | |||||
| 200 | 10.60 | 0.27 | 10.28 | 0.39 | 10.08 | 0.39 | |||||
| NGC2153 | 05:57:50.8 | -66:23:58.9 | 9.5 | ABB | 20 | 13.55 | 0.03 | 13.03 | 0.03 | 12.98 | 0.05 |
| 40 | 12.77 | 0.04 | 12.31 | 0.05 | 12.21 | 0.06 | |||||
| 60 | 12.61 | 0.08 | 12.37 | 0.10 | 11.92 | 0.09 | |||||
| 80 | 12.47 | 0.12 | 12.45 | 0.18 | 11.72 | 0.13 | |||||
| NGC2173 | 05:57:58.6 | -72:58:45.3 | 9 | AAA | 20 | 11.63 | 0.02 | 11.15 | 0.01 | 10.69 | 0.01 |
| 40 | 10.39 | 0.02 | 9.75 | 0.01 | 9.51 | 0.01 | |||||
| 60 | 10.19 | 0.02 | 9.59 | 0.02 | 9.36 | 0.02 | |||||
| 80 | 10.06 | 0.04 | 9.44 | 0.03 | 9.23 | 0.03 | |||||
| 100 | 9.96 | 0.05 | 9.35 | 0.04 | 9.13 | 0.04 | |||||
| 120 | 9.83 | 0.07 | 9.19 | 0.05 | 8.98 | 0.05 | |||||
| 140 | 9.78 | 0.08 | 9.14 | 0.07 | 8.93 | 0.06 | |||||
| 160 | 9.72 | 0.11 | 9.07 | 0.08 | 8.91 | 0.08 | |||||
| 180 | 9.68 | 0.13 | 9.05 | 0.10 | 8.87 | 0.10 | |||||
| 200 | 9.66 | 0.16 | 9.05 | 0.13 | 8.86 | 0.12 | |||||
| NGC2159 | 05:58:03.0 | -68:37:17.5 | 34.5 | ABA | 20 | 12.17 | 0.01 | 12.43 | 0.02 | 11.71 | 0.02 |
| 40 | 10.70 | 0.01 | 10.29 | 0.01 | 10.13 | 0.01 | |||||
| 60 | 10.54 | 0.02 | 10.14 | 0.02 | 10.03 | 0.02 | |||||
| 80 | 10.44 | 0.02 | 10.02 | 0.02 | 9.95 | 0.03 | |||||
| 100 | 10.36 | 0.03 | 9.90 | 0.03 | 9.90 | 0.04 | |||||
| 120 | 10.30 | 0.04 | 9.86 | 0.05 | 9.93 | 0.05 | |||||
| 140 | 10.19 | 0.05 | 9.78 | 0.06 | 9.85 | 0.07 | |||||
| 160 | 10.14 | 0.06 | 9.74 | 0.07 | 9.83 | 0.09 | |||||
| 180 | 10.02 | 0.07 | 9.72 | 0.09 | 9.67 | 0.09 | |||||
| 200 | 9.97 | 0.08 | 9.65 | 0.11 | 9.61 | 0.11 | |||||
| NGC2155 | 05:58:32.4 | -65:28:39.6 | 6 | AAA | 20 | 12.53 | 0.02 | 11.93 | 0.01 | 11.89 | 0.02 |
| 40 | 11.35 | 0.01 | 10.69 | 0.01 | 10.63 | 0.02 | |||||
| 60 | 11.00 | 0.02 | 10.33 | 0.02 | 10.38 | 0.02 | |||||
| 80 | 10.83 | 0.02 | 10.18 | 0.03 | 10.26 | 0.04 | |||||
| 100 | 10.71 | 0.03 | 10.05 | 0.03 | 10.15 | 0.05 | |||||
| 120 | 10.60 | 0.04 | 10.01 | 0.05 | 10.04 | 0.06 | |||||
| 140 | 10.40 | 0.04 | 9.85 | 0.05 | 9.83 | 0.07 | |||||
| 160 | 10.31 | 0.05 | 9.79 | 0.07 | 9.77 | 0.09 | |||||
| 180 | 10.26 | 0.06 | 9.79 | 0.09 | 9.71 | 0.11 | |||||
| 200 | 10.15 | 0.07 | 9.55 | 0.09 | 9.48 | 0.11 | |||||
| NGC2164 | 05:58:54.9 | -68:30:52.2 | 14 | ABB | 20 | 10.92 | 0.01 | 10.67 | 0.01 | 10.67 | 0.01 |
| 40 | 9.98 | 0.01 | 9.71 | 0.01 | 9.74 | 0.01 | |||||
| 60 | 9.54 | 0.01 | 9.30 | 0.01 | 9.24 | 0.01 | |||||
| 80 | 9.38 | 0.01 | 9.11 | 0.01 | 9.04 | 0.01 | |||||
| 100 | 9.31 | 0.01 | 9.05 | 0.01 | 8.98 | 0.02 | |||||
| 120 | 9.26 | 0.02 | 9.00 | 0.02 | 8.91 | 0.02 | |||||
| 140 | 9.23 | 0.02 | 8.97 | 0.02 | 8.84 | 0.02 | |||||
| 160 | 9.08 | 0.02 | 8.79 | 0.02 | 8.66 | 0.03 | |||||
| 180 | 9.06 | 0.02 | 8.77 | 0.03 | 8.63 | 0.03 | |||||
| 184 | 9.05 | 0.03 | 8.77 | 0.03 | 8.61 | 0.03 | |||||
| NGC2172 | 06:00:05.5 | -68:38:17.7 | 7 | ABB | 20 | 12.61 | 0.02 | 12.90 | 0.03 | 12.17 | 0.02 |
| 40 | 11.35 | 0.02 | 11.77 | 0.03 | 11.09 | 0.02 | |||||
| 60 | 11.27 | 0.02 | 11.68 | 0.06 | 11.01 | 0.04 | |||||
| 80 | 11.09 | 0.03 | 11.55 | 0.09 | 10.98 | 0.06 | |||||
| 100 | 10.98 | 0.05 | 11.12 | 0.10 | 10.74 | 0.07 | |||||
| 120 | 10.94 | 0.06 | 11.10 | 0.14 | 10.70 | 0.10 | |||||
| 140 | 10.89 | 0.08 | 11.17 | 0.20 | 10.59 | 0.13 | |||||
| 160 | 10.84 | 0.10 | 11.08 | 0.24 | 10.57 | 0.16 | |||||
| 180 | 10.80 | 0.12 | 10.89 | 0.26 | 10.54 | 0.20 | |||||
| 190 | 10.83 | 0.14 | 10.89 | 0.29 | 10.56 | 0.23 | |||||
| NGC2162 | 06:00:30.0 | -63:43:13.2 | 6 | AAA | 20 | 12.10 | 0.02 | 11.20 | 0.01 | 11.18 | 0.01 |
| 40 | 11.15 | 0.02 | 10.38 | 0.02 | 10.20 | 0.02 | |||||
| 60 | 10.91 | 0.04 | 10.22 | 0.03 | 10.02 | 0.02 | |||||
| 80 | 10.77 | 0.06 | 10.14 | 0.04 | 9.90 | 0.04 | |||||
| 100 | 10.62 | 0.08 | 10.01 | 0.06 | 9.78 | 0.05 | |||||
| 120 | 10.55 | 0.10 | 9.97 | 0.08 | 9.75 | 0.07 | |||||
| 140 | 10.48 | 0.13 | 9.91 | 0.11 | 9.70 | 0.10 | |||||
| 160 | 10.40 | 0.16 | 9.84 | 0.13 | 9.67 | 0.12 | |||||
| 180 | 10.35 | 0.20 | 9.82 | 0.17 | 9.65 | 0.15 | |||||
| 200 | 10.33 | 0.25 | 9.77 | 0.20 | 9.65 | 0.19 | |||||
| NGC2190 | 06:01:01.2 | -74:43:37.3 | 9 | BBA | 20 | 13.10 | 0.03 | 12.68 | 0.03 | 12.74 | 0.04 |
| 40 | 11.88 | 0.03 | 11.32 | 0.03 | 11.18 | 0.03 | |||||
| 60 | 11.47 | 0.04 | 10.87 | 0.04 | 10.69 | 0.04 | |||||
| 80 | 10.87 | 0.04 | 10.04 | 0.03 | 9.63 | 0.02 | |||||
| 100 | 10.72 | 0.05 | 9.90 | 0.04 | 9.47 | 0.03 | |||||
| 120 | 10.64 | 0.07 | 9.85 | 0.06 | 9.44 | 0.05 | |||||
| 140 | 10.30 | 0.07 | 9.52 | 0.06 | 9.08 | 0.04 | |||||
| 160 | 10.16 | 0.08 | 9.43 | 0.07 | 9.01 | 0.05 | |||||
| 180 | 10.13 | 0.11 | 9.41 | 0.09 | 8.99 | 0.07 | |||||
| 200 | 10.12 | 0.13 | 9.40 | 0.11 | 9.00 | 0.08 | |||||
| ESO121-3 | 06:02:02.3 | -60:31:20.5 | 3 | BBB | 20 | 14.30 | 0.06 | 13.14 | 0.04 | 13.21 | 0.05 |
| 40 | 13.13 | 0.08 | 12.21 | 0.05 | 12.17 | 0.06 | |||||
| 60 | 12.35 | 0.08 | 11.60 | 0.06 | 11.71 | 0.08 | |||||
| 80 | 12.09 | 0.12 | 11.51 | 0.10 | 11.56 | 0.12 | |||||
| 100 | 11.81 | 0.14 | 11.23 | 0.12 | 11.41 | 0.16 | |||||
| 120 | 11.78 | 0.20 | 11.18 | 0.17 | 11.30 | 0.21 | |||||
| 140 | 11.60 | 0.23 | 11.11 | 0.22 | 11.36 | 0.31 | |||||
| 160 | 11.56 | 0.30 | 11.11 | 0.30 | 11.39 | 0.43 | |||||
| 180 | 11.58 | 0.39 | 11.23 | 0.44 | 11.51 | 0.65 | |||||
| 200 | 11.54 | 0.48 | 11.33 | 0.63 | 11.41 | 0.77 | |||||
| NGC2203 | 06:04:41.3 | -75:26:11.0 | 8 | BBA | 20 | 11.76 | 0.02 | 11.09 | 0.01 | 10.90 | 0.01 |
| 40 | 10.52 | 0.02 | 9.87 | 0.01 | 9.72 | 0.02 | |||||
| 60 | 10.13 | 0.02 | 9.51 | 0.02 | 9.36 | 0.02 | |||||
| 80 | 9.69 | 0.03 | 9.03 | 0.02 | 8.84 | 0.02 | |||||
| 100 | 9.57 | 0.04 | 8.91 | 0.03 | 8.72 | 0.03 | |||||
| 120 | 9.44 | 0.05 | 8.77 | 0.04 | 8.56 | 0.04 | |||||
| 140 | 9.36 | 0.06 | 8.70 | 0.05 | 8.48 | 0.05 | |||||
| 160 | 9.26 | 0.07 | 8.60 | 0.06 | 8.38 | 0.06 | |||||
| 180 | 9.19 | 0.09 | 8.55 | 0.07 | 8.32 | 0.07 | |||||
| 200 | 8.95 | 0.09 | 8.35 | 0.07 | 8.15 | 0.08 | |||||
| NGC2193 | 06:06:17.3 | -65:05:49.5 | 5 | AAA | 20 | 13.15 | 0.04 | 12.47 | 0.03 | 12.74 | 0.05 |
| 40 | 11.78 | 0.04 | 11.10 | 0.03 | 10.96 | 0.03 | |||||
| 60 | 11.07 | 0.05 | 10.41 | 0.04 | 10.27 | 0.04 | |||||
| 80 | 10.77 | 0.06 | 10.10 | 0.05 | 9.96 | 0.05 | |||||
| 100 | 10.59 | 0.09 | 9.88 | 0.07 | 9.75 | 0.07 | |||||
| 120 | 10.50 | 0.11 | 9.84 | 0.10 | 9.70 | 0.09 | |||||
| 140 | 10.40 | 0.14 | 9.76 | 0.12 | 9.54 | 0.11 | |||||
| 160 | 10.36 | 0.18 | 9.70 | 0.15 | 9.50 | 0.14 | |||||
| 180 | 10.35 | 0.23 | 9.67 | 0.19 | 9.50 | 0.18 | |||||
| 200 | 10.33 | 0.28 | 9.66 | 0.23 | 9.45 | 0.21 | |||||
| SL842 | 06:08:14.5 | -62:59:22.7 | 6 | AAB | 20 | 12.08 | 0.02 | 11.21 | 0.01 | 10.94 | 0.01 |
| 40 | 11.88 | 0.03 | 11.13 | 0.02 | 10.85 | 0.02 | |||||
| 60 | 11.74 | 0.05 | 11.11 | 0.04 | 10.79 | 0.03 | |||||
| NGC2209 | 06:08:34.7 | -73:50:09.2 | 20 | ABB | 20 | 13.59 | 0.06 | 13.41 | 0.10 | 13.26 | 0.12 |
| 40 | 12.08 | 0.06 | 11.66 | 0.08 | 11.31 | 0.07 | |||||
| 60 | 10.79 | 0.04 | 9.90 | 0.03 | 9.38 | 0.03 | |||||
| 80 | 10.63 | 0.06 | 9.83 | 0.06 | 9.32 | 0.04 | |||||
| 100 | 10.53 | 0.09 | 9.78 | 0.08 | 9.28 | 0.07 | |||||
| 120 | 10.45 | 0.12 | 9.76 | 0.12 | 9.26 | 0.10 | |||||
| 126 | 10.42 | 0.13 | 9.74 | 0.13 | 9.25 | 0.10 | |||||
| NGC2213 | 06:10:41.9 | -71:31:41.2 | 0 | AAB | 20 | 11.02 | 0.01 | 10.18 | 0.01 | 9.73 | 0.01 |
| 40 | 10.54 | 0.01 | 9.72 | 0.01 | 9.33 | 0.01 | |||||
| 60 | 10.40 | 0.02 | 9.56 | 0.01 | 9.25 | 0.01 | |||||
| 80 | 10.28 | 0.02 | 9.41 | 0.02 | 9.12 | 0.02 | |||||
| 100 | 10.15 | 0.03 | 9.25 | 0.02 | 8.96 | 0.02 | |||||
| 120 | 10.10 | 0.04 | 9.16 | 0.03 | 8.94 | 0.03 | |||||
| 140 | 9.93 | 0.05 | 8.98 | 0.03 | 8.78 | 0.04 | |||||
| 160 | 9.86 | 0.06 | 8.93 | 0.04 | 8.74 | 0.05 | |||||
| SL855 | 06:10:52.8 | -65:02:38.1 | 3 | ABB | 20 | 14.85 | 0.15 | 13.71 | 0.08 | 13.66 | 0.09 |
| NGC2210 | 06:11:31.2 | -69:07:15.5 | 2.5 | AAA | 20 | 10.05 | 0.01 | 9.53 | 0.01 | 9.43 | 0.01 |
| 40 | 9.45 | 0.01 | 8.91 | 0.01 | 8.83 | 0.01 | |||||
| 60 | 9.27 | 0.01 | 8.73 | 0.01 | 8.68 | 0.01 | |||||
| 80 | 9.16 | 0.01 | 8.61 | 0.01 | 8.57 | 0.01 | |||||
| 100 | 9.08 | 0.02 | 8.56 | 0.02 | 8.50 | 0.01 | |||||
| 120 | 9.04 | 0.02 | 8.53 | 0.02 | 8.48 | 0.02 | |||||
| 140 | 9.00 | 0.03 | 8.52 | 0.03 | 8.47 | 0.02 | |||||
| 160 | 8.98 | 0.03 | 8.48 | 0.04 | 8.41 | 0.03 | |||||
| 180 | 8.95 | 0.04 | 8.45 | 0.05 | 8.38 | 0.04 | |||||
| 200 | 8.92 | 0.05 | 8.42 | 0.06 | 8.35 | 0.04 | |||||
| NGC2214 | 06:12:58.5 | -68:15:35.4 | 9 | ABB | 20 | 11.00 | 0.01 | 10.34 | 0.01 | 10.14 | 0.01 |
| 40 | 9.93 | 0.01 | 9.30 | 0.01 | 9.08 | 0.01 | |||||
| 60 | 9.76 | 0.02 | 9.18 | 0.01 | 8.99 | 0.01 | |||||
| 80 | 9.52 | 0.02 | 8.95 | 0.02 | 8.77 | 0.02 | |||||
| 100 | 9.41 | 0.03 | 8.84 | 0.03 | 8.69 | 0.02 | |||||
| 120 | 9.32 | 0.04 | 8.77 | 0.03 | 8.61 | 0.03 | |||||
| 140 | 9.13 | 0.05 | 8.54 | 0.04 | 8.38 | 0.03 | |||||
| 160 | 8.96 | 0.06 | 8.33 | 0.04 | 8.18 | 0.04 | |||||
| 180 | 8.93 | 0.07 | 8.30 | 0.05 | 8.15 | 0.05 | |||||
| 184 | 8.92 | 0.07 | 8.29 | 0.05 | 8.14 | 0.05 | |||||
| LW431 | 06:13:27.2 | -70:41:42.0 | 2 | BBA | 20 | 11.97 | 0.01 | 11.15 | 0.01 | 10.92 | 0.01 |
| 40 | 11.66 | 0.02 | 10.94 | 0.02 | 10.78 | 0.02 | |||||
| 60 | 11.42 | 0.03 | 10.81 | 0.03 | 10.65 | 0.03 | |||||
| 80 | 11.22 | 0.04 | 10.75 | 0.04 | 10.51 | 0.04 | |||||
| 100 | 11.07 | 0.05 | 10.70 | 0.06 | 10.46 | 0.06 | |||||
| 120 | 10.92 | 0.06 | 10.65 | 0.08 | 10.35 | 0.07 | |||||
| 140 | 10.82 | 0.08 | 10.59 | 0.11 | 10.35 | 0.10 | |||||
| 160 | 10.77 | 0.10 | 10.55 | 0.13 | 10.31 | 0.12 | |||||
| 180 | 10.61 | 0.11 | 10.36 | 0.14 | 10.13 | 0.13 | |||||
| 200 | 10.57 | 0.13 | 10.36 | 0.18 | 10.07 | 0.16 | |||||
| HODGE11 | 06:14:22.5 | -69:50:46.1 | 7.5 | AAB | 20 | 12.33 | 0.02 | 12.03 | 0.02 | 11.37 | 0.02 |
| 40 | 11.03 | 0.02 | 10.54 | 0.02 | 10.31 | 0.02 | |||||
| 60 | 10.51 | 0.02 | 9.91 | 0.02 | 9.88 | 0.02 | |||||
| 80 | 10.28 | 0.03 | 9.70 | 0.03 | 9.71 | 0.03 | |||||
| 100 | 10.15 | 0.04 | 9.57 | 0.03 | 9.59 | 0.04 | |||||
| 120 | 10.01 | 0.05 | 9.45 | 0.04 | 9.50 | 0.05 | |||||
| 140 | 9.95 | 0.06 | 9.38 | 0.06 | 9.49 | 0.07 | |||||
| 160 | 9.84 | 0.07 | 9.29 | 0.07 | 9.44 | 0.09 | |||||
| 180 | 9.77 | 0.09 | 9.20 | 0.08 | 9.37 | 0.11 | |||||
| 196 | 9.74 | 0.10 | 9.13 | 0.09 | 9.33 | 0.12 | |||||
| NGC2231 | 06:20:42.4 | -67:31:04.5 | 8 | AAA | 20 | 11.86 | 0.01 | 10.90 | 0.01 | 10.54 | 0.01 |
| 40 | 11.40 | 0.02 | 10.56 | 0.01 | 10.24 | 0.01 | |||||
| 60 | 11.08 | 0.04 | 10.39 | 0.03 | 10.06 | 0.02 | |||||
| 80 | 10.90 | 0.05 | 10.28 | 0.04 | 9.97 | 0.03 | |||||
| 100 | 10.78 | 0.07 | 10.18 | 0.06 | 9.88 | 0.04 | |||||
| 120 | 10.72 | 0.10 | 10.09 | 0.07 | 9.83 | 0.06 | |||||
| 140 | 10.68 | 0.13 | 10.03 | 0.10 | 9.80 | 0.08 | |||||
| 160 | 10.63 | 0.17 | 10.00 | 0.12 | 9.74 | 0.10 | |||||
| 180 | 10.53 | 0.20 | 9.92 | 0.15 | 9.73 | 0.13 | |||||
| 200 | 10.47 | 0.23 | 9.87 | 0.17 | 9.67 | 0.15 | |||||
| NGC2249 | 06:25:49.6 | -68:55:06.5 | 6 | ABA | 20 | 12.79 | 0.02 | 12.60 | 0.03 | 12.37 | 0.03 |
| 40 | 11.78 | 0.03 | 11.56 | 0.04 | 11.07 | 0.03 | |||||
| 60 | 11.36 | 0.04 | 11.00 | 0.05 | 10.68 | 0.04 | |||||
| 80 | 11.01 | 0.05 | 10.54 | 0.06 | 10.20 | 0.05 | |||||
| 100 | 10.89 | 0.07 | 10.40 | 0.08 | 10.15 | 0.07 | |||||
| 120 | 10.83 | 0.10 | 10.31 | 0.10 | 10.11 | 0.09 | |||||
| 140 | 10.82 | 0.14 | 10.26 | 0.14 | 10.01 | 0.11 | |||||
| 160 | 10.77 | 0.17 | 10.18 | 0.17 | 9.97 | 0.15 | |||||
| 180 | 10.74 | 0.22 | 10.10 | 0.20 | 9.94 | 0.18 | |||||
| 200 | 10.63 | 0.25 | 10.09 | 0.25 | 9.93 | 0.23 | |||||
| NGC2257 | 06:30:12.8 | -64:19:36.4 | 6 | AAA | 20 | 13.06 | 0.02 | 12.65 | 0.02 | 12.70 | 0.03 |
| 40 | 11.68 | 0.02 | 11.27 | 0.02 | 11.19 | 0.02 | |||||
| 60 | 11.00 | 0.02 | 10.62 | 0.03 | 10.52 | 0.03 | |||||
| 80 | 10.58 | 0.03 | 10.17 | 0.03 | 10.07 | 0.03 | |||||
| 100 | 10.22 | 0.03 | 9.80 | 0.03 | 9.69 | 0.03 | |||||
| 120 | 10.09 | 0.04 | 9.64 | 0.04 | 9.54 | 0.04 | |||||
| 140 | 9.96 | 0.04 | 9.47 | 0.05 | 9.43 | 0.05 | |||||
| 160 | 9.78 | 0.05 | 9.24 | 0.05 | 9.22 | 0.05 | |||||
| 180 | 9.63 | 0.05 | 9.13 | 0.06 | 9.11 | 0.06 | |||||
| 200 | 9.56 | 0.06 | 9.07 | 0.07 | 8.98 | 0.07 |
| Filter ID or color | offset | mag | err | Persson et al. | |||||
|---|---|---|---|---|---|---|---|---|---|
| 30 | 348 | 159 | 18.5 | 10.53 | 0.02 | 10.95 | 0.03 | ||
| 1.14 | 0.03 | 1.07 | 0.05 | ||||||
| 0.39 | 0.03 | 0.27 | 0.05 | ||||||
| 60 | 353 | 152 | 13.0 | 9.54 | 0.01 | 9.58 | 0.02 | ||
| 1.07 | 0.02 | 1.17 | 0.02 | ||||||
| 0.38 | 0.01 | 0.37 | 0.03 | ||||||
| Filter ID or color | offset | mag | err | Persson et al. | |||||
|---|---|---|---|---|---|---|---|---|---|
| 30 | 461 | 457 | 17.5 | 10.04 | 0.02 | 10.02 | 0.03 | ||
| 1.68 | 0.03 | 1.81 | 0.02 | ||||||
| 0.67 | 0.03 | 0.70 | 0.03 | ||||||