11email: lexk@science.uva.nl; ameer@science.uva.nl 22institutetext: Instituto de Estructura de la Materia, CSIC, Serrano 121, 29006 Madrid, Spain
22email: najarro@damir.iem.csic.es
VLT/UVES spectroscopy of Wray 977, the hypergiant companion to the X-ray pulsar GX301$-$2††thanks: Based on observations obtained at the European Southern Observatory (57.D-0410,68.D-0568(A)) and with the Infared Space Observatory (ISO), a project of the European Space Agency (ESA) with the participation of ISAS and NASA.
Model atmosphere fits to high-resolution optical spectra of Wray~977 confirm the B hypergiant classification of the massive companion to the X-ray pulsar GX301$-$2. The models give a radius of 62 , an effective temperature of 18,100 K and a luminosity of . These values are somewhat reduced compared to the stellar parameters of Wray~977 measured previously. The deduced mass-loss rate and terminal velocity of the stellar wind are M☉ yr-1 and 305 km s-1, respectively. The interstellar D absorption indicates that Wray~977 is located behind the first intersection with the Sagittarius-Carina spiral arm (1-2.5 kpc) and probably belongs to the stellar population of the Norma spiral arm at a distance of kpc. The luminosity derived from the model atmosphere is consistent with this distance ( kpc). The luminosity of the wind-fed X-ray pulsar ( erg s-1) is in good accordance with the Bondi-Hoyle mass accretion rate. The spectra obtained with UVES on the Very Large Telescope (VLT) cover a full orbit of the system, including periastron passage, from which we derive the radial-velocity curve of the B hypergiant. The measured radial-velocity amplitude is km s-1 yielding a mass ratio . The absence of an X-ray eclipse results in a lower limit to the mass of Wray~977 of 39 M☉. An upper limit of 68 or 53 M☉ is derived for the mass of Wray~977 adopting a maximum neutron star mass of 3.2 or 2.5 M☉, respectively. The corresponding lower limit to the system inclination is , supporting the view that the dip in the X-ray lightcurve is due to absorption by the dense stellar wind of Wray~977 (Leahy 2002). The “spectroscopic” mass of Wray~977 is M☉, consistent with the range in mass derived from the binarity constraints. The mass of the neutron star is M☉. Time series of spectral lines formed in the dense stellar wind (e.g. 5876 Å and ) indicate the presence of a gas stream trailing the neutron star in its orbit. The long-term behaviour of the equivalent width exhibits strong variations in wind strength; the sampling of the data is insufficient to conclude whether a relation exists between wind mass-loss rate and pulsar spin period.
Key Words.:
Stars: binaries: close – Stars: evolution – Stars: individual: Wray 977 – Stars: pulsars: individual: GX301$-$2 – Stars: supergiants – X-rays: stars1 Introduction
Wray~977 (BP Cru) is the B-supergiant companion to the X-ray pulsar GX301$-$2. Comparison of the mass functions derived for high-mass X-ray binaries (HMXBs) harbouring an X-ray pulsar shows that Wray~977 is the most massive OB-star companion in these systems (Nagase 1989; Bildsten et al. 1997); HD153919, the O6.5 Iaf+ companion to 4U1700-37, may have a higher mass (, Clark et al. 2002), but 4U1700-37 has not been proven to be an X-ray pulsar (e.g. Hong & Hailey 2004). HMXBs are divided into two sub-groups: the Be/X-ray binaries (mainly X-ray transients) and OB-supergiant systems (of which Wray~977 is a member). The transient character of the Be/X-ray binaries relates to “outburst” phases of the Be-type companion, which occur at irregular intervals, separated by years to decades. During such an outburst phase the Be star ejects matter which forms an equatorial disc. The crossing of the compact companion through the Be-star’s equatorial disc leads to X-ray outbursts which recur with the orbital period. In OB-supergiant systems the X-ray source accretes from the strong stellar wind or is fed by Roche-lobe overflow (see Kaper 2001). In the latter case the much higher accretion rate results in an about 100 times higher X-ray luminosity ( erg s-1) and a short X-ray pulse period (seconds rather than minutes) in comparison to wind-fed systems.
The mass function derived from pulse-timing analysis indicates that the mass of Wray~977 is larger than 31.8 M☉ (Sato et al. 1986; Koh et al. 1997). Knowledge of the mass of Wray~977 is important, because this information is used to determine the empirical lower mass limit for black-hole formation in a massive binary (Van den Heuvel & Habets 1984; Ergma & van den Heuvel 1998; Wellstein & Langer 1999). The progenitor of GX301$-$2 was originally the most massive star in the system and left a neutron star (the X-ray pulsar) after the supernova explosion. The observed absence of X-ray eclipses sets an upper limit to the system’s inclination, given an estimate of the radius of Wray~977. The larger the radius, the lower the inclination, and the higher the lower limit to its (present) mass. Furthermore, the high mass of Wray~977 may result in the formation of a black-hole – neutron-star binary when Wray~977 ends its life as a supernova or a gamma-ray burst.
Based on a reclassification of its optical spectrum, Kaper et al. (1995) proposed that Wray~977 is a B1 Ia+ hypergiant rather than a normal B supergiant (Parkes et al. 1980). Since a hypergiant is larger and more luminous than a supergiant of the same spectral type, this results in a larger mass (48 M☉) and larger distance (5.3 kpc) of Wray~977 than thought before. In fact, the radius adopted in Kaper et al. (1995) () is larger than the Roche (and tidal) radius at periastron passage of this very eccentric () system. The interpretation of the pulse-period history (spin-up) of GX301$-$2 over the last decade (Pravdo et al. 1995) and a reconsideration of the parameters of the binary system (Koh et al. 1997) suggest that the distance, stellar radius and thereby the mass of Wray~977 are less than proposed in Kaper et al. (1995).
From the cyclical occurence of X-ray flares, Watson et al. (1982) determined the orbital period of the system ( d). It turns out that the periodic flare occurs just before periastron passage (d, White & Swank 1984; Sato et al. 1986; Chichkov et al. 1995). A similar X-ray lightcurve has been observed for 4U 1907+09 (in ’t Zand et al. 1998); in this system the massive companion star also is a luminous supergiant with a dense stellar wind (O8-O9 Ia, Cox et al. 2005b). Calculations by Stevens (1988) of the dynamical effects of the neutron star on the stellar wind showed that a highly increased mass-loss rate from the primary can be expected at periastron passage. This provided the physical basis for the suggestion by Haberl (1991) and Leahy (1991) that the observed pre-periastron X-ray flares are due to the enhanced accretion rate during the passage of the neutron star through a gas stream in the stellar wind. Pravdo et al. (1995) found that also near apastron passage a periodic X-ray flare occurs; the gas-stream model cannot explain the apastron flare very well. They propose that both the asymmetry of the pre-periastron flare and the presence of the near-apastron flare can be explained by an equatorially enhanced stellar wind or a circumstellar disc around Wray~977. The X-ray flares would occur when the X-ray source moves through the disc which is slightly inclined with respect to the orbital plane of the X-ray pulsar, as in the case of Be/X-ray binaries.
The rapid spin-up episodes of GX301$-$2 discovered by Koh et al. (1997) suggest the formation of temporary accretion discs. The long-term spin-up trend of the X-ray pulsar observed since 1984 might be entirely due to such brief spin-up episodes. Numerical simulations carried out by Layton et al. (1998) confirm that tidal stripping in eccentric-orbit X-ray binaries can produce periodic flares. However, the tidally stripped mass only accretes when the supergiant is close to corotation at periastron, and the resulting X-ray flare occurs well after periastron passage () and not at apastron. The calculations further show that a transient accretion disc forms when the neutron star accretes from the tidal stream and persists for roughly half the binary period. This produces an extended epoch (many days) of spin-up reminiscent of the spin-up episodes observed by Koh et al. (1997). Layton et al. (1998) remark that the X-ray flares are more likely to be due to enhanced accretion from an equatorial disc than to tidal stripping at periastion.
| Passband | Mag | (mag) | (cor) | ||
|---|---|---|---|---|---|
| (m) | (Jy) | () | (Jy) | ||
| U (1) | 0.365 | 13.01 | 0.012 | 9.18 | 55.23 |
| B (1) | 0.44 | 12.59 | 0.041 | 7.80 | 53.87 |
| V (2) | 0.55 | 10.83 | 0.177 | 5.89 | 40.26 |
| I (3) | 0.90 | 7.6 | 2.049 | 2.82 | 27.52 |
| J (4) | 1.25 | 6.83 | 2.817 | 1.66 | 13.00 |
| H (4) | 1.65 | 6.11 | 3.526 | 1.04 | 9.19 |
| K (4) | 2.2 | 5.72 | 3.194 | 0.63 | 5.71 |
| L (5) | 3.4 | 5.25 | 2.304 | 0.30 | 3.04 |
| LW2 (6) | 6.75 | 0.837 | 0.12 | 0.94 | |
| LW10 (6) | 11.5 | 0.517 | 0.16 | 0.60 | |
| PHT03 (6) | 25.0 | 0.089 | 0.08 | 0.10 |
The main motivation of this paper is to provide a better and quantitative estimate of the stellar parameters of Wray~977 based on model atmosphere fits to the optical line spectrum and the energy distribution. The mass ratio of the system is determined by measuring the radial-velocity orbit of Wray~977. Further, we monitored Wray~977 to search for the presence of a gas stream in the system. In the next section we describe the observations. Constraints on the distance and mass of Wray~977 are discussed in Sect. 3. In Sect. 4 we present the results of the spectrum modelling. In Sect. 5 we study the interaction between the X-ray pulsar and the stellar wind, search for the presence of a gas stream and show that the observed X-ray flux is consistent with that expected from Bondi-Hoyle accretion. In the last section we summarize the conclusions and discuss the implications of the derived stellar parameters for the nature and evolutionary status of this binary system.
2 Observations
The results presented in this paper are based on a variety of archival and recently obtained optical and infrared observations. Broad-band photometry is needed to construct the energy distribution of Wray~977. The Infrared Space Observatory (ISO) has detected Wray~977 at infrared wavelengths. The bound-free and free-free emission produced by the stellar wind in this wavelength region sets a constraint on the wind mass-loss rate, which is an important parameter in modelling the spectrum of Wray~977. High-resolution optical spectra are used to derive model-atmosphere parameters, to measure the radial-velocity curve and to search for the presence of a gas stream in the system.

2.1 Optical and near-infrared photometry
Table 1 lists the broad-band optical and near-infrared photometric parameters collected from literature. The resulting energy distribution of Wray~977 () is displayed in Fig. 1. For comparison, a Kurucz model with the same K, and (assuming ) is shown. A strong infrared excess with respect to the Kurucz model is apparent, caused by the free-free emission produced by the dense stellar wind.
The line of sight towards Wray~977 passes the edge of the Southern Coalsack, one of the most prominent dark nebulae in the southern Milky Way (e.g., Nyman et al. 1989) and continues through the Sagittarius-Carina spiral arm. The strong interstellar extinction makes the blue hypergiant appear red in the telescope. Kaper et al. (1995) adopted a colour excess of , based on the value listed in Van Dishoeck & Black (1989). Van Genderen & Sterken (1996) derive based on Walraven photometry and when fitting the energy distribution with a black-body with a temperature of K. The same value for the colour excess is obtained from Strömgren photometry. Van Genderen & Sterken (1996) have no explanation for these inconsistencies, but prefer the lower value of 1.65. In this paper we adopt , based on a comparison with model atmospheres (see Sect. 4).
2.2 ISO observations
Wray~977 is one of the targets in our ISO program on HMXBs to study the disrupted stellar wind and the accretion flow towards the X-ray source in these systems (Kaper et al. 1997). The infrared wavelength domain has proven to provide a valuable diagnostic in studying the stellar-wind structure of early-type stars (see Lamers & Waters 1984). Free-free and free-bound emission is produced in the inner part of the stellar wind where most of the acceleration takes place and can be modelled in a quite straightforward way.
ISO observations of Wray~977 were performed with ISOCAM’s broad-band filters LW2 and LW10 (centered at 6.75 and 11.5 m) and with ISOPHOT (25 m), see Table 1. The observations were obtained (at the three different wavelengths) in August 1996 and in July and August 1997, covering four orbital phases of the system. We used the ISOCAM (CIA) and ISOPHOT Interactive Analysis (PIA) packages and the supplied auto-analysis products to reduce the data. In Table 1 we give the (orbital) average of the background-subtracted flux values. The orbital variation in flux is at the 5-10 % level.
| MJD | Phase | ||||
|---|---|---|---|---|---|
| (deg) | (Å) | (s) | (km s-1) | ||
| CAT/CES May 1996 | |||||
| 50213.9917 | 0.0065 | 6562 | 1800 | ||
| 50214.0174 | 0.0071 | 6562 | 1800 | ||
| 50214.0535 | 0.0080 | 5876 | 2700 | ||
| 50214.1417 | 0.0101 | 4 | 5695 | 2700 | |
| 50214.2035 | 0.0116 | 6562 | 2700 | ||
| 50214.2590 | 0.0129 | 5876 | 2700 | ||
| 50214.9820 | 0.0304 | 6562 | 2700 | ||
| 50215.0222 | 0.0313 | 5876 | 2700 | ||
| 50215.0924 | 0.0330 | 6562 | 2700 | ||
| 50215.1181 | 0.0336 | 35 | 5695 | 2700 | |
| 50215.2632 | 0.0371 | 5876 | 2700 | ||
| 50215.9833 | 0.0545 | 6562 | 2700 | ||
| 50216.0201 | 0.0554 | 5876 | 2700 | ||
| 50216.1000 | 0.0573 | 56 | 5695 | 2700 | |
| 50216.1375 | 0.0582 | 6562 | 2700 | ||
| 50216.1931 | 0.0595 | 5876 | 2700 | ||
| 50216.2472 | 0.0609 | 6562 | 2700 | ||
| 50216.9903 | 0.0788 | 6562 | 2700 | ||
| 50217.0396 | 0.0799 | 5876 | 2700 | ||
| 50217.1285 | 0.0821 | 74 | 5695 | 2700 | |
| 50217.1680 | 0.0830 | 6562 | 2700 | ||
| 50217.2215 | 0.0843 | 5876 | 2700 | ||
| 50217.9791 | 0.1026 | 6562 | 2700 | ||
| 50218.0222 | 0.1036 | 5876 | 2700 | ||
| 50218.1028 | 0.1056 | 88 | 5695 | 2700 | |
| 50218.1423 | 0.1065 | 6562 | 2700 | ||
| 50218.1986 | 0.1079 | 5876 | 2700 | ||
| 50218.9812 | 0.1267 | 6562 | 2700 | ||
| 50219.0187 | 0.1276 | 5876 | 2700 | ||
| 50219.1000 | 0.1296 | 6562 | 2700 | ||
| 50219.1014 | 0.1296 | 100 | 5695 | 2700 | |
| 50219.2041 | 0.1321 | 5876 | 2700 | ||
| MJD | Phase | ||||
| (deg) | (Å) | (s) | (km s-1) | ||
| VLT/UVES January - February 2002 | |||||
| 52289.3692 | 0.0180 | 2 | DIC#1 | 1120 | |
| 52292.2937 | 0.0885 | 78 | DIC#1 | 1120 | |
| 52298.2532 | 0.2321 | 133 | DIC#1 | 1120 | |
| 52309.3431 | 0.4993 | 180 | DIC#1 | 1120 | |
| 52315.1934 | 0.6403 | 202 | DIC#1 | 1120 | |
| 52321.1829 | 0.7846 | 231 | DIC#1 | 1120 | |
| 52326.2084 | 0.9057 | 278 | DIC#1 | 1120 | |
| 52328.1649 | 0.9529 | 312 | DIC#1 | 1120 | |
| 52329.2378 | 0.9787 | 337 | DIC#1 | 1120 | |
| 52330.2073 | 1.0021 | 362 | DIC#1 | 1120 | |
| 52332.2167 | 1.0505 | 411 | DIC#1 | 1120 | |


2.3 High-resolution optical spectra
Optical spectra of Wray~977 were obtained with the 1.4m Coudé Auxiliary Telescope (CAT) and Coudé Echelle Spectrograph (CES) in May 1996 at the European Southern Observatory in La Silla and with the high-resolution Ultraviolet and Visual Echelle Spectrograph (UVES) on the Very Large Telescope (VLT) in January and February 2002 at ESO Paranal Observatory. The CAT/CES observations were obtained in coordination with simultaneous X-ray observations with the Rossi X-ray Timing Explorer (RXTE) satellite during periastron passage of GX301$-$2 (Mukherjee & Paul 2004). The VLT/UVES observations were carried out in service mode. The log of observations of the CAT/CES and VLT/UVES spectra is given in Table 2 and 3, respectively.
All spectra were bias subtracted, flatfield corrected, (optimally) extracted and wavelength calibrated using the MIDAS echelle (UVES) and long-slit (CES) data reduction packages. The resolving power of the spectra is . The signal-to-noise ratio of the CES spectra is typically . The quality of the UVES spectra improves as a function of wavelength, because of the strong interstellar extinction towards Wray~977: at 4050, 5100, 6250 Å, respectively. The single order CES spectra cover only Å. The wavelength regions covered by the UVES echelle spectra are 3570–4500 Å, 4625–5590 Å and 5675–6645 Å. The spectra were rectified using a spline fit through carefully selected continuum regions.
The UVES spectra are displayed in Figs. 2 - 4; labels show the line identifications. The blue spectrum (Fig. 2) covers the Balmer series from H up to (at least) at 3679 Å. The latter observation indicates a relatively low electron density and thus a low surface gravity; at higher electron densities Stark broadening will result in the merging of higher Balmer series lines into a quasi-continuum. A low surface gravity is expected in case of a super- or hypergiant. The stronger hydrogen and helium lines show a P Cygni-type profile, as expected for a dense stellar wind. Several metallic lines produced by e.g. , , , are detected in the blue part of the spectrum. The interstellar spectrum is very prominent: both atomic interstellar lines and strong diffuse interstellar bands (DIBs) are present (see Cox et al. 2005a).
The green to red spectrum (Figs. 3 - 4) contains fewer spectral lines, as expected for an early-type star. No lines other than 4686 Å are detected, indicating that Wray~977 has a spectral type later than O. Note the P-Cygni lines around 5100 Å and the broad emission near 5950 Å. Wolf & Stahl (1985) propose that the lines of multiplets 115 and 117 can be used to discriminate between normal B supergiants and B hypergiants (B Ia+). These lines originate from the same upper level at an energy of 20.87-20.89 eV above the ground level. This energy is very close to the energy of a forbidden line from the singlet to the triplet configuration at 20.97 eV. The resonance transition of is a bit further away (21.22 eV, 584.3 Å) and likely a very strong line. Wolf & Stahl (1985) suggest that the upper level of the observed emission lines is pumped by . With this explanation it can be understood that these lines are luminosity sensitive, since the proposed fluorescence excitation mechanism only works under non-LTE conditions. Thus, according to this diagnostic, Wray~977 would be a B hypergiant. The feature at 5900 Å is caused by a CCD defect.
3 Constraints on distance and mass of Wray~977
3.1 The interstellar D lines
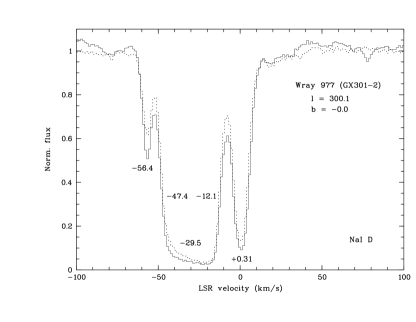
In principle, a lower limit to the distance of Wray~977 can be derived from a study of the (radial) velocity distribution of the interstellar material in the direction towards Wray~977 (; ). For this purpose we use the interstellar D lines (5889.950 Å, 5895.924 Å) shown in Fig. 5. The velocity scale is with respect to the local standard of rest (LSR, 16.6 km s-1 towards right ascension 17:49:58.7 and declination +28:07:04, epoch 2000.0).
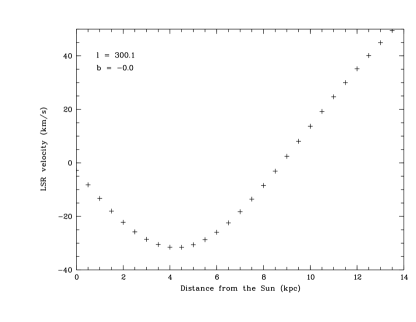
Three absorption components are detected in both transitions of the resonance doublet: one component centered at a velocity of km s-1, a broad component with a width of km s-1 at km s-1 and a narrow component at km s-1. Assuming circular galactic rotation and adopting the galactic rotation curve of Brand & Blitz (1993) with 8.5 kpc for the distance to the galactic center and a galactic rotation velocity of 220 km s-1 at the orbit of the Sun, the radial velocity along the line of sight towards Wray~977 due to the differential galactic rotation can be calculated as a function of distance (Fig. 5). In this direction the radial velocity with respect to the LSR reaches a minimum of km s-1 at a distance of about 4.5 kpc.
The line of sight in the direction of Wray~977 first passes the Southern Coalsack and intersects the Sagittarius-Carina spiral arm twice. The longitude-velocity diagram of CO emission integrated over latitude (Cohen et al. 1985) shows that the near intersection with the Sagittarius-Carina arm yields CO emission in the velocity range km s-1; the far intersection with the Sagittarius-Carina arm (outside the solar circle at a distance of at least 10 kpc) results in CO emission at positive LSR velocities (see also Crawford & Barlow (1991) for D observations). The absence of D absorption components at positive velocities indicates that Wray~977 must be located closer than the far intersection with the Sagittarius-Carina arm. The velocity range covered by the broad D absorption component centered at km s-1 is in very good agreement with the CO emission produced by the near intersection with the Sagittarius-Carina arm ( kpc). We note, however, that the galactic rotation curve predicts velocities in the range km s-1 at these distances. The more negative velocities observed in D absorption, especially the component at km s-1, are difficult to explain with this rotation curve. This is not very surprising as the radial velocity residuals between the observations and model predictions of Brand & Blitz (1993) in this direction are on the order of 10 km s-1.
Several studies of the spiral-arm structure in this area of the sky have led to the suggestion that at a distance of about 3-4 kpc another spiral arm is present, the Norma-Centaurus arm (Bok 1971; Chu-Kit 1973; Sembach et al. 1993). This arm would give rise to absorption in the velocity range km s-1. The Norma-Centaurus arm is well defined by the regions it contains (Courtès 1972), but is less readily distinguished in surveys (Kerr et al. 1986) and CO emission in this direction (Cohen et al. 1985; Dame et al. 1987). The lines of sight towards several stars in this direction:
| HD103779 | , | kpc |
|---|---|---|
| HD104683 | , | kpc |
| HD113012 | , | kpc |
| HD116852 | , | kpc |
yield remarkably similar D spectra as observed for Wray~977 (Sembach et al. 1993). All these spectra include, besides the components at 0 and km s-1, a narrow component around km s-1. Sembach & Savage (1996) interpret this component as being due to absorption in the Norma-Centaurus spiral arm.
Crawford & Barlow (1991) give an alternative explanation for this narrow component at km s-1. They derive an estimate of the distance to the WN8 star We 21 which is located in the same region on the sky as Wray~977 (;) using the method described above. They do detect D absorption at positive velocities in the spectrum of We 21 and conclude that We 21 must be located in the far part of the Sagittarius-Carina spiral arm. Crawford & Barlow (1991) show a figure of the interstellar D2 line observed towards HD111904, a member of the Cen OB1 association in the Sagittarius-Carina arm at a distance of 2.5 kpc (Humphreys 1978). This line of sight (;) has been discussed by Crawford (1992). Just like in the spectrum of Wray~977 the D (and K) lines towards HD111904 contain narrow and blue-shifted high-velocity components (at and km s-1). The relative galactic rotation velocity at this distance is km s-1, consistent with the LSR velocity of Cen OB1 (Humphreys 1972, km s-1), indicating that the gas forming these narrow components has a substantial blue-shifted velocity with respect to Cen OB1. Crawford (1992) argues that the narrow component at km s-1 originates in an expanding shell surrounding Cen OB1, which is swept up by the cumulative action of the stellar winds from the OB stars in the association. The low value observed for the / line ratio of this component supports this interpretation (Ca atoms are removed from grain surfaces by intermediate-velocity shocks). The origin of the component at km s-1 might be a diffuse interstellar cloud with a peculiar velocity of 5 km s-1.
| parameter | value |
|---|---|
| (days) | |
| (lt-s) | |
| (deg) | |
| (M☉) | |
| Time of periastron passage (MJD) |
The narrow D absorption component in the spectrum of Wray~977 centered at km s-1 might as well be due to the expanding shell around Cen OB1. More speculative, (part of) the narrow component at km s-1 could be formed by the receding part of the expanding shell: the median velocity of the two narrow absorption components is km s-1, not much different from the LSR velocity of Cen OB1. Alternatively, this low-velocity absorption could be due to the nearby Southern Coalsack ( pc, Franco 1989).


On the basis of the D interstellar lines we come to the conclusion that the distance to Wray~977 is at least 2.5 kpc, i.e. beyond the near intersection with the Sagittarius-Carina arm. The large colour excess, the strong D absorption (e.g. the members of the OB association Cen OB1 in the Carina arm at a distance of 2.5 kpc have a much smaller colour excess (Humphreys 1978) and also their D absorption is much weaker) and the D component at km s-1 suggest that Wray~977 is located in (or behind) the Norma-Centaurus arm, which has a distance of kpc. The distance estimates of 5.3 kpc proposed in Kaper et al. (1995) and 7.7 kpc in Van Genderen & Sterken (1996) most likely overestimate the true distance to Wray~977.
| Line | ||||
|---|---|---|---|---|
| (Å) | (km s-1) | (km s-1) | ||
| 4366.89 | 35.6 | |||
| 4661.63 | 105.1 | |||
| 4813.33 | 9.8 | |||
| 4819.72 | 26.5 | |||
| 4828.96 | 27.1 | |||
| 5686.21 | 135.5 | |||
| 5696.60 | 291.8 | |||
| 5722.73 | 119.7 | |||
| 5739.73 | 377.3 |
3.2 Radial-velocity curve of Wray~977
A constraint on the mass of the two binary components is obtained from the radial-velocity curve of Wray~977. Hutchings et al. (1982) measured radial velocities for Wray~977 and arrived at a radial-velocity amplitude km s-1 and a -velocity of km s-1 for a (then not confirmed) orbital period of 41.37d and using photospheric lines111Hutchings et al. (1982) report a systematic dependence of the derived radial velocity on hour angle for which they correct; however, in the update following their paper to comment on the newly derived orbital period they do not find an hour-angle effect..
We measured the radial velocity of Wray~977 from the photospheric lines included in the CES and UVES spectra by fitting gaussians to the spectral line profiles. The radial velocity listed in Tables 2 and 3 is the mean radial velocity per spectrum; the error corresponds to the standard deviation. In the CES spectra four lines (at 5666.63, 5676.02, 5679.56 and 5686.21 Å) were fit with a gaussian to measure the radial velocity (Table 2). As only a very narrow orbital phase interval was covered (periastron passage), it is not possible to derive , and from this dataset. The observed trend in is, however, consistent with the radial velocity curve obtained from the UVES spectra (Table 3). In the UVES spectra nine lines were measured (Table 5). A radial-velocity curve is obtained for each individual line; we selected only weak photospheric lines that are not disturbed by variations in the stellar wind (see Sect. 5). As an example Fig. 6 shows the results obtained for the line at 4813.33 Å, for which we obtained the best fit. Subsequently, the radial-velocity curves were fit by a model based on the orbital parameters of the X-ray pulsar (Table 4), with the radial-velocity amplitude , the -velocity and a phase shift as free parameters (Table 5). The high values for indicate that the errors on the individual radial-velocity measurements are much smaller than the measured deviations from the best-fit Keplerian orbit.
These radial-velocity excursions are systematic (i.e. similar for each line in a given spectrum) and are also observed in other eccentric HMXBs, e.g. Vela~X$-$1 (Van Kerkwijk et al. 1995; Barziv et al. 2001). A possible physical origin of these radial-velocity excursions are tidally forced non-radial oscillations in the OB companion. Quaintrell et al. (2003) find evidence for a 2.18 d periodicity in the residuals of the Keplerian fit to the 8.96 d orbit, and use this to obtain a more accurate determination of . A similar effect may be underlying the radial-velocity curve of Wray~977, but we have too few points to measure it, if present. Van Genderen & Sterken (1996) report a 11.90 d quasi-period in photometry of Wray~977, as for Vela~X$-$1 about 1/4th of the orbital period. Having said this, inspection of Table 5 shows that the measured radial-velocity amplitude is about the same for each line. We conservatively adopt km s-1. For a more detailed description of the used method we refer to Van der Meer (2006); Van der Meer et al. (2006).
With the measured radial-velocity amplitude of Wray~977 and the orbit of the X-ray pulsar (Table 4) the mass ratio of the system is determined:
| (1) |
The mass function based on the X-ray pulsar’s orbit is:
| (2) |
Note that Koh et al. (1997) quote a mass function of 31.8 M☉, but this value is based on the ephemeris of Sato et al. (1986). Using the values listed in Table 4 one obtains 31.1 M☉ (see also Bildsten et al. 1997). For the conservative range of km s-1 we get . The absence of an X-ray eclipse (but see Sect. 5) provides an upper limit to the inclination of the system’s orbit:
| (3) |
with the radius of Wray~977 (in ). This parameter is difficult to determine; in Sect. 4 we use model-atmosphere fits to the optical spectrum to derive a measure of the stellar radius ( R☉). Clearly, should not become bigger than the distance to the X-ray pulsar at periastron passage. Also, we will consider whether Wray~977 fits into its “Roche-lobe”, even though this constraint is not valid in this eccentric system. The Roche-lobe radius is smaller than the so-called tidal radius ; for a definition, see, e.g., Joss & Rappaport (1984). We will show that the derived radius of Wray~977 is of the order of (and probably even larger than) and at periastron passage. In the following analysis we leave as a free parameter.
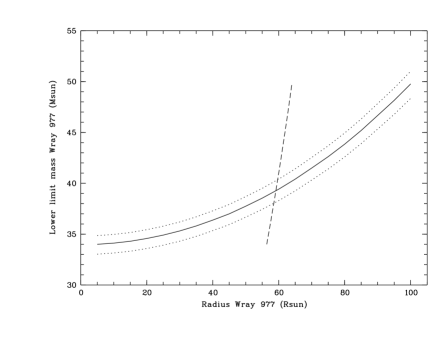
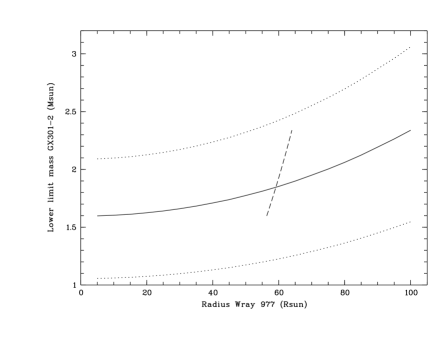
From the above we can set lower limits to the masses of Wray~977 and GX301$-$2 and investigate how these depend on (Fig. 7). The figures show three lines, each for a different value of the radial velocity amplitude: the best value is km s-1 (drawn line, ); the dotted lines correspond to and . From Fig. 7 we conclude that the mass of Wray~977 is higher than M☉. Given a radius of 62 R☉, the lower limit on the mass becomes M☉. The corresponding upper limit on the inclination is 72 degrees. Note that the mass of Wray~977 is inversely proportional to ; e.g. for Mopt would become 272 M☉.
Fig. 7 indicates that the lower limit on the mass of the neutron star is 1.6 M☉ if is 10 km s-1. The uncertainty on the neutron-star mass is large, as can be seen from the figure. For R☉ the lower limit on the mass of GX301$-$2 is M☉.
| Lower limit | Upper limit Mopt | |
|---|---|---|
| M M☉ | (M☉) | |
| 0.032 | 43.7 (48.6) | 100 (78) |
| 0.046 | 52.5 (59.4) | 68 (53) |
| 0.060 | 60.2 (70.4) | 53 (42) |
The neutron star cannot be more massive than 3.2 M☉, a limit set by general relativity (Nauenberg & Chapline 1973; Rhoades & Ruffini 1974; Kalogera & Baym 1996). It is likely that the maximum neutron star mass is determined by the stiffness of the equation of state of matter at supra-nuclear density. Then the maximum mass would be about 2.5 M☉ (for a detailed discussion on the maximum neutron-star mass see Srinivasan 2002). The currently most massive X-ray pulsar is Vela X-1 with a mass of M☉ (Barziv et al. 2001; Quaintrell et al. 2003). With an upper limit to the neutron-star mass we can set a lower limit to the system inclination. This implies an upper limit to the mass of Wray~977 (Table 6).
Thus, for a radius of 62 R☉ and a mass ratio the mass of Wray~977 is in the range M☉ (in brackets the mass for a maximum neutron star mass of 2.5 M☉). Also, with high probability the inclination of the system deg. This conclusion is consistent with the observed X-ray lightcurve (Sect. 5).
4 Spectrum modelling
Several sophisticated, non-LTE atmospheric codes have been developed to model the energy distribution and detailed spectral line profiles of hot, luminous stars (e.g., Pauldrach et al. 2001; Puls et al. 2005; de Koter et al. 1993; Mokiem et al. 2005; Aufdenberg et al. 2002). We have utilised the iterative, non-LTE line blanketing method of Hillier & Miller (1998) to perform our quantitative spectral analysis. The code solves the radiative transfer equation in the co-moving frame for the expanding atmospheres of early-type stars in spherical geometry, subject to the constraints of statistical and radiative equilibrium. Steady state is assumed and the density structure is set by the stellar-wind mass-loss rate and velocity field via the continuity equation. The velocity field consists of a pseudo-hydrostatic photosphere in the inner region characterised by the gravity () of the star with a smooth transition to the supersonic wind region. The latter is parameterised in terms of a wind velocity law (“ law”) and allows for the possibility to define two different values to account for a second accelerating zone. Clumping of the stellar wind is included via a clumping law characterised by a volume filling factor , so that the “smooth” mass-loss rate, , is related to the “clumped” mass-loss rate, , through . The model is then prescribed by the stellar radius , the stellar surface gravity , the stellar luminosity , the mass-loss rate , the velocity field , the volume filling factor and the abundances of the considered chemical elements. The reader is referred to Hillier & Miller (1998, 1999) for a detailed discussion of the code.
| Magnitudes and colour | |
|---|---|
| 10.83 | |
| (kpc) | |
| Model parameters | |
| 5.67 | |
| 2.38 | |
| 62 | |
| 70 | |
| (K) | 19.1 |
| (K) | 18.1 |
| 43 | |
| (km s-1) | 4.40 |
| (km s-1) | 50 |
| (M☉ yr-1) | |
| (km s-1) | 305 |
| 1.75 | |
| 1.0 | |
| 0.32 | |
4.1 Stellar parameters
Given the uncertainty in the distance to Wray 977 discussed in Sect. 3, we adopted a fixed value for the radius of the star. We set , which corresponds to a distance of 3 kpc (see the discussion below). The main stellar parameters and chemical abundances of our best-fitting model are summarised in Tables 7 and 8. Figure 8 illustrates the excellent agreement of our model with some of the most important diagnostic lines.

The parameters and in Table 7 refer to the stellar radius at which the Rosseland optical depth reaches a value of , while the stellar effective temperature is obtained at an optical depth of 2/3 (). From Table 7 we see that km s-1, so basically no information can be obtained from the hydrostatic region (i.e. ) as the stellar wind has already set in at this depth. Even the deeper forming wings of the higher members of the Balmer series are dominated by the run of the density structure within the transition region from the sub- to the supersonic atmosphere and react only minorly to changes in as high as 0.25 dex. The really extended nature of the object given by the ratio clearly confirms its previous classification as a hypergiant (Kaper et al. 1995).
The effective temperature of the object is very well constrained by the / and / ionisation balance. The presence of diagnostic lines of all three ionisation stages of silicon allows to reach an accuracy of better than 500 K. Some other transitions of species such as , , and , which react strongly to changes in temperature (luminosity) in this parameter domain, also show excellent agreement with K determined from the silicon ionisation.
The stellar wind parameters also confirm the hypergiant nature of Wray~977, with typical wind density and performance number well below (factor 5 and 1.6, respectively) that of luminous blue variables (LBVs) such as P Cygni (Najarro et al. (1997), Najarro & Hillier 2006, in prep.). Finally, we note that the observed spectra of Wray~977 do not show clear evidence of clumping, as the electron scattering wings of the Balmer lines are fairly well reproduced by a smooth wind model. Further, the resulting spectra of our exploratory models including clumping showed severe discrepancies with the high Balmer series members and other lines formed in the inner atmosphere.
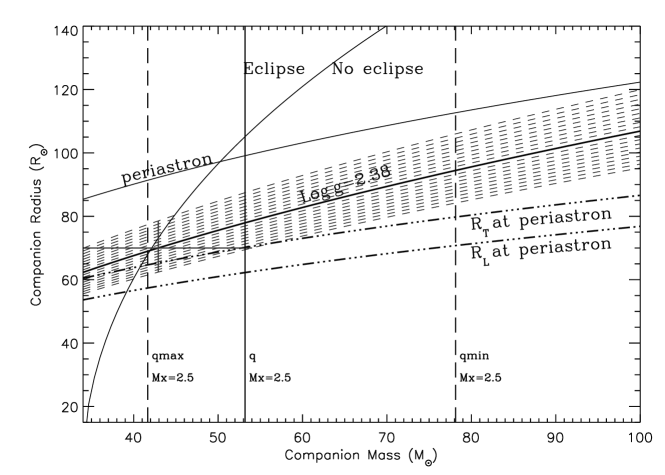
Subsequently, we may use the derived stellar parameters together with the information on the distance, radial-velocity curve and orbital parameters of the system (Sect. 3) to place some harder limits on the radius and distance of the star. Figure 9 displays the allowed domain for the mass of Wray~977 as a function of stellar radius (similar to Fig. 10 in Koh et al. 1997). The constraints are provided by the absence of X-ray eclipse and the distance between the star and the X-ray pulsar at periastron passage (i.e., the stellar radius should not be larger than the periastron distance). The tidal-lobe radius and Roche-lobe radius provide limits above which tidal and Roche-lobe interaction would occur, though the latter should be regarded with caution as the system is highly eccentric. Vertical lines provide limits on the mass of Wray~977 when taking into account the allowed range of the mass ratio (Sect. 3.2) and the maximum neutron-star mass (here we adopt a maximum mass of 2.5 M☉). For our best model () the tidal interaction limit requires that M M☉ (). However, tidal interaction would start about 1.5 days before periastron passage (which roughly corresponds to the timing of the X-ray flare, see Sect. 5) with a duration of 3 days if M M☉ ().
On the other hand, if we require a lower limit on the distance of 2.5 kpc (see Sect. 3.1), then and M M☉ (). With this would correspond to a neutron-star mass M☉ and Wray~977 would remain within its tidal lobe throughout the orbit, i.e. no tidal interaction would occur. The main drawback is the relatively high value of which is almost 0.2 dex above the expected value for a hypergiant. If we assume that the distance to the system is at least 3.5 kpc, then the resulting stellar radius would be larger than 81 and M M☉ (). For we would then have M M☉. While these values are appropriate for a hypergiant, it would exceed its tidal lobe during 5.6 days (7 % of the orbit) starting 2.8 days before periastron passage. Requiring no tidal interaction would imply that M M☉ (), which would be at odds with both the spectral type and the maximum value (0.065) corresponding to a neutron star mass of 2.5 .
The values of the stellar parameters of Wray~977 quoted in Wellstein & Langer (1999), K and R☉, are compatible with our currently preferred values: K, R☉. The corresponding luminosity of Wray~977, adopting a distance of 3.0 kpc, is in good agreement with the evolutionary track predicted by Wellstein & Langer (1999). If one would require that the radius of Wray~977 is smaller than the tidal radius throughout the orbit, should be at least 53 M☉, implying a high neutron-star mass: M☉ for . If one would allow Wray~977 to exceed its tidal lobe during periastron passage, may become less. Therefore, we conclude that the mass interval derived for Wray~977 in Sect. 3.2: M☉ is in accordance with our model atmosphere results (and a not too high neutron-star mass), noting that tidal interaction is expected during periastron passage (see Sect. 5).
| Species | X/He | Mass | |
|---|---|---|---|
| (number) | fraction | ||
| H | |||
| He | |||
| C | |||
| N | |||
| O | |||
| Mg | |||
| Al | |||
| Si | |||
| S | |||
| Fe |
4.2 Photospheric abundances
Table 8 lists the chemical abundances obtained from our best-fitting model. The derived H/He ratio (3.5 by number) is consistent with the enrichment displayed in B hypergiants and is very close to the characteristic value of LBVs (Najarro et al. (1997), Najarro & Hillier 2006, in prep.). From our analysis, the observed ratio of H to lines confines the He abundance in the range (by number).
Apart from CNO elements, the derived surface abundances are fully consistent with solar metallicity. Our models show a nitrogen enrichment of roughly 5 times over solar and an oxygen depletion of 2.5 times below solar. These values are fairly robust, as the number of diagnostic lines for both elements is relatively large and display excellent internal agreement. These two values should be regarded with an accuracy better than a factor of two. For carbon we obtain an enhancement twice over solar. Unfortunately, only two lines are available for abundance analysis (4267 Å and the doublet 6578–82 Å) and both react very strongly to the density structure within the sub- to supersonic transition region. Thus the uncertainty on the carbon abundance can be regarded as high as at least a factor 2. The derived nitrogen enhancement and oxygen depletion agree very well with the surface abundances predicted by Model nr. 8 of Wellstein & Langer (1999). Their conservative binary evolution model for Wray~977 predicts a nitrogen enrichment by a factor of 5.5 and an oxygen depletion by a factor 0.75. Also carbon should be depleted by a factor 0.33, which is not indicated by our spectral analysis. In a fully non-conservative binary evolution history (i.e., mass has not been transferred from the primary to the secondary, but has been lost from the system) the chemical surface abundances of Wray~977 should not have been affected.
4.3 Projected rotational velocity
The projected rotational velocity of Wray~977 derived from the spectral line fits is km s-1. This corresponds to a maximum rotation period of Wray~977 of 63 days, given a radius of 62 . Simulations of tidal mass transfer in a system like Wray~977 by Layton et al. (1998) show that if the primary star is rotating near corotation with the orbiting compact object at periastron, tidally stripped gas can accrete and cause X-ray flares. The measured value of indicates that this condition can only be met if the inclination of the system . We can exclude corotation at periastron passage as at such a low value of the orbital inclination the mass of the neutron star exceeds the causality limit by far (Sect. 3.2).

5 Interaction between the dense stellar wind of Wray~977 and GX301$-$2
The X-ray lightcurve of GX301$-$2 includes a strong flare about 1-2 days before periastron passage; Fig. 10 shows the X-ray lightcurve of GX301$-$2 obtained with the All Sky Monitor onboard the Rossi X-ray Timing Explorer (RXTE). When folding the X-ray lightcurve with the orbital period of the system, a second, though much weaker flare appears to be present near apastron passage; this near-apastron flare is not always detectable (Pravdo & Ghosh 2001). Several stellar wind accretion models have been proposed to explain the magnitude of the flares and their orbital phase dependence (Leahy 1991; Haberl 1991). The large eccentricity of the orbit and Bondi-Hoyle accretion naturally lead to a higher X-ray flux at periastron passage; an azimuthal velocity component is sufficient to shift the phase of the main flare (Leahy 2002).
It is, however, not straightforward to explain the increase in X-ray flux at apastron passage. A dense, slowly expanding disc around Wray~977 was postulated by Pravdo et al. (1995) to produce an increase in X-ray flux twice per orbit, i.e. when the neutron star passes through the disc, similar to what is observed in some Be/X-ray binaries. It turns out that the wind plus disc model neither provides an acceptable fit to the X-ray lightcurve (Pravdo & Ghosh 2001; Leahy 2002). When a gas stream is introduced in the system, e.g. resulting from tidal interaction (Layton et al. 1998), a better fit is obtained (Leahy 2002). The gas stream flows out from the point on the primary facing the neutron star (Stevens 1988) and has a geometry such that it is crossed twice by the neutron star per orbit, consistent with a dynamical stream calculation (Leahy 2002).
The X-ray spectrum of GX301$-$2 also provides evidence for the presence of a gas stream in the system (Saraswat et al. 1996). Part of the low-energy excess below 4 keV detected by the Advanced Satellite for Cosmology and Astrophysics (ASCA) can be modelled as due to scattering of X-rays in the dense stellar wind of Wray~977. The ultrasoft emission, however, requires an additional component in the system and is fitted well by thermal emission from a hot plasma with keV. This emission may arise from X-ray induced shocks in the gas trailing the neutron star.
5.1 Orbital modulation of spectral lines formed in the stellar wind
The observations described above indicate the presence of a gas stream in the system. If the material in the gas stream is dense and extended enough, it should produce a signature in spectral lines formed in the stellar wind of Wray~977. In May 1996 we monitored the 5876 Å and line of Wray~977 during a periastron passage of the system, simultaneously with RXTE observations (Mukherjee & Paul 2004). In 2002 we covered the optical spectrum of Wray~977 with VLT/UVES during one full orbit of the system.
5.1.1 Periastron passage in May 1996
Mukherjee & Paul (2004) report on archival RXTE observations of GX301$-$2 using the large-area proportional counter array (PCA), obtained in the period May 10 to June 15, 1996. Though the total X-ray luminosity is much higher in the pre-periastron phase, they do not detect a remarkable change in the intrinsic continuum spectrum. A considerable increase in column density occurs near periastron passage, from cm-2 at to cm-2 at . Similar high values of are measured at other orbital phases; e.g. near , i.e. when the X-ray source is “behind” Wray~977. Mukherjee & Paul (2004) interpret the large scatter c.q. variation in as being due to the clumpiness of the stellar wind. Additional clumping of the wind near periastron passage may be due to the extra ionisation of the wind by the X-ray source. The optical spectrum of Wray~977 does, however, not show evidence for clumping (Sect. 4.1).
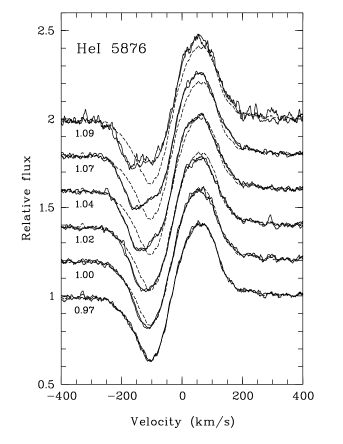
We obtained high-resolution spectra of the wind lines 5876 Å and of Wray~977 from May 10–16, 1996, i.e. during the periastron passage covered by Mukherjee & Paul (2004). Fig. 11 displays a time series of these two lines; for comparison, the average of the first two spectra obtained around is shown as a dashed line. An additional blue-shifted absorption component (central velocity km s-1) appears near periastron passage () and moves to higher velocity with increasing orbital phase. A similar trend is observed in . If the orbital modulation of these wind lines is due to a gas stream in the system, this stream must cover a significant fraction of the surface of Wray~977 and trail the X-ray source in its orbit, see Fig. 13.
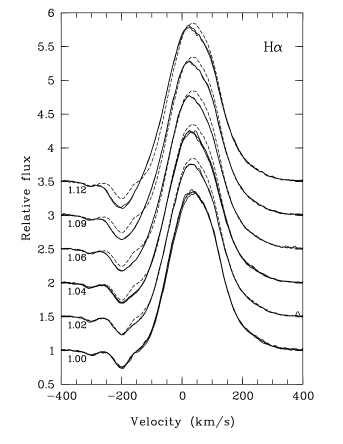
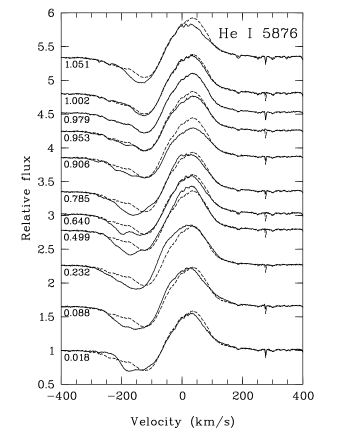
5.1.2 Monitoring of a full orbit in 2002
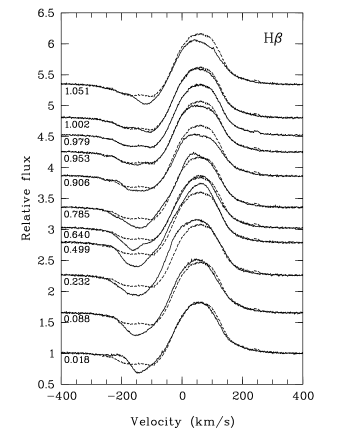
One would like to know the extent of this gas stream in the system; as the sightline to Wray~977 probes through the system during one revolution, this question can be addressed. Our VLT/UVES spectra cover one full orbit of the system in the period January – February 2002. Fig. 12 displays a time series of 5876 Å and ; also here the spectrum obtained at is shown as a dashed line for comparison. The P Cygni profiles of 5876 Å and are of comparable strength and show similar variations as observed in May 1996 (Fig. 11). However, the increase in blue-shifted absorption (with respect to the spectrum) is also seen at other orbital phases, though with different strength and velocity structure. This suggests that the gas stream in the system has a large extent, both in the orbital plane and in the direction perpendicular to it. The disappearance of the blue-shifted absorption feature near periastron passage may be due to the reduction in optical depth of the material contained in the gas stream when it expands and moves away from the star and, on the other hand, the relatively small extent of the gas stream near periastron where it leaves the star.
Variations also occur in the emission part of the profile. Contrary to the changes observed in the blue-shifted absorption part of the profile, the material causing these variations is not limited to the line of sight to Wray~977. Between and additional blue-shifted emission is observed (Fig. 12); around an overall reduction in emission is detected. Near periastron passage the emission has gained in strength again. Qualitatively, the variations in line emission are consistent with the variations observed in absorption and support the conclusion that an extended structure (gas stream) is present in the system that trails the neutron star in its orbit (Fig. 13). The observations do not reveal a clue regarding the observed peaks in X-ray luminosity near peri- and apastron passage, i.e. that these peaks would be due to the passing of the neutron star through a gas stream at these locations in the orbit (Leahy 2002). On the other hand, the observations do not exclude this scenario either and provide the first direct indication for the presence of a gas stream in the system.
5.2 X-ray lightcurve and X-ray pulse period history of GX301$-$2
Fig. 10 displays the RXTE/ASM X-ray lightcurve of GX301$-$2 folded with the orbital period of the system, as a function of mean and true anomaly. The data points shown are collected over a period of about 9 years (1996–2005) in the energy range 1.5–12 keV; we refer to Leahy (2002) for an earlier version of the RXTE/ASM lightcurve. The predicted Bondi-Hoyle X-ray luminosity based on the stellar wind and orbital parameters derived in Sect. 4 can explain the peak near periastron passage because of the eccentricity of the orbit, but this simple model does not reproduce the lightcurve in between the peaks. The reduction in X-ray flux following periastron passage () is likely due to the absorption of (soft) X-rays by the dense stellar wind of Wray~977 (Fig. 13), especially when one takes into account the constraints derived on the orbital inclination listed in Table 6.

Adopting a distance of 3 kpc, the maximum and mean X-ray flux of GX301$-$2 (Chichkov et al. 1995) yield a maximum and mean X-ray luminosity of erg s-1 and erg s-1. These values are in good agreement with the predicted X-ray luminosity based on accretion of the dense hypergiant wind; accretion from a normal supergiant wind cannot produce the observed X-ray flux (White 1985; Kaper 1998).
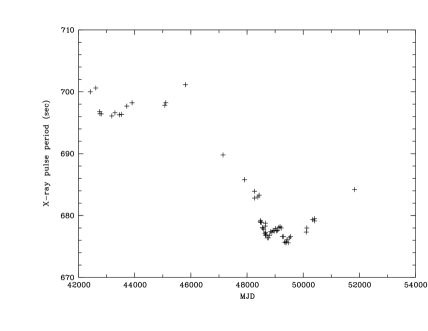
Not only mass, but also angular momentum is transferred to the X-ray pulsar. The X-ray pulse period history contains information on the angular momentum content of the accreting material as a function of time. Fig. 14 shows the pulse period of GX301$-$2 as a function of time (Nagase 1989; Koh et al. 1997; Pravdo & Ghosh 2001; Kreykenbohm et al. 2004). In 1984 a long-term spin-up phase started, possibly due to the formation of an accretion disc. According to Koh et al. (1997) the rapid spin-up episodes measured since 1991, when the X-ray pulsar reached a spin period of 675 sec, probably represent the formation of transient accretion discs. The most recent measurements of the X-ray pulse period suggest that the spin period is increasing again.
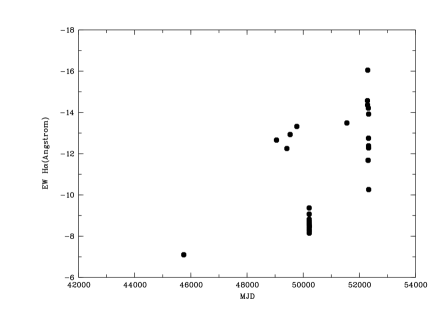
Although Pravdo & Ghosh (2001) found some evidence that the average 20–50 keV X-ray intensity may be correlated with the pulse period, it is interesting to find out whether the long-term trends seen in the X-ray pulse period history may be due to a change in the mass accretion rate in this wind-fed system. Fig. 14 shows the behaviour of the equivalent width (EW) which has been measured at irregular intervals since 1984 (Kaper et al. 1995, and this paper). is a sensitive probe of the wind mass-loss rate (e.g., Puls et al. 1996); the more negative the EW, the stronger the emission and the higher the wind mass-loss rate. The EW shows strong variations, even on the relatively short timescale of the orbit of the system covered by our VLT/UVES observations. On average, the wind mass-loss rate as reflected by the EW has increased compared to the one observation we have in February 1984 (Kaper et al. 1995). However, the data are not in contradiction with the simple scenario that the spin-up and spin-down periods are caused by a change in the overall wind mass-loss rate and thus a change in the mass and angular momentum accretion rate.
6 Summary and conclusions
New optical spectra and infrared photometry strongly support the B hypergiant classification of Wray~977 as proposed by Kaper et al. (1995), even though the radius, distance and luminosity of Wray~977 are somewhat reduced compared to the values listed in that paper: , kpc and . The radial-velocity curve, though hampered by the intrinsic scatter of individual measurements, clearly shows the orbital motion of Wray~977 from which the radial-velocity amplitude is derived. Combined with the accurately determined orbital parameters of the X-ray pulsar, the mass ratio is set to . The parameter missing to calculate the masses of the two stars is the orbital inclination. The system is not eclipsing, though the X-ray light curve shows a reduction in X-ray flux during the orbital phase interval when the X-ray source is behind the B hypergiant. That the orbital inclination indeed cannot be very low follows from the argument that the mass of the neutron star must be less than 3.2 M☉ (causality limit) and likely even less than 2.5 M☉ (maximum neutron star mass based on equation of state). As a consequence, the mass of Wray~977 is less than 68 (53) M☉ and higher than 39 M☉ (no X-ray eclipse). The lower limit on the mass of the neutron star is M☉, suggesting that the neutron star belongs to the high-mass peak in the bimodal neutron-star mass distribution as proposed by Timmes et al. (1996), like Vela X-1 (Barziv et al. 2001) and probably 4U1700-37 (Clark et al. 2002).
Van den Heuvel & Habets (1984) propose that the system evolved from a 42+38 M☉ binary, the lowest-mass realistic progenitor system fulfilling the condition that tandem evolution is avoided in a case B scenario. Wellstein & Langer (1999) propose that the system evolved in a case A scenario, leading to a progenitor system of initially 25+24 M☉. The phase of mass transfer has to be fully conservative in order to reproduce the current mass of Wray~977 and its position in the Hertzsprung-Russell diagram. The surface chemical abundances of Wray~977 derived from our spectra agree with the predictions of Wellstein & Langer (1999). Therefore, the progenitor mass of the neutron star may indeed be as low as 25 M☉, rather than the 50 M☉ proposed by Kaper et al. (1995). As a consequence, the lower limit for black-hole formation in a massive binary, derived from this system, becomes 25 M☉.
The orbital modulation of spectral lines formed in the stellar wind of Wray~977, such as and 5876 Å, indicate the presence of a gas stream in the system. Such a gas stream was proposed to explain the peaks in the X-ray light curve near apastron and periastron. We find no observational evidence for an extended equatorial disc surrounding Wray~977. The B hypergiant is not in corotation with the X-ray pulsar during periastron passage, which may be a complicating factor for models explaining the presence of a gas stream in the system originating from tidal interaction (Layton et al. 1998). However, it may well be that Wray~977 exceeds its tidal lobe during periastron passage, enabling the formation of a gas stream in the system. The decrease in X-ray pulse period of GX301$-$2 from 1984 to 1991 may be due to an increase in the mass and angular momentum accretion rate related to a higher wind mass-loss rate of Wray~977.
Acknowledgements.
We thank Paul Crowther and Mike Barlow for their help in interpreting the interstellar spectrum in this line of sight. Marten van Kerkwijk and Ed van den Heuvel are acknowledged for helpful discussions. We thank John Hillier for providing his atmospheric code. We thank an anonymous referee for carefully reading the manuscript. LK has been supported by a fellowship from the Royal Academy of Arts and Sciences. AvdM acknowledges financial support from the Dutch Research School for Astronomy (NOVA). FN received support from PNAYA2003-02785-E and AYA2004-08271-C02-02 and the Ramon y Cajal program.References
- Aufdenberg et al. (2002) Aufdenberg, J. P., Hauschildt, P. H., Baron, E., et al. 2002, ApJ, 570, 344
- Barziv et al. (2001) Barziv, O., Kaper, L., Van Kerkwijk, M. H., Telting, J. H., & Van Paradijs, J. 2001, A&A, 377, 925
- Bildsten et al. (1997) Bildsten, L., Chakrabarty, D., Chiu, J., et al. 1997, ApJS, 113, 367
- Bok (1971) Bok, B. J. 1971, BAAS, 3, 18
- Bord et al. (1976) Bord, D. J., Mook, D. E., Petro, L., & Hiltner, W. A. 1976, ApJ, 203, 689
- Brand & Blitz (1993) Brand, J. & Blitz, L. 1993, A&A, 275, 67
- Chichkov et al. (1995) Chichkov, M. A., Syunyaev, R. A., Lapshov, I. Y., et al. 1995, Astronomy Letters, 21, 435
- Chu-Kit (1973) Chu-Kit, M. 1973, A&A, 22, 69
- Clark et al. (2002) Clark, J. S., Goodwin, S. P., Crowther, P. A., et al. 2002, A&A, 392, 909
- Coe et al. (1997) Coe, M. J., Buckley, D. A. H., Fabregat, J., et al. 1997, A&AS, 126, 237
- Cohen et al. (1985) Cohen, R. S., Grabelsky, D. A., May, J., et al. 1985, ApJ, 290, L15
- Courtès (1972) Courtès, G. 1972, Vistas in Astronomy, 14, 81
- Cox et al. (2005a) Cox, N. L. J., Kaper, L., Foing, B. H., & Ehrenfreund, P. 2005a, A&A, 438, 187
- Cox et al. (2005b) Cox, N. L. J., Kaper, L., & Mokiem, M. R. 2005b, A&A, 436, 661
- Crawford (1992) Crawford, I. A. 1992, MNRAS, 254, 264
- Crawford & Barlow (1991) Crawford, I. A. & Barlow, M. J. 1991, A&A, 251, L39
- Dame et al. (1987) Dame, T. M., Ungerechts, H., Cohen, R. S., et al. 1987, ApJ, 322, 706
- de Koter et al. (1993) de Koter, A., Schmutz, W., & Lamers, H. J. G. L. M. 1993, A&A, 277, 561
- Ergma & van den Heuvel (1998) Ergma, E. & van den Heuvel, E. P. J. 1998, A&A, 331, L29
- Franco (1989) Franco, G. A. P. 1989, A&A, 215, 119
- Glass (1979) Glass, I. S. 1979, MNRAS, 187, 807
- Haberl (1991) Haberl, F. 1991, ApJ, 376, 245
- Hammerschlag-Hensberge et al. (1976) Hammerschlag-Hensberge, G., Zuiderwijk, E. J., van den Heuvel, E. P. J., & Hensberge, H. 1976, A&A, 49, 321
- Hillier & Miller (1998) Hillier, D. J. & Miller, D. L. 1998, ApJ, 496, 407
- Hillier & Miller (1999) Hillier, D. J. & Miller, D. L. 1999, ApJ, 519, 354
- Hong & Hailey (2004) Hong, J. & Hailey, C. J. 2004, ApJ, 600, 743
- Humphreys (1972) Humphreys, R. M. 1972, A&A, 20, 29
- Humphreys (1978) Humphreys, R. M. 1978, ApJS, 38, 309
- Hutchings et al. (1982) Hutchings, J. B., Crampton, D., Cowley, D., Cowley, A. P., & Bord, D. J. 1982, PASP, 94, 541
- in ’t Zand et al. (1998) in ’t Zand, J. J. M., Baykal, A., & Strohmayer, T. E. 1998, ApJ, 496, 386
- Joss & Rappaport (1984) Joss, P. C. & Rappaport, S. A. 1984, ARA&A, 22, 537
- Kalogera & Baym (1996) Kalogera, V. & Baym, G. 1996, ApJ, 470, L61+
- Kaper (1998) Kaper, L. 1998, in ASP Conf. Ser. 131: Properties of Hot Luminous Stars, 427–+
- Kaper (2001) Kaper, L. 2001, in ASSL Vol. 264: The Influence of Binaries on Stellar Population Studies, 125–+
- Kaper et al. (1995) Kaper, L., Lamers, H. J. G. L. M., Ruymaekers, E., van den Heuvel, E. P. J., & Zuidervijk, E. J. 1995, A&A, 300, 446
- Kaper et al. (1997) Kaper, L., Trams, N. R., Barr, P., van Loon, J. T., & Waters, L. B. F. M. 1997, Ap&SS, 255, 199
- Kaufer et al. (2000) Kaufer, A., D’Odorico, S., & Kaper, L. 2000, UVES User Manual
- Kerr et al. (1986) Kerr, F. J., Bowers, P. F., Jackson, P. D., & Kerr, M. 1986, A&AS, 66, 373
- Koh et al. (1997) Koh, D. T., Bildsten, L., Chakrabarty, D., et al. 1997, ApJ, 479, 933
- Kreykenbohm et al. (2004) Kreykenbohm, I., Wilms, J., Coburn, W., et al. 2004, A&A, 427, 975
- Lamers & Waters (1984) Lamers, H. J. G. L. M. & Waters, L. B. F. M. 1984, A&A, 136, 37
- Layton et al. (1998) Layton, J. T., Blondin, J. M., Owen, M. P., & Stevens, I. R. 1998, New Astronomy, 3, 111
- Leahy (1991) Leahy, D. A. 1991, MNRAS, 250, 310
- Leahy (2002) Leahy, D. A. 2002, A&A, 391, 219
- Mathis (1990) Mathis, J. S. 1990, ARA&A, 28, 37
- Mokiem et al. (2005) Mokiem, M. R., de Koter, A., Puls, J., et al. 2005, A&A, 441, 711
- Mukherjee & Paul (2004) Mukherjee, U. & Paul, B. 2004, A&A, 427, 567
- Nagase (1989) Nagase, F. 1989, PASJ, 41, 1
- Najarro et al. (1997) Najarro, F., Hillier, D. J., & Stahl, O. 1997, A&A, 326, 1117
- Nauenberg & Chapline (1973) Nauenberg, M. & Chapline, G. J. 1973, ApJ, 179, 277
- Nyman et al. (1989) Nyman, L.-A., Bronfman, L., & Thaddeus, P. 1989, A&A, 216, 185
- Parkes et al. (1980) Parkes, G. E., Culhane, J. L., Mason, K. O., & Murdin, P. G. 1980, MNRAS, 191, 547
- Pauldrach et al. (2001) Pauldrach, A. W. A., Hoffmann, T. L., & Lennon, M. 2001, A&A, 375, 161
- Pravdo et al. (1995) Pravdo, S. H., Day, C. S. R., Angelini, L., et al. 1995, ApJ, 454, 872
- Pravdo & Ghosh (2001) Pravdo, S. H. & Ghosh, P. 2001, ApJ, 554, 383
- Puls et al. (1996) Puls, J., Kudritzki, R.-P., Herrero, A., et al. 1996, A&A, 305, 171
- Puls et al. (2005) Puls, J., Urbaneja, M. A., Venero, R., et al. 2005, A&A, 435, 669
- Quaintrell et al. (2003) Quaintrell, H., Norton, A. J., Ash, T. D. C., et al. 2003, A&A, 401, 313
- Rhoades & Ruffini (1974) Rhoades, C. E. & Ruffini, R. 1974, Physical Review Letters, 32, 324
- Saraswat et al. (1996) Saraswat, P., Yoshida, A., Mihara, T., et al. 1996, ApJ, 463, 726
- Sato et al. (1986) Sato, N., Nagase, F., Kawai, N., et al. 1986, ApJ, 304, 241
- Sembach et al. (1993) Sembach, K. R., Danks, A. C., & Savage, B. D. 1993, A&AS, 100, 107
- Sembach & Savage (1996) Sembach, K. R. & Savage, B. D. 1996, ApJ, 457, 211
- Srinivasan (2002) Srinivasan, G. 2002, A&A Rev., 11, 67
- Stevens (1988) Stevens, I. R. 1988, MNRAS, 232, 199
- Timmes et al. (1996) Timmes, F. X., Woosley, S. E., & Weaver, T. A. 1996, ApJ, 457, 834
- Van den Heuvel & Habets (1984) Van den Heuvel, E. P. J. & Habets, G. M. H. J. 1984, Nature, 309, 598
- Van der Meer (2006) Van der Meer, A. 2006, Ph.D. thesis, University of Amsterdam (ISBN: 90-5776149-1)
- Van der Meer et al. (2006) Van der Meer, A., Kaper, L., Van Kerkwijk, M., Heemskerk, M., & Van den Heuvel, E. 2006, A&A, submitted
- Van Dishoeck & Black (1989) Van Dishoeck, E. F. & Black, J. H. 1989, ApJ, 340, 273
- Van Genderen & Sterken (1996) Van Genderen, A. M. & Sterken, C. 1996, A&A, 308, 763
- Van Kerkwijk et al. (1995) Van Kerkwijk, M. H., Van Paradijs, J., Zuiderwijk, E. J., et al. 1995, A&A, 303, 483
- Watson et al. (1982) Watson, M. G., Warwick, R. S., & Corbet, R. H. D. 1982, MNRAS, 199, 915
- Wellstein & Langer (1999) Wellstein, S. & Langer, N. 1999, A&A, 350, 148
- White (1985) White, N. E. 1985, in NATO ASIC Proc. 150: Interacting Binaries, 249–287
- White & Swank (1984) White, N. E. & Swank, J. H. 1984, ApJ, 287, 856
- Wolf & Stahl (1985) Wolf, B. & Stahl, O. 1985, A&A, 148, 412