The large-scale jet-powered radio nebula of Circinus X-1
Abstract
We present multi-epoch observations of the radio nebula around the neutron star X-ray binary Circinus X-1 made at 1.4 and 2.5 GHz with the Australia Telescope Compact Array between October 2000 and September 2004. The nebula can be seen as a result of the interaction between the jet from the system and the interstellar medium and it is likely that we are actually looking toward the central X-ray binary system through the jet-powered radio lobe. The study of the nebula thus offers a unique opportunity to estimate for the first time using calorimetry the energetics of a jet from an object clearly identified as a neutron star. An extensive discussion on the energetics of the complex is presented: a first approach is based on the minimum energy estimation, while a second one employs a self-similar model of the interaction between the jets and the surrounding medium. The results suggest an age for the nebula of years and a corresponding time-averaged jet power . During periodic flaring episodes, the instantaneous jet power may reach values of similar magnitude to the X-ray luminosity.
keywords:
accretion, accretion discs – stars: individual: Circinus X-1 – stars: variables: other – ISM: jets and outflows – radio continuum: stars – radiation mechanisms: non-thermal – X-rays: stars.1 Introduction
Circinus X-1 is a very unusual X-ray binary system discovered in 1971 (Margon et al., 1971). It undergoes outbursts at X-ray (Kaluzienski et al., 1976), infrared (Glass, 1978, 1994) and radio (Whelan et al., 1977; Haynes et al., 1978) wavelengths with a period of 16.6 days, a fact that was interpreted as enhanced accretion near the periastron of an elliptical orbit (Murdin et al., 1980; Nicolson, Glass & Feast, 1980). Millisecond variability in X-ray led initially to the classification of Cir X-1 as a black hole candidate (Toor, 1977), but discovery of type I X-ray bursts from the field of Cir X-1 (Tennant, Fabian & Shafer, 1986a, b) suggested identification of the compact object with a neutron star. The quasi-periodic oscillations (QPOs) and X-ray colors of the object on occasion exhibit behaviour similar to that of Z sources (Shirey et al., 1999) but at other times Cir X-1 resembles an atoll source (Oosterbroek et al., 1995) and the source does not fit perfectly to either of these two flavours of low magnetic field neutron stars (see van der Klis (1995)). Optical/IR observations point to a low mass X-ray binary system (LMXB) (Johnston, Fender & Wu, 1999). Recently, Boutloukos, Wijnands & van der Klis (2006) found twin kHz QPOs in the power spectra offering more evidence for associating the compact object in Cir X-1 with a neutron star. The orbit of the binary is not known but probably has a high eccentricity (Murdin et al., 1980; Nicolson et al., 1980; Tauris et al., 1999). Cir X-1 lies within a synchrotron nebula (Haynes et al., 1986) and has variable radio flux densities at cm wavelengths. While the radio flares reached up to 1 Jy in the late 1970s (Whelan et al., 1977; Haynes et al., 1978), they have only been observed at the tens of mJy level ever since (e.g. Stewart et al. (1991); Fender, Tzioumis & Tudose (2005)). The age of the system is unknown, almost all of the estimates being made within the framework of the “runaway binary” scenario that arose from the hypothetical association with the nearby supernova remnant (SNR) G321.9-0.3 (Clark, Parkinson & Caswell, 1975). However, more recent Hubble Space Telescope (HST) observations have revealed no evidence for proper motion of Cir X-1, almost certainly ruling out such a relation (Mignani et al., 2002), leaving the age of Cir X-1 extremely poorly constrained. Another important parameter, the distance, has a very large range of possible values, ranging from 4 to 9 kpc (Goss & Mebold, 1977; Iaria et al., 2005). This system also seems to harbour the most relativistic outflow observed within our galaxy (Fender et al., 2004). The arcsec scale jet has a minimum bulk Lorentz factor of around 10 and an inclination with respect to the line of sight of less than degrees, depending on the accepted distance. As a result, Cir X-1 resembles, at least from a geometrical point of view, a down-scaled version of a BL Lac object.
2 Observations
We have observed Cir X-1 over five epochs between October 2000 and September 2004 at 1.4 and 2.5 GHz using the Australia Telescope Compact Array (ATCA). For better uv coverage, four different antenna configurations were employed, with baselines ranging from 31 up to 6000 m. Table 1 contains the observational log. The absolute flux density calibration was scaled with respect to PKS J1939-6342 (PKS B1934-638). For phase calibration the nearby PMN J1524-5903 (B1520-58) was used. At each of the two frequencies the data were calibrated for the five epochs individually with MIRIAD software (Sault, Teuben & Wright, 1995) and then combined together into an image that covered this way the widest range of baselines permitted by ATCA. In our study we also made use of the publicly available111http://www.astrop.physics.usyd.edu.au/SUMSS/index.html 0.8 GHz Molonglo Observatory Synthesis Telescope (MOST) data (FITS image from April 3, 1992) which is part of the Sydney University Molonglo Sky Survey (SUMSS) (Bock, Large & Sadler, 1999).
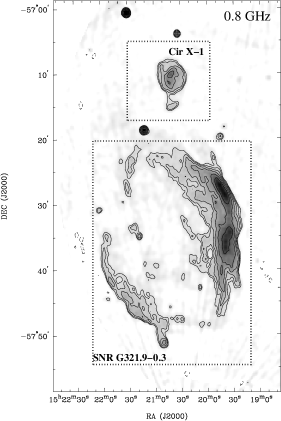
The nearby projection on the sky of SNR G321.9-0.3 (see Fig. 1) resulted in artifacts on the radio maps, degrading the quality of the images (the ATCA full width at half power primary beam is 33 arcmin and 22 arcmin at 1.4 and 2.5 GHz respectively). As a result of this and the diffuse nature of the Cir X-1 nebula itself, the images and flux measurements of the nebula vary significantly with the chosen angular resolution (which we can select by adjusting the weighting on different baselines). Furthermore, for the total flux measurements used in section 2.2 we weighted the short baselines most strongly in order to recover as much of the diffuse nebular emission as possible (while still trying to exclude artifacts from SNR G321.9-0.3).
| Epoch | Time [h] | Array configuration222A list of standard ATCA array configurations at: http://www.narrabri.atnf.csiro.au/operations/array_configurations/configurations.html. | Frequency [GHz] |
|---|---|---|---|
| October 1, 2000 | 9 | 6A | 1.4, 2.5 |
| October 14, 2000 | 11 | 6A | 1.4, 2.5 |
| October 25, 2000 | 12 | 6C | 1.4, 2.5 |
| August 3, 2001 | 11 | 1.5A | 1.4, 2.5 |
| September 3, 2004 | 10 | EW214 | 1.4, 2.4 |
2.1 Radio maps
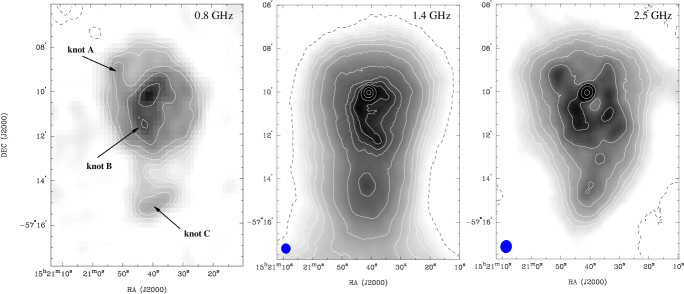
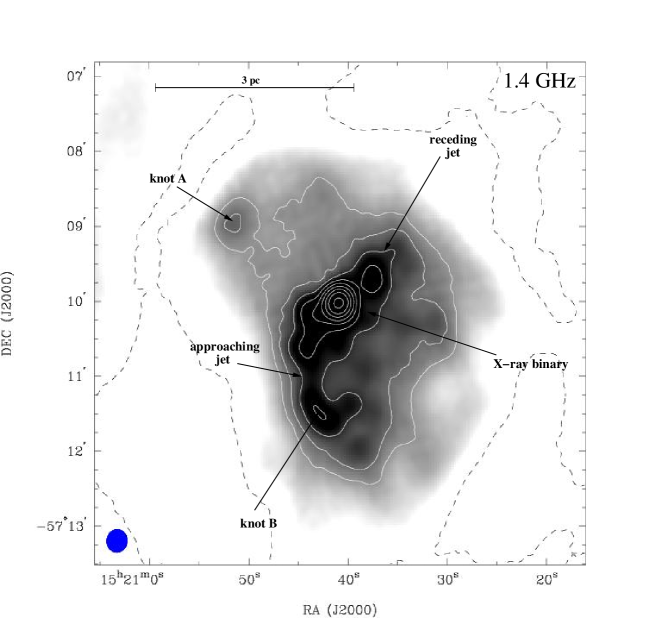
In Fig. 1 we present the large-scale 0.8 GHz radio map of the Cir X-1 region from SUMSS, indicating the nearby SNR G321.9-0.3. Fig. 2 is a montage of 0.8, 1.4 and 2.5 GHz maps of the nebula around Cir X-1, clearly showing structure and emission extending in the direction of the SNR, and finally Fig. 3 presents our most detailed 1.4 GHz image of the nebula, revealing considerable structure within the arcmin-scale jets.
An arcmin jet-like structure within the nebula (previously observed in radio by Stewart et al. (1993)) is clearly seen at 0.8, 1.4 and 2.5 GHz in Figs. 2 & 3. The jet exhibits asymmetry: the south-eastern side (with respect to the radio core) is slightly brighter and longer than the north-western one.
As already noted, the arcsec scale jet of Cir X-1 may be the most relativistic yet discovered in the galaxy, with an orientation very close to the line of sight (Fender et al., 2004) and a position angle on the sky coincident with the arcmin scale jet (Fender et al., 1998). It therefore seems reasonable to assume that the geometry of the jet is preserved at arcmin scales, so the observed asymmetry at 1.4 GHz can be explained in terms of an approaching (south-east) and a receding jet (north-west) affected by projection effects. The bends of the jet may be consequences of the precession affecting the disk of the X-ray binary to which the jets are very likely coupled. Such precession of the jets is observed in SS 433 (e.g. Margon et al. (1979)), an X-ray binary harbouring relativistic jets interacting with a surrounding radio nebula, an object resembling Cir X-1. Interactions with clouds of higher density could be an alternative explanation for the change in direction of the jet and this would appear to be observed at arcsec scales at least (Fender et al., 2004).
The expected ratio between the fluxes of the approaching and receding continuous jets, for an inclination with respect to the line of sight of 5-15 degrees and a velocity ratio is (1.3, 1.6, 2.1). An image plane fit to the central region of the Cir X-1 complex in the radio map in Fig. 3 (the inner 40 40 arcsec2) shows that the simplest appropriate model is composed of an unresolved source coinciding on the sky with the X-ray binary (at the position given by Fender et al. 1998) and an extended source centred some 2 arcsec to the south-east. If we assume that the SE-NW asymmetry is due to Doppler boosting, it follows that the radio map at 1.4 GHz is consistent with a large-scale jet with a factor of at least 0.1. The maps at the other frequencies have a poorer resolution and cannot add useful supplementary information in this respect. As a caveat we should note that it is clear from the results presented in Fender et al. (2004) that complex and varying interactions do take place within the inner few arcsec, and there may be a significant contribution to the SE-NW asymmetry from e.g. the environment into which the jet is propagating.
An interesting feature present at all three frequencies is “knot A” in the north-east (Figs. 2 & 3). Its nature is unknown. It could be a region of higher density that was energised by the passage of a shock originating in the center of the complex. The blob is not detected at higher frequencies (October, 2000 ATCA 4.8 and 8.6 GHz) therefore an identification with a background radio source can probably be ruled out, since the lack of detection at these frequencies is likely due to a diffuse structure being resolved out.
An enhanced radio emitting region, “knot B”, is evident at 0.8 and 1.4 GHz (Figs. 2 & 3). This could be interpreted as the interaction site where the approaching jet impinges on the interstellar medium. However, projection effects might be at work and could complicate such a simple explanation.
The “knot C” region (Fig. 2) also appears at all three frequencies discussed here and looks rather isolated at 0.8 GHz and 1.4 GHz. The nature of this is unknown. Its presence was easier to accommodate in the “runaway binary” scenario, but the HST observations (see section 1) reopened the issue of its origin. It may be a relic of a previous epoch of strong jet activity.
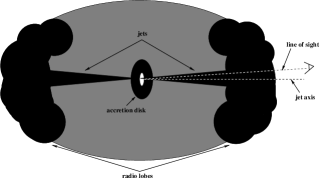
The likely general picture of the radio nebula emerging is that of a system in which the energy and matter are supplied from the central source via the jets. In this respect, we propose that the radio nebula is formed at the interaction site between the jet, inclined at a low angle to the line of sight, and the interstellar medium (Fig. 4). Therefore, uniquely in the case of this system, we are observing the core of the binary through one of the radio lobes.
2.2 Spectral index
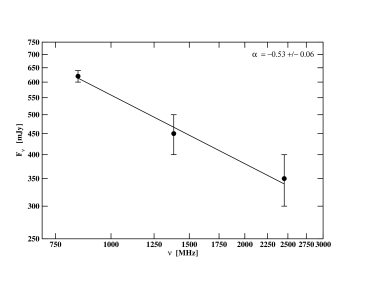
Even though the radio monitoring of Cir X-1 was sparse in the last three decades, apparently there is a secular decrease in the radio flux levels measured in the active as well as in the quiescent states, with short periods of enhanced activity (Whelan et al., 1977; Haynes et al., 1978; Nicolson et al., 1980; Preston et al., 1983; Stewart et al., 1991, 1993; Fender, 1997; Fender et al., 1998, 2005). The ASM/Rossi X-ray Timing Explorer (RXTE)333http://xte.mit.edu/ data from the last 10 yr show a similar behaviour in X-ray band. Fig.5 presents the quiescent overall spectrum of the Cir X-1 complex (i.e. binary system plus radio nebula) from combined ATCA and MOST data (see section 2). This is the first low-frequency spectrum reported for this object since the late ’70s (Whelan et al., 1977; Haynes et al., 1978), early ’80s (Haynes et al., 1986). The spectral index obtained here, , is within the errors identical to earlier values, with the flux level scaled down by 300 mJy at 1.4 GHz in comparison with the measurements (notably at a slightly different resolution) made in 1977 (Haynes et al., 1978). This is almost certainly due to the secular decline of the radio core and we find no evidence for a change in the radio luminosity of the nebula.
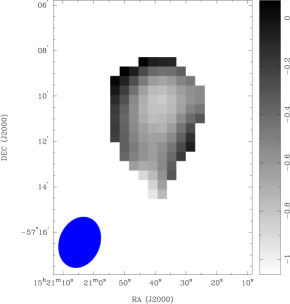
The spectral index map of the radio nebula, made with the combined ATCA data at 1.4 and 2.5 GHz, is presented in Fig. 6. A larger than nominal beam was used in order to increase the signal to noise ratio of the extended emission (nevertheless, due to the simultaneity of the observations at the two frequencies, we need to bear in mind that the u-v coverage is not identical). Maps made with better resolution, which at least in principle should be qualitatively correct, are compatible with the features seen in Fig.6. Namely, there is a tendency towards a flatter spectrum in the north-eastern part of the nebula in a zone coincident with an enhanced radio emission region (“knot A” in Figs. 2 & 3). This could be a site of augmented electron acceleration. Also, at a lower confidence level, the spectrum seems to flatten at the edges of the nebula. If real, this could be interpreted in terms of free-free emission or synchrotron radiation from enhanced accelerated particles at the interaction site with the interstellar medium. The “knot C” (Fig. 2) doesn’t appear on the map due to our chosen cut-off in the confidence level of the features represented.
3 Energetics
3.1 Minimum energy
Assuming a source of volume , specific luminosity , spectrum of the form and considering the radiation to be of synchrotron origin produced by a particle population with the energy spectrum , it is possible to estimate the minimum energy associated with the source. The spectral index is related to the particle distribution index by , is the number density of particles in the interval and is a proportionality constant. Two main pathways have been followed in literature for determining the relevant formulas: one using a fixed interval in frequency in the radiation spectrum (Burbidge, 1956; Pacholczyk, 1970; Longair, 1994), the other in the particle energy spectrum(e.g. Pohl 1993; Brunetti, Setti & Comastri 1997; Pfrommer & Enßlin 2004). We will adopt the former method and closely follow Longair (1994).
The internal energy associated with the observed synchrotron emission can be split in two components: the energy of particles (i.e. electrons and protons) and the energy of fields (i.e. magnetic):
| (1) |
| (2) |
where is the magnetic flux density, is the ratio between the energies in protons and electrons, is a parameter taking into account the uncertainties in the estimation of the volume of the emitting region (it is not what usually is referred to as the volume filling factor because we allowed it to be higher than 1, covering this way also the situations when an underestimation of the volume is made; this is very relevant in the case of Cir X-1 because there may be large projection effects along the line of sight). is a numerical constant related to the magnetic constant , while incorporates the dependences on the radiation spectrum and particle energy distribution (e.g. Longair (1994)).
The sum of energies in eqs. (1) and (2) has a minimum with respect to the magnetic flux density at :
| (3) | |||||
thus the minimum energy necessary to explain the observed synchrotron emission reads:
| (4) | |||||
and correspond to a particular state of the system in which the energy in magnetic field is three quarters of the energy in particles.
Averaging the energy loss rate by synchrotron radiation over an isotropic distribution of pitch angles, the lifetime of an electron emitting at the peak of the synchrotron spectrum is:
| (5) |
3.2 Application to Cir X-1
In order to estimate the minimum energy requirements for Cir X-1 we use eq. (4). The nebula was detected between 0.4 GHz (Whelan et al. (1977); considering that at low frequencies the radiation from the diffuse nebula dominates) and 2.5 GHz (this work), therefore we make the assumption that within this frequency interval the spectrum is of synchrotron origin and has the slope derived in section 2.2, . The energy associated with the particles is dominated by the lowest energy particles and so the above upper limit in the frequency domain is not essential in the calculation. The volume of the emitting region can be very roughly estimated in this particular case by assuming the radio lobe has a spherical geometry: for a 250 arcsec radius object at 4.1 kpc (Iaria et al., 2005) the resulting volume (both radio lobes taken into account) is . We further assume that the synchrotron radiative processes are dominated by electrons and therefore the ratio between the energy in protons and electrons . Applying eq. (4), the minimum energy (in the comoving frame) required to account for the observed radio emission, under the assumptions made above is . This value is of the same order of magnitude as the one inferred for the W50 nebula around SS433 (Dubner et al., 1998; Moldowan et al., 2005). This raises the possibility that Cir X-1 might not be a jet-powered radio nebula only, but maybe a distorted SNR as suggested for W50 (e.g. Green (2004)). The corresponding magnetic field derived from eq. (3) is . The electron lifetime (eq. (5)) at 2.5 GHz is then .
This estimate does not include energy stored in bulk motions or in heating of protons and so could be a significant underestimate. Errors in the evaluation of the volume () would modify the minimum energy by not more than a factor 10.
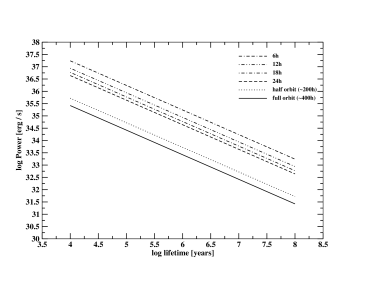
Assuming the energy in the nebula has not been injected continuously (i.e. along the full orbit of the X-ray binary), Fig.7 shows the dependence of the averaged jet power as a function of the age of nebula and the duty cycle of the binary system. We investigate this because the periodic X-ray flares correlate with the radio flares (Whelan et al., 1977; Haynes et al., 1978; Thomas et al., 1978; Fender, 1997) suggesting enhanced accretion onto the compact object and ejection of matter via the jets. It is realistic to consider that the injection of energy from the binary to the radio nebula is occurring mainly during the flare states and to identify the duty cycle in Fig. 7 with the duration of the flares. The solid (lowest) line in Fig. 7 corresponds to a duty cycle of unity. For an active jet phase of less than one day (corresponding to a duty cycle ), and an age of the nebula of , the minimum jet power would be of the order of .
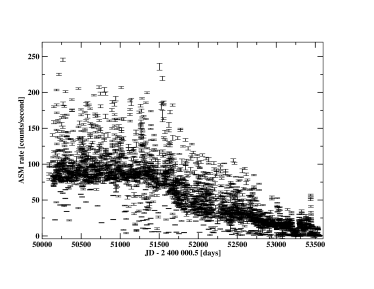
Fig. 8 presents the ASM/RXTE light curve of the central X-ray source of the Cir X-1 complex. Over the period of the X-ray data plotted, the averaged X-ray power (for a distance of 4.1 kpc) is . Such a high power is typical for most of the Z sources, which are accreting at a large fraction of the Eddington limit.
Making the simple assumption that in the flare state the X-ray light curve has a square shape and the increase in amplitude from the quiescent level is of 50 ASM counts s-1 (a more or less typical value in the last few years), then the additional power in X-rays during the flare is of the order . In any case, these estimates suggest that the jet power during flaring phases may be a significant fraction of the X-ray power.
4 Age of the radio nebula
Constraining the age of the nebula is a very difficult task given the fact that so little is known about the Cir X-1 complex. Only very weak constraints can be imposed.
The size of the nebula can offer a rough estimation of the age. Oversimplifying the problem and considering a constant expansion of the nebula with an average velocity in the plane of the sky , the time required to achieve its present size (assuming a distance of 4.1 kpc) is:
| (6) |
where is the angular size. For , the expansion time is . Therefore if the nebula is expanding with a velocity comparable to that of the jet powered nebula around Cyg X-1 (Gallo et al., 2005), that is tens up to a few hundreds km s-1, its age is likely to be less than .
5 A self-similar fluid model
In order to attempt to understand the energetics and evolution of the nebula better, we have developed a simple self-similar fluid model for the jet-powered nebula.
We identify the radio nebula of Cir X-1 with the radio synchrotron lobes inflated by the jets. This situation is analogous to the model for the lobes of radio galaxies described by Kaiser & Alexander (1997). In the following we develop a simplified version of this model for Cir X-1. The main assumptions of the model are: the jets are in pressure equilibrium with the lobes they inflate. The energy transport rate of a single jet or “jet power”, , is constant over the lifetime of the jet. The jet may go through phases of outbursts and quiescence as long as the duration of these phases is short compared with the overall jet lifetime. In this case, is the jet power averaged over the lifetime of the jet. The expansion of the lobe is confined by the ram-pressure of the receding external gas in all directions. Under these conditions Kaiser & Alexander (1997) showed that the expansion of the lobe is self-similar, e.g. the ratio , where is the length of the lobe in the direction of jet propagation and is the radius of the lobe perpendicular to the jet measured at a fixed fraction of , say , is a constant.
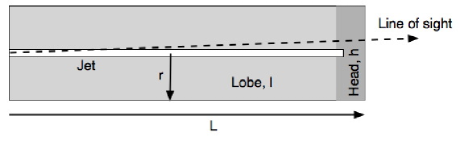
We now simplify the model by assuming a cylindrical geometry for the lobe with the axis of the cylinder aligned with the jet. Figure 9 shows a schematic of the lobe geometry. The jet ends in a high-pressure region, the “head”, where the energy transported by the jet is thermalized. The pressure in the head, , mainly drives the forward expansion of the lobe, which is confined by the ram-pressure of the external medium of mass density . This can be expressed as:
| (7) |
where we assume that the density of the external medium, , is constant. The sideways expansion of the lobe is mainly driven by the pressure in the lobe, , and so
| (8) |
The ratio of the two pressures is then:
| (9) |
where we have used the condition of self-similar expansion, i.e. with .
The volume of the head region, , will usually be small compared to the volume of lobe, and so (Kaiser & Alexander, 1999). The self-similar expansion of the lobe suggests that , but we will see in the following that as long as any time dependence of is unimportant.
The total internal energy of the lobe, , contained in changes according to:
| (10) |
where is the adiabatic index of the lobe material. The last term describes the expansion work of the head region. Using the results of the discussion above we find:
| (11) |
Thus we can eliminate all quantities referring to the head region from equation (10). From equation (8) and remembering that we get:
| (12) |
Finally, the self-similar expansion of the lobe and imply
| (13) |
where is an arbitrary scale length.
Substituting equations (11), (12) and (13) into equation (10) yields after re-arranging
| (14) |
The solution of this equation is:
| (15) |
with
| (16) |
From the observations we can determine and an estimate for . We then have to assume a value for the aspect ratio , where is reasonable. With this we can determine the length of the lobe . Since we are free to choose , it is convenient to set . then follows from and and an assumption about . If , then and we can neglect the term involving in the eq.(21). With a typical value for appropriate for the external medium we can then determine , the time-averaged jet power.
Finally, the age of the jet/lobe system can be found from equation (12) and is, for our choice ,
| (17) |
We assume the lobe is populated by relativistic electrons and therefore the adiabatic index . can be estimated from the minimum energy requirements as discussed in section 3 and using eq. (14) a minimum lobe pressure is obtained. For an angular size of the lobe of 250 arcsec at 4.1 kpc, R=4, and a number density of the external medium of 2 cm-3, the resulting long-term averaged jet power is while the age is . For lower duty cycles, as is very probably the case for Cir X-1, the jet power estimated here could be up to two orders of magnitude higher. The orders of magnitude of the jet power and age of the nebula are weakly dependent (i.e. do not affect the statements we make) on different reasonable values assumed for the parameters of the model. For instance, for a distance a factor two higher than the one we preferred, the jet power becomes and the age .
With an averaged jet power of and an age of the nebula of less than , these results are compatible with the ones presented in section 3 (see Fig. 7). Clearly, it is not unphysical that the jet could have inflated the nebula.
6 Conclusions
We presented ATCA radio maps of the nebula around Cir X-1 at 1.4 and 2.5 GHz. Combining them with publicly available MOST data we obtained the quiescent spectrum for the complex. The slope of the spectrum is within the error identical to the ones obtained in the 1970’s-1980’s but is scaled down by around 300 mJy at 1.4 GHz, compatible with the observed secular evolution of the central source, both in radio and X-rays. As a whole, the radio nebula can be seen as a galactic analogue of the radio lobes in AGNs: the jet interacts with the interstellar medium and creates the synchrotron radio emission. Uniquely in this case, we are probably seeing the central source through the jet-inflated radio lobe, as the jet appears to be aligned very close to the line of sight. In this respect, the Cir X-1 nebula may be an “end-on” analogue of the SS 433/W50 complex. The behavior of the small scale jet (Fender et al., 2004) suggests that the energy that powers up the nebula is supplied intermittently from the central binary system via the jets. Even though hard to strongly constrain in value, the amount of energy transferred to the nebula is important and should be taken into account whenever an energy balance of the whole system is required. The calculations suggest an averaged jet power of at least for a preferred age of the nebula of 105 years and it may be that the jet power becomes comparable to the X-ray luminosity during outbursts. Transfer of considerable energy via jets is not rare, the case of SS433 being well studied (e.g. Dubner et al. (1998)); moreover such a process might be more common than previously suspected, as pointed out recently by Gallo et al. (2005).
Finally, we note that this is one of the best estimates to date for the power in jets from a neutron star system. Such measurements may be key in attempts to quantify the disc-jet coupling not only in other neutron star, but also in black hole systems of all scales (Körding et al., 2006).
Acknowledgments
We thank the anonymous referee for detailed comments. VT would like to thank James Miller-Jones and Elena Gallo for useful discussions. The Australia Telescope is funded by the Commonwealth of Australia for operation as a national facility managed by CSIRO. The Molonglo Observatory Synthesis Telescope (MOST) is operated by the School of Physics of the University of Sydney. The X-ray data was provided by the ASM/RXTE teams at MIT and at the RXTE SOF and GOF at NASA’s GSFC.
References
- Bock et al. (1999) Bock, D., Large, M., Sadler, E., 1999, AJ, 117, 1578
- Boutloukos et al. (2006) Boutloukos, S., Wijnands, R., van der Klis, M., 2006, ATel, 695
- Brunetti et al. (1997) Brunetti, G., Setti, G., Comastri, 1997, A&A, 325, 898
- Burbidge (1956) Burbidge G.R., 1956, ApJ, 124, 416
- Clark et al. (1975) Clark, D.H., Parkinson, J.H., Caswell, J.L., 1975, Nature, 254, 674
- Dubner et al. (1998) Dubner, G.M., Holdaway, M., Goss, W.M., Mirabel, I.F., 1998, AJ, 116, 1842
- Fender (1997) Fender, R., 1997, in Zensus J.A., Taylor, G.B., Wrobel, J.M., eds, ASP Conference Series, 144, Radio Emission from Galactic and Extragalactic Compact Sources, ASP, San Francisco
- Fender et al. (1998) Fender, R., Spencer, R., Tzioumis, T., Wu, K., van der Klis, M., van Paradijs, J., Johnston, H., 1998, ApJ, 506, L121
- Fender et al. (2004) Fender, R., Wu, K., Johnston, H., Tzioumis, T., Jonker, P., Spencer, R., van der Klis, M., 2004, Nature, 427, 222
- Fender et al. (2005) Fender, R., Tzioumis, T., Tudose, V., 2005, ATel, 563
- Gallo et al. (2005) Gallo, E., Fender, R., Kaiser, C., Russell, D., Morganti, R., Oosterloo, T., Heinz, S., 2005, Nature, 436, 819
- Glass (1978) Glass, I.S., 1978, MNRAS, 183, 335
- Glass (1994) Glass, I.S., 1994, MNRAS, 268, 742
- Goss & Mebold (1977) Goss, W.M., Mebold, U., 1977, MNRAS, 181, 255
- Green (2004) Green, D.A., 2004, Bull. Astr. Soc India, 32, 335
- Haynes et al. (1978) Haynes, R.F., Jauncey, D.L., Murdin, P.G., Goss, W.M., Longmore, A.J., Simons, L.W., Milne, D.K., Skellern, D.J., 1978, MNRAS, 185, 661
- Haynes et al. (1986) Haynes, R.F., Komesaroff, M.M., Little, A.G., Jauncey, D.L., Caswell, J.L., Milne, D.K., Kesteven, M.J., Wellington, K.J., Preston, R.A., 1986, Nature, 324, 233
- Iaria et al. (2005) Iaria, R., Spanó, M., Di Salvo, T., Robba, N.R., Burderi, L., Fender, R., van der Klis, M., Frontera, F., 2005, ApJ, 619, 503
- Johnston et al. (1999) Johnston, H.M., Fender, R., Wu, K., 1999, MNRAS, 308, 415
- Kaiser & Alexander (1997) Kaiser C.R., Alexander P., 1997, MNRAS, 286, 215
- Kaiser & Alexander (1999) Kaiser C.R., Alexander P., 1999, MNRAS, 305, 707
- Kaluzienski et al. (1976) Kaluzienski, L.J., Holt, S.S., Boldt, E.A., Serlemitsos, P.J., 1976, ApJ, 208, L71
- Körding et al. (2006) Körding, E.G., Fender, R.P., Migliari, S., 2006, accepted to MNRAS, astro-ph/0603731
- Longair (1994) Longair, M.S., 1994, High Energy Astrophysics, Cambridge University Press, Cambridge
- Margon et al. (1971) Margon, B., Lampton, M., Bowyer, S., Cruddace, R., 1971, ApJ, 169, L23
- Margon et al. (1979) Margon, B., Ford, H., Grandi, S., Stone, R., 1979, ApJ, 233, L63
- Mignani et al. (2002) Mignani, R.P., De Luca, A., Caraveo, P.A., Mirabel, I.F., 2002, A&A, 386, 487
- Moldowan et al. (2005) Moldowan, A., Safi-Harb, S., Fuchs, Y., Dubner, G., 2005, AdSpR, 35, 1062
- Murdin et al. (1980) Murdin, P., Jauncey, D.L., Haynes, R.F., Lerche, I., Nicolson, G.D., Holt, S.S., Kaluzienski, L.J., 1980, A&A, 87, 292
- Nicolson et al. (1980) Nicolson, G.D., Glass, I.S., Feast, M.W., 1980 MNRAS, 191, 293
- Oosterbroek et al. (1995) Oosterbroek, T., van der Klis, M., Kuulkers, E., van Paradijs, J., Lewin, W. H. G., 1995, A&A, 297, 141
- Pacholczyk (1970) Pacholczyk, A.G., 1970, Radio Astrophysics, Freeman, San Francisco
- Pfrommer & Enßlin (2004) Pfrommer, C., Enßlin, T.A., 2004, MNRAS, 352, 76
- Pohl (1993) Pohl, M., 1993, A&A, 270, 91
- Preston et al. (1983) Preston, R.A., Morabito, D.D., Wehrle, A.E., Jauncey, D.L., Batty, M.J., Haynes, R.F., Wright, A.E., Nicolson, G.D., 1983, MNRAS, 268, L23
- Sault et al. (1995) Sault, R.J., Teuben, P.J., Wright, M.C.H., 1995, in Shaw, R.A., Payne, H.E., Hayes, J.J.E., eds, ASP Conf. Ser., 77, Astronomical Data Analysis Software and Systems IV, ASP, San Francisco
- Shirey et al. (1999) Shirey, R.E., Bradt, H.V., Levine, A.M., 1999, ApJ, 517, 472
- Stewart et al. (1991) Stewart, R.T., Nelson, G.J., Penninx, W., Kitamoto, S., Miyamoto, S., Nicolson, G.D., 1991, MNRAS, 253, 212
- Stewart et al. (1993) Stewart, R.T., Caswell, J.L., Haynes, R.F., Nelson, G.J., 1993, MNRAS, 261, 593
- Tauris et al. (1999) Tauris, T.M., Fender, R.P., van den Heuvel, E.P.J., Johnston, H.M., Wu, K., 1999, MNRAS, 310, 1165
- Tennant et al. (1986a) Tennant, A.F., Fabian, A.C., Shafer, R.A., 1986a, MNRAS, 219, 871
- Tennant et al. (1986b) Tennant, A.F., Fabian, A.C., Shafer, R.A., 1986b, MNRAS, 221, 27
- Thomas et al. (1978) Thomas, R.M., Duldig, M.L., Haynes, R.F., Murdin, P., 1978, MNRAS, 185, 29
- Toor (1977) Toor, A., 1977, ApJ, 215, L57
- van der Klis (1995) van der Klis, M., 1995, in Lewin, W.H.G., van Paradijs, J., van den Heuvel, E.P.J., eds., Cambridge Astrophys. Ser. 26, X-ray binaries, Cambridge University Press
- Whelan et al. (1977) Whelan, J.A.J., Mayo, S.K., Wickramasinghe, D.T., Murdin, P.G., Peterson, B.A., Hawarden, T.G., Longmore A.J., Haynes, R.F., Goss, W.M., Simons, L.W., Caswell, J.L., Little, A.G., McAdam, W.B., 1977, MNRAS, 181, 259