Anatomy of A Dark Burst - The Afterglow of GRB 060108
Abstract
We present a multiwavelength study of GRB 060108 - the 100th Gamma Ray Burst discovered by Swift. The X-ray flux and light curve (3-segments plus a flare) detected with the XRT are typical of Swift long bursts.
We report the discovery of a faint optical afterglow detected in deep band imaging obtained with the Faulkes Telescope North (FTN) beginning 2.75 minutes after the burst. The afterglow is below the detection limit of the UVOT within 100s of the burst, while is evident in -band images taken with the United Kingdom Infrared Telescope (UKIRT) 45 minutes after the burst. The optical light curve is sparsely sampled. Observations taken in the R and i′ bands can either be fit with a single power law decay in flux, F(t) where , or a 2-segment light curve with an initial steep decay 0.880.2, flattening to a slope 0.310.12. A marginal evidence for rebrightening is seen in the i′ band.
Deep -band imaging obtained days post burst with the VLT reveals a faint, extended object ( mag) at the location of the afterglow. Although the brightness is compatible with the extrapolation of the slow decay with index , significant flux is likely due to a host galaxy. This implies that the optical light curve had a break before 12 days, akin to what observed in the X-rays.
We derive the maximum photometric redshift for GRB 060108. We find that the Spectral Energy Distribution at 1000 s after the burst, from the optical to the X-ray range, is best fit by a simple power law, F, with and a small amount of extinction. The optical to X-ray spectral index () confirm GRB 060108 to be one of the optically darkest bursts detected. Our observations rule out a high redshift as the reason for the optical faintness of GRB 060108. We conclude that a more likely explanation is a combination of an intrinsic optical faintness of the burst, an hard optical to X-ray spectrum and a moderate amount of extinction in the host galaxy.
keywords:
gamma-rays:bursts1 Introduction
Gamma ray bursts (GRBs) are brief, intense and totally unpredictable flashes of gamma rays on the sky that are thought to be produced during the core collapse of massive stars (long-duration bursts) or the merger of two compact objects such as two neutron stars or a neutron star and stellar-mass black hole. Until the recent launch of the Swift satellite in November 2004, it was notoriously difficult to observe GRBs at other wavelengths within seconds or minutes after the burst. Nevertheless, the successful identification with BeppoSAX of bright, long-lived X-ray afterglow emission for long bursts (Costa et al., 1997) and that of the corresponding optical and infrared counterparts (van Paradijs, 1997), established GRBs as cosmological, and therefore the most instantaneously luminous objects in the Universe. Similar breakthroughs for short bursts have recently occurred, showing them also to be extragalactic, but less luminous and less distant than long bursts (Gehrels et al., 2005; Villasenor et al., 2005; Fox et al., 2005; Covino et al., 2006; Barthelmy et al., 2005).
With the availability of Swift’s promptly-disseminated arcsec localizations and the on-board rapid-slew X-ray and ultraviolet/optical telescopes (XRT, UVOT; Gehrels et al. 2004), multi-wavelength monitoring of GRBs from the earliest possible times is now being performed for a significant number of bursts. Additionally, large aperture ground-based robotic telescopes such as the 2-m Liverpool (Steele, 2004) and Faulkes telescopes respond rapidly to GRB alerts and begin automatically imaging the target field within minutes of receipt of an alert, providing early deep upper limits or multi-colour follow-ups of optical counterparts as faint as R 18 - 22 mag (e.g. Guidorzi et al. 2005a, 2006b; Monfardini et al. 2006b).
Despite increasingly rapid responses that provide sensitive limits within minutes of the burst, the absence of long-wavelength emission afterglows for a significant number of GRBs (so-called “dark bursts”) remains a key unsolved problem. In the pre-Swift era, as many as 50% of BeppoSax bursts were lacking an optical detection (De Pasquale et al., 2003; Lazzati, Covino & Ghisellini, 2002). The discovery rate of optical afterglows was even higher for HETE2 than for SAX (Lamb et al. 2004), and it was expected to increase significantly in the Swift era of rapid followup. Instead, a substantial fraction of Swift bursts remain undetected in the optical band (Roming et al., 2006). Possible scenarios to explain the “observed” optical darkness of these bursts, apart from fast-fading transients lacking sufficiently deep, early-time observations (Groot et al., 1998), include intrinsically-faint optical afterglows (Fynbo et al., 2001; Lazzati, Covino & Ghisellini, 2002; De Pasquale et al., 2003; Berger et al., 2005), highly obscured afterglows whose optical light is absorbed by the circumburst or interstellar material (Lazzati, Covino & Ghisellini, 2002; De Pasquale et al., 2006), high redshifts (Fruchter, 1999; Lamb & Reichart, 2000; Bromm & Loeb, 2002; Berger et al., 2002; Tagliaferri et al., 2005), and radiative suppression in a sub-class of bursts with unusually high -ray efficiency producing intrinsically low X-ray and optical fluxes (Roming et al., 2006; Pedersen et al., 2006).
Here we present a multi-wavelength X-ray, optical and infrared study of the optically-faint GRB 060108. The Burst Alert Telescope (BAT, Barthelmy et al. 2005) was triggered by this GRB - Swift’s 100th burst - at 14:39:11.76 UT on January 2006. The -ray light curve has a single peaked structure with a FRED time profile (Oates et al., 2006), a duration T90 = 14.4 1.6 s (in the 15 350 keV band), and a 15 150 keV fluence . Here and in the following errors are at 90% confidence level, unless specified otherwise. The Swift X-ray and ultraviolet/optical telescopes (XRT/UVOT) began observing at 91 s and 76 s after the BAT trigger respectively, followed shortly after by the Faulkes Telescope North (FTN) at 2.75 minutes post trigger. Infrared observations with the United Kingdom Infrared Telescope (UKIRT) were acquired during the optical imaging period beginning at 45 min postburst. The Very Large Telescope (VLT) was used to obtain further near infrared imaging at 16.1 hours and 2.7 days. Following an initial estimate of the position of the X-ray afterglow (Page et al., 2006), a revised location was derived (Butler & Bloom, 2006); the location of the optical (Monfardini et al., 2006a) and infrared counterparts (D’Avanzo et al., 2006; Levan et al., 2006a) was found to be consistent with this revised XRT position. Deep -band imaging and spectroscopy were subsequently performed with the VLT at 12.7 days and 21 days respectively.
2 Observations and Analysis
2.1 Swift Gamma-Ray Observations
At 14:39:11.76 UT, on January 2006, the Swift BAT triggered and located GRB 060108 (BAT trigger 176453) (Oates et al., 2006). Unless otherwise specified, times in this section are referenced to the BAT trigger time, hereafter designated . The burst was detected in the fully coded part of the BAT field of view, meaning that all BAT detectors were illuminated by the source. The spacecraft began to slew to the source location 11.2 s after the trigger and was settled at the source location at +73.20 s.
The BAT data for GRB 060108 between -300 s and +300 s were collected in event mode with 100 s time resolution and 6 keV energy resolution. The data were processed using standard Swift-BAT analysis tools and the spectra were fit using XSPEC 11.3. Before processing, the BAT event data were corrected for mask tagged weighting using the standard BAT tool, batmaskwtevt. This procedure scales each count in each detector by an amount proportional to the portion of the detector exposed to the source through the empty spaces in the BAT coded mask. Mask weighting effectively removes the background and all BAT light curves in this paper have been background subtracted by this method.
2.2 Swift X-ray Observations
The X-ray Telescope (XRT, Burrows et al. 2005a) position refined analysis located this burst at (J2000) = 09h48m016, (J2000) = 31°55′046 (Page et al., 2006). XRT began observations approximately 90 s after the burst trigger. The analysis of the XRT data was performed using the XRT pipeline software version 2.3. The initial exposure was taken in Image Mode and no source was detected. The XRT then observed in Windowed Timing (WT) mode for 10 s before switching to Photon Counting (PC) mode for a further 10 ks; a fading uncatalogued source was detected. Swift observed the field until 106 s after the burst trigger.
The source and background counts used to create the light curve and the spectra were obtained from the cleaned event files using extraction regions. The analysis of the WT mode data provided only limited results as the exposure was of such a short duration.
The first 1000 s of PC data were found to be piled up. The size of the region that was affected by the pile-up was determined by comparing the measured point spread function (PSF) with a model XRT PSF. The affected radius was found to be 1.6 pixels (4″) in radius, therefore an annular region with inner radius 4″and outer radius of 30 pixels (70.8″) has been used for the extraction. The rest of the PC data were extracted using a circular region of radius 30 pixels (70.8″) and a background region of radius 80 pixels (189″). These regions were used to extract data from all orbits of PC data.
When extracting the PC mode spectrum, only events with grade 0 - 12 were used, and for the WT mode, events were used of grade 0 - 2. The energy response of the detector was taken into account when fitting the spectrum. The response matrices (RMs) were taken from the Swift calibration database, CALDB 20060426. These were the most recent calibration products available and were released in April 2006. The effective area files were created with xrtmkarf and required an image file created using expomap. This code maps the detector plane so any bad pixels or hot columns are accounted for in the effective area file. A correction factor calculated with xrtmkarf was applied to the piled up section of the XRT light curve.
During the observations, the burst’s location near to the Sun caused the XRT to warm up, leading to mode switching of the instrument. This only affected data in the second orbit and onwards. Thus the PC light curves, where appropriate, were also corrected for low fractional exposure.
2.3 Optical and Near Infrared Imaging
2.3.1 Swift Ultraviolet Optical Telescope (UVOT)
The UVOT began observations s after the BAT trigger. The first 11 s exposure, taken while the spacecraft was settling on the target, was taken through the filter in photon-counting (“Event”) mode. Once the pointing had stabilized, a 200 s -band finding-chart exposure in Image/Event mode was taken. After this, the UVOT cycled through the colour filters. The later exposures were in image mode only. Counts were extracted from the images using a 3″ radius aperture at the position of the optical afterglow given in this paper. The count rates were aperture-corrected to ensure compatibility with the photometry calibration by Poole et al. (2005). We then derived the 3 upper limits in count units, which were converted to magnitudes using the zero-points available in the Swift CALDB, and corrected for Galactic extinction using . Results are given in Table 1.
| Filter | Time Range | Exposure | 3 Upper Limits |
|---|---|---|---|
| (s) | (s) | (mag) | |
| 75-86 | 11 | 17.9 | |
| 90-290 | 200 | 19.6 | |
| 76-1096 | 357 | 19.9 | |
| 16835-17735 | 900 | 20.8 | |
| 457-886 | 100 | 20.1 | |
| 10983-40489 | 1588 | 21.8 | |
| 403-832 | 100 | 20.2 | |
| 349-5624 | 521 | 20.9 | |
| 295-5195 | 999 | 21.7 | |
| 566-995 | 100 | 20.2 |
2.3.2 Faulkes Telescope North (FTN)
The Faulkes Telescope North, located on Maui, Hawaii, responded robotically to the Swift alert and began observing 2.75 min after the GRB trigger. The initial detection mode images (three 10 s -band exposures) were processed automatically by the Liverpool GRB pipeline, LT-TRAP (Guidorzi et al., 2006a). No new source has been identified in the XRT error box (Page et al., 2006) brighter than 19.5 mag (t = 3.1 min) and 20.2 mag (t = 11.7 min) in comparison with USNO-B1.0, 2MASS and GSC 2.3 catalogues (Guidorzi et al., 2006b). The telescope continued in multicolour imaging mode, obtaining the exposures in bands.
| Mean Date | Filter | Telescope | Exposure | Seeing | Magnitude | Time Range | t |
|---|---|---|---|---|---|---|---|
| (UT) | Time (s) | () | (s) | (s) | |||
| Jan 8.613776 | Bessell-B | FTN | 10.0 | 1.12 | 19.90 | 269279 | 274 |
| Jan 8.624165 | Bessell-B | FTN | 390.0 | 1.54 | 22.310.26 | 4501552 | 1172 |
| Jan 8.643794 | Bessell-B | FTN | 540.0 | 1.74 | 22.720.35 | 21983310 | 2868 |
| Jan 8.614304 | Bessell-V | FTN | 10.0 | 1.29 | 21.71.2† | 315325 | 320 |
| Jan 8.612498 | Bessell-R | FTN | 10.0 | 1.09 | 20.20 | 159169 | 164 |
| Jan 8.612996 | Bessell-R | FTN | 10.0 | 1.09 | 20.20 | 202212 | 207 |
| Jan 8.616757 | Bessell-R | FTN | 30.0 | 1.18 | 21.230.44 | 517547 | 532 |
| Jan 8.620774 | Bessell-R | FTN | 240.0 | 1.47 | 21.840.28 | 1641186 | 879 |
| Jan 8.633794 | Bessell-R | FTN | 300.0 | 1.55 | 21.880.31 | 17672359 | 2004 |
| Jan 8.649744 | Bessell-R | FTN | 420.0 | 1.74 | 21.980.31 | 29443711 | 3382 |
| Jan 8.614940 | SDSS-i′ | FTN | 10.0 | 1.12 | 20.90.7† | 370380 | 375 |
| Jan 8.619292 | SDSS-i′ | FTN | 100.0 | 1.34 | 21.690.38 | 375891 | 751 |
| Jan 8.630704 | SDSS-i′ | FTN | 300.0 | 1.51 | 21.450.16 | 13521993 | 1737 |
| Jan 8.644338 | SDSS-i′ | FTN | 300.0 | 1.56 | 21.880.33 | 24643265 | 2915 |
†Marginal detection with low statistical significance. Errors are derived by adding statistical and systematic errors in quadrature. Magnitudes are uncorrected for Galactic extinction. 3 upper limits are quoted for non-detections. Column 7 lists the Time range covered by the exposures and column 8 lists the corresponding exposure-weighted mean time (t) since the burst for co-added images calculated as .
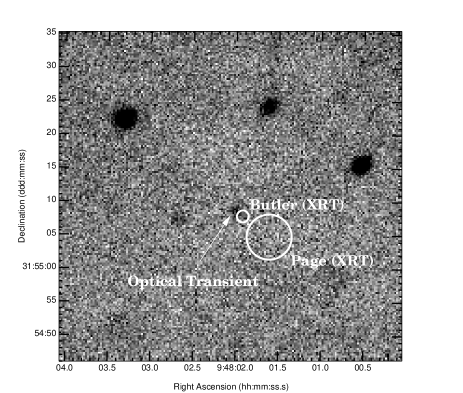
The robotic followup ended after one hour. Subsequent post-processing of the band images revealed an uncatalogued source 3″ NE of the edge of the XRT error circle (see Figure 1). The -band brightness of this source in the FTN image relative to the neighbouring object was greater than in the pre-burst SDSS -band image, suggesting it as the candidate afterglow. Subsequent analysis of the XRT data by Butler & Bloom (2006) confirmed an XRT offset with a revised position for the afterglow (J2000) = 09h48m0192, (J2000) = 31°55′078 with 09 uncertainty (90% containment). As can be seen in Figure 1, the location of the optical afterglow at (J2000) = 09h48m0198, (J2000) = 31°55′086 with 05 uncertainty (90% containment, Monfardini et al. 2006b), is consistent with the revised XRT position. A similar location is derived for the NIR counterpart identified by D’Avanzo et al. (2006) and Levan et al. (2006a). Careful analysis of the optical data subsequently confirmed that the source was fading and further imaging with the FTN and other telescopes was manually triggered to follow the later-time evolution. Unfortunately moon and weather constraints prevented deep detections or limits beyond 23 mag.
Table 2 summarizes the results of the optical and NIR imaging; as no FTN observations of standard stars were available, magnitudes in , , , and were calibrated as follows. Observations in band were calibrated directly using the SDSS DR4 photometry222www.sdss.org/dr4/, while , , and band data were calibrated assuming the pre-burst SDSS photometry of Cool et al. (2006a, b) combined with observed filter transformations given by Smith et al. (2002) in their Table 7. Finally, the data were corrected for the Galactic extinction, which is low towards GRB 060108: AB = 0.09 mag, AV = 0.07 mag, AR = 0.05 mag, Ai = 0.04 mag (Schlegel et al., 1998; Cardelli et al, 1989). Magnitudes were converted into flux densities F (Jy) following Bessel (1979) and Fukugita et al. (1996) for comparison with X-ray flux densities.
2.3.3 Very Large Telescope (VLT)
- and -band observations of the field of GRB 060108 were performed by using the ISAAC camera at two different epochs, and in the band by using the FORS 1 instrument at one epoch (see Table 3). Both instruments are mounted on the ESO-VLT located at Cerro Paranal (Chile). All nights were photometric, with a seeing in the range 0.8″–1.4″. Image reduction was performed following the standard procedures. Astrometric solutions were computed using the USNO catalog333http://www.nofs.navy.mil/data/fchpix/. Aperture photometry was performed using SExtractor (Bertin & Arnouts 1996). In the optical, the flux calibration was performed observing Landolt standard stars. In the NIR, the 2MASS catalogue (Skrutskie et al. 2006) was adopted as a reference, even if only a handful of usable stars were present in the ISAAC field. Late-time low-resolution spectra were acquired with the VLT in an attempt to measure the host galaxy redshift. However, the object was quite faint and spectra have a very low signal-to-noise ratio, with no clear emission or absorption lines. We will not discuss further these spectra.
In Table 3 we present the observing log and list the results of our spectrophotometric analysis for each epoch.
| Mean UT | Time since | Exp | Seeing | Instrument | Filter/ | Magnitude |
| burst (d) | (s) | (″) | grism | |||
| Jan 9.307 | 00.696 | 1090 | 1.1 | ISAAC | ||
| Jan 11.283 | 02.672 | 6060 | 0.8 | ISAAC | 20.49 0.15 | |
| Jan 21.286 | 12.676 | 10120 | 1.4 | FORS1 | 23.460.15 | |
| Jan 29.237 | 20.626 | 32160 | 0.8 | FORS2 | 300V | — |
| Jan 30.176 | 21.565 | 32160 | 0.8 | FORS2 | 300V | — |
3 Results
3.1 GRB 060108 and Its Afterglow
The afterglow of GRB 060108 is detected at X-ray (Page et al., 2006), optical (Monfardini et al., 2006a) and near infrared wavelengths (Levan et al., 2006a). The X-ray light curve shows the canonical 3-segment decay similar to many gamma ray bursts detected with Swift, with a small flare 300 s after the burst. Optically, the burst is not detected at ultraviolet and optical wavelengths with the UVOT in the first two minutes, but it is detected in deeper , , and band FTN images as early as 5.3 min after the burst. The optical afterglow of GRB 060108 is one of the faintest yet discovered.

3.2 Swift Gamma-Ray Light curve and Spectra
The BAT light curve (see Fig. 2) shows a simple triangular profile in all energy bands, with a rise from background starting at –4.0 s, a peak at , and a return to background levels by +13.2 s. A small secondary peak is seen at around +10 s, but then no detectable emission has been registered after +13.2 s nor at the times of the flare seen by the XRT. The peak count rate measured by BAT is 2000 counts s-1 at , and the duration is s (15 - 350 keV band; estimated error including systematics). The 1s peak photon flux measured from –0.48 s is 0.7 0.1 ph cm-2 s-1 (in the 15 - 150 keV band).
For the spectral analysis, we have analyzed the data between 15 and 150 keV, where BAT has a better response. We find that the emission from GRB 060108 shows the hard to soft spectral evolution commonly observed in many GRBs and that, for all time periods, the best fit to the BAT data is a simple power law. The spectrum of the first peak (-4.02 s to +9 s) is best fitted with a photon index of 1.9 0.17 (/d.o.f. =54/90), while that of the smaller second peak (+9 s to +13.2 s) has a photon index 2.55 0.61 (/d.o.f. = 64/90). With the given spectral parameters, this burst appears to share some similarity with the X-ray flashes (XRFs). Although Swift is not well suited to identify XRFs, since it lacks coverage at low energy (i.e. in the the “classical” HETE band 2-30 keV), we notice that, if the spectrum is extrapolated down to this band, then the soft photon index would imply an XRF or at least an X-ray rich event.
3.3 Swift X-ray Light curve and Spectra
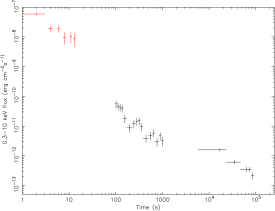
By following O’Brien et al. (2006), the BAT light curve can be extrapolated at lower energies and joined to the XRT light curve in a single plot. Although some consideration is needed (as the energy bands of the two instruments do not overlap), this is a powerful method which allows us to visualize the decay rate of the event through a longer time interval, commencing at the burst trigger. The combined BAT and XRT light curve resulting from this process is shown in Figure 3. For the extrapolation, we used a BAT photon index of (computed in the 15-150 keV band).
The light curve has a complex shape, showing a steep decay, followed by a flatter phase which eventually steepens again. A visual inspection shows a possible flare, superimposed between the two segments. We modeled the X-ray light curve with both a double broken power-law and a double broken power-law with the inclusion of a Gaussian, to represent the flare. In the first case we find a /d.o.f. = 26/23, while by using the second model gives /d.o.f = 11/20. The probability that this improvement is due to chance, calculated using the F-test, is 0.05. In order to check for overfitting effects, we repeated the fitting by adopting different choices for the temporal binning. We find that, in all cases, the light curve is better fitted by including a Gaussian, although in some cases both fits (with and without Gaussian) have reduced values larger than unit, and in turn the decrease in is less pronunced. The probability that the improvement is due to chance, calculated using the F-test, varies between 0.019 and 0.035 in the different fits, which means that the fit including the Gaussian can be used with a confidence of . The best fit parameters appear to be always consistent with each others, and are given in Table 4; here and in the following we assume the convention .
| Parameter | |
|---|---|
| s | |
| s | |
| s | |
| s |
| Segment | Interval | excess | ||
|---|---|---|---|---|
| cm-2 | ||||
| 1 | 1.31 0.44 | |||
| Flare | - | 1.7 0.4 | ||
| 2 | 0.68 0.23 | 0.89 0.3 | ||
| 3 | 0.71 0.15 |
Our analysis shows that there are three distinct segments in the X-ray light curve. The X-ray afterglow starts with a phase of steep decay (first segment, slope ), followed by a shallow section (second segment, slope ), and finally enters a “normal afterglow” decay phase, with a slope (third segment). The two break times which separate these three segments are s and ks. This behaviour is typical of X-ray afterglow lightcurves as shown by Nousek et al. (2006).
In order to perform a spectral analysis, we fitted the spectra taken during different time intervals by using an absorbed power-law model. The Galactic value of the column density has been fixed at cm-2 (Dickey & Lockman 1990; this value is in agreement with that obtained from the more recent LAB survey, which is cm-2, Kalberla et al. 2005 444http://www.astro.uni-bonn.de/∼webrai/english/tools_labsurvey.php.), and an additional absorption component, , has been allowed to mimic the intrinsic excess in column density. Results are summarized in Table 5.
The spectral indices before and after the first break at 250 30 s have been first computed by including the flare at 300 10 s ( in the table). In the attempt to assess the flare contamination on these values, we divided the interval in three parts by isolating the time interval of the flare. Since these new spectra contained less than 100 background-subtracted counts, Cash statistics were used for the fitting (a minimum of 15-20 counts per bin are required for Gaussian statistics). A comparison of the resulting indices, , with the previously computed, shows that the flare does not alter significantly the spectral indices registered during the first two decay phases.
Because of the low statistics, when considering the spectra of individual segments separately we are unable to constrain the value of the excess of column density over . We have only been able to derive a 90% upper limit, and only by using the spectra of the last two time intervals. In order to have an estimate for the photoelectic absorption, we re-extracted the X-ray spectrum using all data after the flare through to the end of the observations (time interval 570 s s). Since this spectrum has a better signal to noise, the excess is actually significant at 99% confidence level; the best-fit spectral parameters are , cm-2 (see also §4.2).
3.4 Optical and Infrared Properties
The optical and infrared properties of the GRB 060108 afterglow are also particularly interesting. Figure 1 shows the identification of the optical afterglow with the X-ray counterpart in an FTN -band image, while Figure 4 shows the optical and infrared light curves including detections and upper limits from optical to near infrared wavelengths, corrected for Galactic extinction. As shown in Table 2, the afterglow is visible in all bands from as early as t 5 minutes, but is not detected by UVOT within the first few minutes of the trigger or during the short exposure FTN -band and -band images taken at 164 s and 274 s after the trigger, respectively. Although these FTN exposures have only a s duration, the deep limits rule out a significant optical flare coincident in time with that possibly seen in the X-ray light curve. Moreover, the marginal FTN -band detection (Table 2 and Figure 4) reveals that the afterglow was already fainter than the UVOT limiting magnitudes.
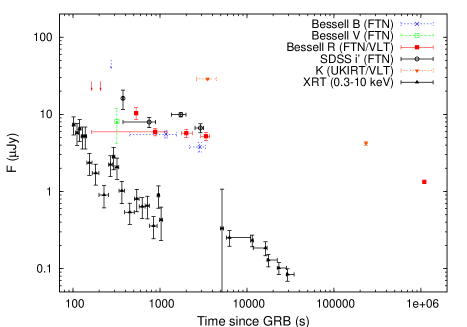
The optical light curves to 4000 s after the burst can be fit with a single power law decay in flux density where (Figure 5), a slope that is also consistent with the gradient between the two -band detections. Alternatively, guided by the structure in the X-ray light curve and concentrating on the and band light curves, a more complicated interpretation is possible. By a direct comparison between the X-ray and optical flux density evolution (see Figure 4) we find that, although the optical light curves are sparsely sampled (due to the need to coadd frames), there is evidence for a 2-segment light curve. A possible rebrightening is seen in band, although the significance is low and a monotonic decay is not ruled out. Using the early time -band upper limit as a constraint on the maximum possible value of and fitting the -band light curve in two time portions and s, we derive and . The second decay is found to be shallow whether or not the late time VLT -band measurement at 12.68 days is included and, by assuming that a break has not occurred in the optical light curve, this may represent a faint detection of the afterglow. On the other hand, as suggested by the X-ray light curve, it is possible that a break has already occurred around ks, in which case the predicted magnitude of the optical counterpart would be significantly fainter than 23.5 mag at 12.68 days. As discussed in § 4, if taken at face value the apparent rebrightening in the -band light curve (Figure 4) may be interpreted as due to a further emission mechanism (possibly a second reverse shock). In such a case, the decay at the end of the first hour may be significantly steeper than 0.31, similar instead to . Moreover, in the late VLT image the object is not pointlike but clearly extended, making likely that the emission detected at such late time is dominated by the host galaxy (at least of the total flux).

3.4.1 Photometric Redshift Derivation


In order to estimate the photometric redshift of GRB 060108, we adopted a minimization of the observed optical to infrared Spectral Energy Distribution (SED) based on the technique presented by Fontana et al. (2000). This is a widely used and well tested technique for redshift determination of galaxies (in which case it takes into account for star formation history of each galaxy type and other effects; Fernandez-Soto et al. 1999, Csabai et al. 2000, Rowan-Robinson 2003, Melandri et al. 2006) which has been recently readapted to fit simple power-law SEDs, as those typical of GRB afterglows.
The photometric redshift was determined by combining contemporaneous optical and NIR flux measurements derived from the early-time FTN and UKIRT imaging at 45 minutes after the burst. The values were extrapolated to 3600 s using different values for the temporal decay index ranging from =0.3 to =0.6 (see Figure 6). Following the method described in Melandri et al. (2006), the magnitudes were converted to the AB system before inputting them into the photometric redshift determination algorithm.
Adopting a minimization of the observed spectral energy distribution (which is assumed to follow a power law F) at 3.6 ks after the trigger, we derive a maximum redshift of at 90 confidence level.
Moreover, by using the temporal decay value of obtained by the simple power law fit discussed in § 3.4, the minimization returns . The results obtained by using this value for are shown in Figure 6. Here the top panel shows the derived AB magnitudes, corresponding to values, and the best-fitting curve; the bottom panel shows the reduced distribution as a function of photometric redshift. The distribution does not show a minimum: it is very flat from to and then start increasing if . Therefore, it does only allow setting an upper limit determination for .
The numerical technique used here does not account for intrinsic absorption. In the attempt to estimate this effect, we imposed a power-law on the whole SED from the optical to X-ray wavelength range, and used a SMC extinction profile. By taking , we find and . The shallower value of is preferable: if is as steep as we would be unable to account for the SED from optical to X-ray according to the synchrotron spectrum of the afterglow. Moreover, is fully consistent with the X-ray slope registered at the same time, as shown in Table 5.
4 Discussion
4.1 Afterglow Model
The X-ray afterglow of GRB 060108 is quite complex and exhibits several of the interesting features which have been recently observed in others GRBs by Swift (see Zhang et al. 2006, Nousek et al. 2006, Burrows et al. 2005b, Roming et al. 2006 for detailed discussions). In particular, in several cases the X-ray emission has been found to consist of an initial steep decay, followed by a shallow one about 100-1000 s after the trigger. A second change of the decay slope usually occurs about 10 ks later. Flares can be observed superimposed to this template behavior, and they are usually thought to be produced by internal shocks that should occur during the prompt emission phase.
In the case of GRB 060108 we have registered three different spectral slopes. The X-ray lightcurve initially follows the standard pattern of rapid to shallow transition, and then, after ks, the afterglow enters the “normal afterglow” phase. Also, a small X-ray flare has been observed at s.
According to the standard interpretation, the initial fast decay is likely to be associated to the tail of the prompt emission. In such a case, the relationship between the spectral and decay indices should be given by (“curvature relation”, see Kumar & Panaitescu 2000, Zhang et al. 2006). In the case of GRB 060108 it is and , therefore the agreement is only marginal. The value of required for the curvature relation to be satisfied is 3.5, although the shallower initial slope observed in our case may possibly be caused by the presence of the flare at 300 s. In fact, the relation gives the steepest decay index for a spherical model and is expected to be satisfied only when emission from on-axis fluid elements is shut off suddenly, and off-axis emission dominates. The presence of minor internal shocks at later times would make the decay more gentle. On the other hand, Figure 3 shows that the backward extrapolation of the XRT data well matches the flux level of the prompt emission, as registered by BAT and extrapolated in the XRT band, strengthening the idea that the initial fast decay of the X-ray emission is related to the prompt emission.
Just after the rapid decay phase, we observe a small flare that peaks at 300 10 s and, when modelled with a Gaussian, has a width s. By adopting different rebinning for the X-ray lightcurve, we have found that the always shows an improvement by adding a Gaussian to the fitting model, and that the confidence level for the flare is . Such X-ray flares are common features of Swift XRT light curves (Zhang et al. 2006, Liang et al. 2006), and are usually associated with collisions between ultrarelativistic shells emitted by the “inner engine” after the main high-energy event. In this case, the decay slope and the spectral index of the flare should again satisfy the curvature relation, at least provided that the decay slope is computed by re-setting the time-zero point t0 at the start of the shell emission (see Zhang et al. 2006 and references therein). Although the flare statistic is quite low and does not allow a robust determination of the slope, we find that this relation is satisfied by taking s. This gives (90% confidence level, while the spectral index is , see Table 5).
After s, the GRB 060108 afterglow enters a phase of plateau, which we can attribute to the emission from the forward shock produced when the fireball runs into the circumburst medium (see Zhang et al. 2006, O’Brien et al. 2006). However, the observed temporal decay slope is shallower than that expected from a standard afterglow decline (Sari et al. 1998), requiring that additional energy is injected into the afterglow (“refreshed” afterglow). Three possible mechanisms have been proposed to explain this late energy injection (Zhang et al. 2006 and references therein): i) a continuous activity from a longer lasting central engine, usually mimicked by a central engine luminosity law of the kind , ii) a power-law distribution of the Lorentz factors in the ejecta, causing slower shells to catch up with the decelerated fireball or iii) the deceleration of highly magnetized ejecta, in which case the outflow is Poynting flux dominated and transfers energy to the medium. In the latter case, however, a good parametrization of the energy release is still lacking, therefore we will not discuss this possibility in further details (see Zhang & Kobayashi 2005 and Zhang et al. 2006 for a discussion).
By using the closure relations listed by Zhang et al. (2006; see their Table 2), we find that the relation which is satisfied by the spectral and decay index during this phase ( and , see Tables 4 and 5) is , giving . All other possibilities are excluded. This implies that the fireball is propagating into a constant density medium (such as the interstellar medium, ISM) and that the X-ray frequency lies between the synchrotron frequency and the cooling frequency (). During this epoch, the central engine does not turn off, but continues to inject energy in the outflow according to the law . This result makes unlikely that the late energy injection is due to electromagnetic emission from an highly magnetized and rapidly rotating pulsar (which in principle can be formed after the explosion of the supermassive star producing the GRB), as this would normally require a flatter injection rate during the initial spind-down phase (), followed by an asymptotic decay with (see Zhang & Mészáros 2001). Similarly, any mechanism causing a nearly constant input of energy (for example early phases of disk accretion, during which the accretion rate, , can be nearly constant, etc …) can be ruled out. However, continued infall of matter onto a newly formed black hole may occur with , since at late times is expected to fall off like a power law.
As mentioned before, an alternative and observationally indistinguishable scenario is one in which the central engine activity is brief, but the ejecta have a distribution of Lorentz factors. The fastest shells initiate the forward shock, decelerate, and are successively caught by the slowest shells producing internal shocks. The consequent addition of energy in the blast-wave mitigates the deceleration and the afterglow decay rate. Assuming a Lorentz factor distribution , where is the shell Lorentz factor, the index is related to by , which, in this case, gives .
The X-ray light curve breaks steeply at 11.5 ks. We can exclude that this is due to the passage of the cooling frequency through the X-ray band at this time, since in such a case, when comparing parameters relative to the epochs before and after the time break, we would expect to observe a relatively large change in the X-ray temporal slope of , accompanied by a similar change in the spectral slope of . In the case of GRB 060108, the observed change in the decay slope is , while the spectral change is only at 90 confidence level. This means that this interpretation is not compatible with the data (less than .
More likely, the second break at ks occurs when the additional energy injection ceases and the afterglow enters a “normal” decay phase. During this phase, temporal and spectral indices satisfy the closure relation , which again confirms that the fireball is propagating in an ISM-like medium. This also requires the X-ray frequency to be below the cooling frequency during the entire duration of XRT observations. The corresponding index of the power-law energy distribution of radiating electrons is .
The comparison between the optical and X-ray light curve is also illuminating. Interestingly, the and band flux after the first 800 s have a decay slope of , similar to what is observed at the same time in the X-ray band. This suggests a common origin for the X-ray and optical emissions at these epochs.
On the other hand, detailed observations in the and band may suggest that the optical decay slope may be steeper between 300 and 800 s. This may indicate that we are detecting a decay from an early optical “bump”, i.e. that at such early times we are observing the fading emission from a faint reverse shock, which propagates backward into the ejecta while they are refreshed by the late central engine activity (Zhang et al., 2003). A possible rebrightening is observed in the band only. The significance is low and a monotonic decay is not ruled out. On the other hand, it is worth to point out that a similar feature has been detected at larger significance in the brighter GRB 060206 (Monfardini et al. 2006c), in which case the and lightcurves could not be fitted with identical functions. If real, the rebrightening in the band may de due to a second reverse shock, possibly initiated by the collision of the 300 s of the X-ray flare into the external medium.
The X-ray light curve breaks steeply at 11.5 ks, while no apparent corresponding break is observed in the and bands. A time break produced by the passage of the cooling frequency through the X-ray spectrum would certainly account for this, since in such a case the break would be monochromatic.
On the other hand, based on the spectral and temporal analysis, we find that this is not likely to be the case and the X-ray break is most probably due to the cessation of energy injection. In such a case, and if the optical and X-ray emission were produced by the same mechanism, a break should be expected to appear in the optical emission, at . Here we only notice that observations are sparse at this time; there are no data in the band measured after 5 ks and the only -band measurement taken after 11.5 ks indicates that the light curve does not break. The fit of the optical lightcurve with a single power law suggests that an optical break may not be required even in correspondence of the first X-ray break. It is therefore possible that the GRB 060108 behaviour is similar to that of other GRBs, which do not present a break in the optical contemporaneous to that in the X-ray (see 2006). A satisfactory explanation for this behaviour is still lacking. Alternatively, if the -band observation (=23.5 mag taken at 12.67 days after the trigger) is attributed to emission from the host galaxy of the GRB, a break in the optical GRB light curve at would not have been observed. As mentioned before, a significant host galaxy contamination is expected, since the source appears to be extended in the late VLT image.
4.2 Observed Darkness
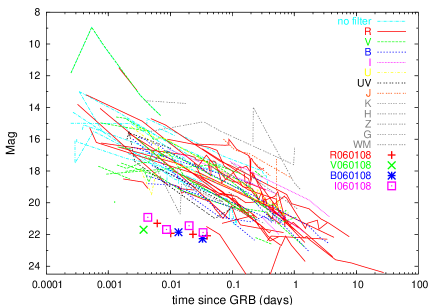
Figure 7 shows the lightcurve of GRB 060108 in the broader context of other GRBs. One peculiar characteristic of this event is that, although the burst is detected in the bands at later times, the UVOT does not observe any optical/UV emission within the first s (i.e. during the tail of the prompt emission where internal shocks are expected to occur).
In order to investigate the possible reason for this behaviour, we can compare the relative faintness of GRB 060108 with other bursts using the X-ray flux versus gamma-ray fluence and the optical flux versus X-ray flux plots published by Roming et al. (2006). In the case of GRB 060108, at 1 hr after the burst the X-ray flux is erg cm-2s-1 and the gamma-ray fluence is erg cm-2 (in the 2-10 keV and 15-350 keV bands, respectively). As we can see from the Figure 3 of Roming et al. (2006), this burst is not unusual and sits solidly within 2 of the mean, although overall it is slightly fainter in both and X-rays compared to other GRBs. We therefore expect a typical behaviour also in the optical emission (perhaps with a slightly fainter optical afterglow than other bursts). If we compare the X-ray and optical fluxes at 1 hour after the trigger (when the optical flux is Jy), we find values within the range of the population with a slight X-ray to optical excess. Similarly, if we extrapolate the optical point at 11 hours, we find an optical flux of Jy, while the X-ray flux is erg cm-2s-1. Although we caution that the behaviour of the light curve at 11 hr is not well constrained (see below), if taken face value this would imply that GRB 060108 still lies in the 2 limit, near the region of optically faint events.
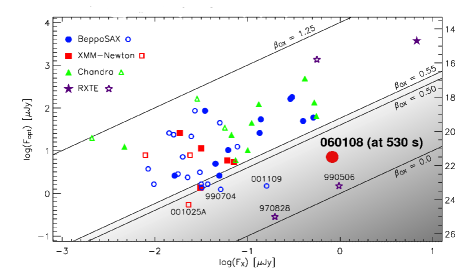
A further way to assess the “darkness” of a GRB has been proposed by Jakobsson et al. (2004) (see also Rol et al. 2005), on the basis of the optical to X-ray spectral properties. According to these authors, a burst can be classified as “truly” dark when . A ratio less than this threshold would be in disagreement with the spectral slopes expected from the synchrotron emission, requiring an intrinsic “lack” of optical emission. Indeed, the ratio of X-ray and band measurements of GRB 060108 provide a value of , as measured at 1000 s after the burst trigger. According to the Jakobsson et al. (2004) classification, this burst is therefore “dark” (see Fig. 8).
In principle, a possible explanation for the “observed darkness” is a large redshift (, Lamb & Reichart 2000, Kawai et al. 2006, Gendre et al. 2006). In such a case the UV light, which is heavily attenuated by intergalactic hydrogen, is redshifted into the optical band. The burst would then appear very red. However, the high redshift scenario is ruled out in this case as we observe the afterglow in the band, and we have been able to determine an upper limit of the redshift of by using the photometric redshift technique. High magnetic fields in the ejecta may also restrict the amount of energy transferred to electrons by reverse shocks, inhibiting the optical emission (Zhang & Kobayashi 2005).
Alternatively, the burst could be obscured by dust. Dust would cause extinction of the afterglow and the emission appears reddened as the shorter wavelengths are absorbed more. It is interesting to compare the photoelectric absorption measured from the X-ray spectrum with the reddening inferred from the optical. As discussed in §3.3, by using all data after the flare through to the end of the observations. we have been able to measure a significant column density excess (99% confidence level). Assuming , this yields cm-2.
Light detected in the band, centered on 700 nm in the Earth restframe, is emitted at 233 nm in the burst local frame (by assuming again ). Assuming a SMC extinction curve, and cm-2/mag (Weingartner & Draine 2000), the extinction determined from the optical-IR SED in Section 3 () corresponds to an X-ray derived photoelectric absorbing column density of cm-2, consistent with the X-ray measurement. Note however, that for the SMC metallicity, considerably lower X-ray absorption would be expected for this . This amount of extinction is sufficient to bring the optical emission up to a value compatible with regular Swift bursts. Dust extinction would also alter the spectral index of the optical decay. Our estimated value, if accounted for, would bring the Jakobsson flux ratio above 0.5, thus removing this burst from the optically dark regime.
The possibility that the “observed optical darkness” is caused by intervening dust along the line of sight is also favoured by results from the optical - IR SED modeling. As discussed in § 3.4.1, without accounting for extinction the technique gives a steep , that would be hard to explain in terms of a synchrotron spectrum of the afterglow. When extinction is included, the value of is , which compares better with the observed SED. It can be noticed that the value of is already low, close to synchrotron emission limit of , even after correcting for extinction. The hardness of the spectrum is another factor that contributes to make this burst optically faint.
It would then appear from the arguments above that a likely explanation for the observed darkness is a combination of intrinsic faintness, hard optical to X-ray spectrum and dust extinction.
5 Conclusions
We presented and discussed the gamma-ray, X-ray and UV/optical/infrared observations of the Swift GRB 060108, performed with the instruments on-board the spacecraft as well as the with the ground-based Faulkes Telescope North, United Kingdom Infrared Telescope and Very Large Telescope. GRB 060108 has a moderately faint X-ray afterglow, but very low optical emission, making it one of the “darkest” GRBs ever observed. We suggest that faintness of the optical emission may be due to an intrinsic weakness of the burst and a hard optical to X-ray spectrum, accompanied by some degree of extinction which occurred in the GRB surroundings.
The X-ray light curve shows the typical template discovered by
Swift, characterized by a rapid decay in the first 300 s (commonly
interpreted as the tail of the prompt emission on the basis of the
combined temporal/spectral properties) followed by a flat decay slope
(typical of “refreshed” afterglows).
An X-ray flare is observed at s, although the statistic is low.
The flat decay phase lasts for about 10 ks, after that
the light curve breaks into a steeper segment with a power-law decay
index of , typical of a standard afterglow phase.
A comparison with the optical light curve is quite interesting. While the optical flux after 800 seconds has a slope of , similar to that of the X-ray in the same interval, the decay index before this time is likely to be steeper. This behavior may be explained if we interpret the fast decay as the reverse shock emission, while the later, flatter emission, has the same origin of the X-ray one. A possible rebrightening is visible only in the infrared, although a monotonic decay is not ruled out. A similar feature has been seen in the case of GRB 060206 (Monfardini et al. 2006c). If real, it might indicate a second reverse shock emission, initiated by the 300 s flare. Alternative models able to explain an optical rebrightening include an increase in the density of the medium where the forward shock is produced (Lazzati et al. 2002), or energy injection by late shells (Bjornsson, Gudmundsson & Jóhannesson 2004, Jóhannesson et al. 2006). This last scenario is less likely, because of our finding that the late energy injection is taking place at a steady rate. The coincidence of the rebrightening with the X-ray flare, however, favours the hypothesis of reverse shock.
Another intriguing feature of the optical light curve is the absence of a break in correspondence to the X-ray one at 10 ks, which may be either intrinsic or due to a significant contribution to the optical flux at late times by the host galaxy. However, the poor sampling of the late optical light curve does not allow us to better constrain this behaviour.
The analysis of the optical spectrum, obtained from data gathered 45 minutes after the burst, has allowed us to determine an upper limit of at 90% confidence level, by using a minimization of the observed spectral energy distribution.
The optical afterglow is below the detection limit of the UVOT within 100 s of the burst. This event has shown how observations taken promptly and deeply enough may reveal the interesting behaviour of the early optical emission. In the Swift era, further similar observations are a reality due to the prompt response of both the spacecraft and ground robotic telescopes, as well as due to the possibility to perform deep observations with large telescopes at early times after the trigger.
6 acknowledgements
CGM acknowledges financial support from the Royal Society. SZ thanks PPARC for support through an Advanced Fellowship. KP thanks PPARC for support. AM acknowledges financial support from the Provincia Autonoma di Trento. The Faulkes Telescope is operated with support from the Dill Faulkes Educational Trust. The UKIRT is operated by the Joint Astronomy Centre on behalf of the UK PPARC. VLT observations were carried out under programs 076.A-0392 and 076.D-0667. We acknowledge excellent support from the observing staff in Paranal. We thank the referee, Prof Ralph Wijers, for useful comments and suggestions.
References
- Akerlof et al. (1999) Akerlof, C. et al., 1999, Nature, 398, 400
- Barthelmy et al. (2005) Barthelmy S.D. et al., 2005, ApJ, 559, 710
- Bessel (1979) Bessel, M.S., 1979, PASP, 91, 589
- Barthelmy et al. (2005) Barthelmy, S.D. et al. 2005, Nature,
- Berger et al. (2002) Berger, E. et al., 2002, ApJ, 581, 981
- Berger et al. (2005) Berger, E. et al., 2005, ApJ, 634, 501
- Bertin & Arnouts (1996) Bertin, E., Arnouts, S., 1996, A&AS, 117, 393B
- Bjornsson, Gudmundsson & Jóhannesson (2004) Bjornsson, G., Gudmundsson, E.H., & Jóhannesson, G., 2004, ApJ, 615, L77
- Bloom et al. (2006) Bloom, J.S. et al., 2006, GCN Circ. 4475
- Blustin et al. (2006) Blustin, A.J. et al., 2006, GCN Circ. 4450
- Bromm & Loeb (2002) Bromm, V. & Loeb, A., 2002, ApJ, 575, 111
- Burrows et al. (2005a) Burrows D.N. et al., 2005, Space Science Review, 120, 165
- Burrows et al. (2005b) Burrows D.N., Romano P., Godet O. et al., 2005b, in press in the proceedings of “X-ray Universe 2005” (astro-ph/0511039)
- Butler & Bloom (2006) Butler, N. & Bloom, J.S., 2006, GCN Circ. 4500
- Cardelli et al (1989) Cardelli et al. 1989
- Cool et al. (2006a) Cool R.J. et al., 2006, GCN Circ. 4447
- Cool et al. (2006b) Cool R.J. et al., 2006, AJ, 118, 733
- Costa et al. (1997) Costa,E. et al., 1997, Nature, 387, 783
- Covino et al. (2006) Covino, S. et al., 2006, A&A, in press
- Csabai et al. (2000) Csabai I., et al., 2000, AJ 119, 69
- Dai & Lu. (1998a) Dai Z.G., Lu T., 1998a, A&A, 333, L87
- D’Avanzo et al. (2006) D’Avanzo, P., et al., 2006, GCN Circ. 4501
- De Pasquale et al. (2003) De Pasquale, M. et al., 2003, ApJ, 592, 1018
- De Pasquale et al. (2006) De Pasquale, M et al. 2006, MNRAS, 365, 1031
- Dickey & Lockman (1990) Dickey, J.M., Lockman, F.J., 1990, A&A, 28, 215
- Fernandez-Soto et al. (1999) Fernandez-Soto A., et al., 1999, ApJ 513, 34
- Fioc & Rocca-Volmerange (1997) Fioc M. & Rocca-Volmerange B., 1997, A&A 326, 950
- Fontana et al. (2000) Fontana A., et al., 2000, AJ, 120, 2206
- Fox et al. (2005) Fox, D.B. et al., 2005, Nature, 437, 845
- Fruchter (1999) Fruchter, A.S, 1999, ApJ, 512, L1
- Fukugita et al. (1996) Fukugita, M., Ichikawa, T., Gunn, J.E., Doi, M., Shimasaku, K., Schneider, D.P., 1996, AJ, 111, 1748
- Fynbo et al. (2001) Fynbo, J.U. et al., 2001, A&A, 369, 373
- Gehrels et al. (2004) Gehrels, N. et al., 2004, ApJ, 611, 1005
- Gehrels et al. (2005) Gehrels, N. et al., 2005, Nature, 437, 851
- Gendre et al. (2006) Gendre, B. et al., 2006, A&A, submitted, (astro-ph/0603431)
- Groot et al. (1998) Groot, P.J. et al., 1998, ApJ, 502, L123
- Guidorzi et al. (2005) Guidorzi, C. et al., 2005, ApJ, 630, L121
- Guidorzi et al. (2006a) Guidorzi, C. et al., 2006a, PASP, 118, 288
- Guidorzi et al. (2006b) Guidorzi, C. et al., 2006b, GCN Circ, 4447
- Jakobsson et al. (2004) Jakobsson, P., Hjorth J., Fynbo J.P.U. et al., 2004, ApJ, 617, L21
- Jóhannesson et al. (2006) Jóhannesson, G. et al., 2006, ApJ accepted (astro-ph/0605299)
- Kalberla et al. (2005) Kalberla P.M.W., Burton, W.B., Hartmann, D., et al. 2005, A&A, 440, 775
- Kawai et al. (2006) Kawai, N. et al., 2006, Nature, 440, 184
- Kumar & Panaitescu (2000) Kumar, P., & Panaitescu, A., 2000, ApJ, 541, L51
- Lamb & Reichart (2000) Lamb, D.Q. & Reichart, D.E., 2000, ApJ, 536, 1
- Lamb et al. (2004) Lamb, D.Q. et al., 2004, New Astronomy Reviews, 48, 423L
- Lazzati et al. (2002) Lazzati, D., et al. 2002, A&A, 396, L5
- Lazzati, Covino & Ghisellini (2002) Lazzati, D., Covino, S. & Ghisellini, G., 2002, MNRAS, 330, 583
- Le Borgne & Rocca-Volmerange (2002) Le Borgne D. & Rocca-Volmerange B., 2002, A&A 386, 446
- Levan et al. (2006a) Levan, A. et al. 2006a, GCN Circ. 4503
- Levan et al. (2006b) Levan, A. et al. 2006b, GCN Circ. 4457
- Liang et al. (2006) Liang, E.W., Zhang, B., O’Brien, P.T. et al. 2006, ApJ in press (astro-ph/0602142).
- Melandri et al. (2006) Melandri, A., et al., 2006, A&A in press, (astro-ph/0510604)
- Monfardini et al. (2006a) Monfardini, A. et al., 2006a, GCN Circ. 4502
- Monfardini et al. (2006b) Monfardini, A., et al. 2006b, GCN Circ. 4630
- Monfardini et al. (2006c) Monfardini, A., Kobayashi, S., Guidorzi, C., et al. 2006, ApJ in press, (astro-ph/0603181)
- Nousek et al. (2006) Nousek J. et al., 2006, ApJ, 642, 389
- O’Brien et al. (2006) O’Brien P.T. et al., 2006, ApJ, in press, (astro-ph/0601125)
- Oates et al. (2006) Oates S.R. et al., 2006, GCN Circ. 4443
- Page et al. (2006) Page K.L. et al., 2006, GCN Circ. 4453
- (61) Panaitescu, A., Mészáros, P., Burrows, D., Nousek, J., Gehrels, N., O’Brien, P., Willingale, R., 2006, MNRAS, 369, 2059
- Pedersen et al. (2006) Pedersen et al., ApJ, 636, 381
- Piranomonte et al. (2006) Piranomonte S. et al. 2006, GCN Circ. 4484
- Poole et al. (2005) Poole T.S., et al., ApJ, 636, 381
- Rees & Mészáros P. (1998) Rees M.J., Mészáros P., 1998, ApJ, 496, L1
- Reichart & Price (2002) Reichart D.E., Price. P.A., 2002, ApJ, 565, 174
- Rol et al. (2005) Rol, E., Wijers, R.A.M.J., Kouveliotou, C. et al., 2005, ApJ, 624, 868
- Roming et al. (2006) Roming P. et al., 2006, astro-ph/0509273
- Rowan-Robinson (2003) Rowan-Robinson M., 2003, MNRAS 345, 819
- Sari et al. (1998) Sari R., Piran T., Narayan R., 1998, ApJL, 497, 17.
- Schlegel et al. (1998) Schlegel, M. F., et al., 1998
- Skrutskie et al. (2006) Skrutskie, M. F., et al., 2006 AJ 131, 1163S
- Smith et al. (2002) Smith, J.A. et al., 2002, AJ 123, 2121
- Steele (2004) Steele, I.A., 2004, Astronomische Nachrichten, 325, 519
- Tagliaferri et al. (2005) Tagliaferri, G. et al., 2005, A&A, 443, L1
- van Paradijs (1997) van Paradijs, J. et al., 1997, Nature, 386, 686
- Villasenor et al. (2005) Villasenor, J.S. et al., 2005, Nature, 437, 855
- Weingartner & Draine (2000) Weingartner J.C. & Draine B.T., 2001, ApJ, 548, 296
- Zhang & Mészáros (2001) Zhang B., Mészáros P., 2001, ApJ, 552, L35
- Zhang et al. (2003) Zhang B., Kobayashi S. & Mészáros P., 2003, ApJ, 592, 950
- Zhang & Mészáros P. (2004) Zhang B., Mészáros P., 2004, IJMPA, 19, 15, 2385
- Zhang & Kobayashi (2005) Zhang B., Kobayashi S., 2005, ApJ, 628, 315
- Zhang et al. (2006) Zhang B., Fan Y.Z., Dyks J. et al., 2006, ApJ, 642, 354