A Spectacular Radio Flare from XRF 050416a at 40 days and Implications for the Nature of X-ray Flashes
Abstract
We present detailed optical, near-infrared, and radio observations of the X-ray flash 050416a obtained with Palomar and Siding Springs Observatories as well as the Hubble Space Telescope and Very Large Array, placing this event among the best-studied X-ray flashes to date. In addition, we present an optical spectrum from Keck LRIS from which we measure the redshift of the burst, . At this redshift the isotropic-equivalent prompt energy release was about erg, and using a standard afterglow synchrotron model we find that the blastwave kinetic energy is a factor of 10 larger, erg. The lack of an observed jet break to days indicates that the opening angle is and the total beaming-corrected relativistic energy is erg. We further show that the burst produced a strong radio flare at days accompanied by an observed flattening in the X-ray band which we attribute to an abrupt circumburst density jump or an episode of energy injection (either from a refreshed shock or off-axis ejecta). Late-time observations with the Hubble Space Telescope show evidence for an associated supernova with peak optical luminosity roughly comparable to that of SN 1998bw. Next, we show that the host galaxy of XRF 050416a is actively forming stars at a rate of at least 2 M⊙ yr-1 with a luminosity of and metallicity of . Finally, we discuss the nature of XRF 050416a in the context of short-hard gamma-ray bursts and under the framework of off-axis and dirty fireball models for X-ray flashes.
1 Introduction
Nearly a decade ago, X-ray flashes (XRFs) were observationally recognized as a subclass within the sample of gamma-ray bursts (GRBs) detected by the BeppoSAX Wide-Field Cameras (Heise et al. 2001). The events are distinguished by a prompt spectrum that peaks in the soft X-ray range ( keV), a factor of below the typical values observed for GRBs (Band et al. 1993). Since then, it has been shown that XRFs and GRBs share many observational properties, including prompt emission durations (Sakamoto et al. 2005), redshifts (Soderberg et al. 2004a), broadband afterglows (e.g., XRF 050406, Romano et al. 2006; Schady et al. 2006), and host galaxy properties (Bloom et al. 2003; Jakobsson et al. 2004; Rau, Salvato & Greiner 2005). Moreover, the recent discovery of Type Ic supernovae (SNe) in association with XRFs 020903 (Soderberg et al. 2005b; Bersier et al. 2006) and 060218 (Pian et al. 2006; Mirabal et al. 2006; Modjaz et al. 2006) indicate that XRFs, like GRBs, are produced in massive stellar explosions. Together, these clues strongly suggest that XRFs and GRBs share similar progenitors.
Driven by this progress, several theories have been proposed to explain the soft prompt emission observed for XRFs under the framework of a standard GRB model. One popular idea posits that XRFs are merely typical GRBs viewed away from the collimation axis (e.g., Yamazaki, Yonetoku & Nakamura 2003). In this scenario the prompt emission is primarily beamed away from our line-of-sight, resulting in lower fluence and values for the observed burst. An important implication of the off-axis model is that the early afterglow evolution should be characterized by a rising phase as the jet decelerates and spreads sideways into our line-of-sight (Granot et al. 2002; Waxman 2004; Soderberg et al. 2006e).
Another theory suggests that XRFs are intrinsically different from GRBs in their ability to couple energy to highly-relativistic material. In this scenario, XRFs are produced in explosions characterized by lower bulk Lorentz factors, , than those inferred for typical GRBs, (Zhang, Woosley & Heger 2004). This may be the result of baryon loading of the high-velocity ejecta, a so-called “dirty fireball” (Dermer, Chiang & Böttcher 1999). Generally speaking, low Lorentz factor explosions may be identified through an analysis of their prompt emission since an optically thin spectrum at high energies implies a lower limit on the Lorentz factor (Lithwick & Sari 2001). In the case of X-ray flashes, however, there are generally insufficient high energy photons for this type of analysis. For these events, detailed modeling of the broadband afterglow may be used to place a lower limit on the Lorentz factor.
Here we present an extensive, multi-frequency data set for XRF 050416a at which extends to days after the burst. By combining near-infrared, optical, ultra-violet, radio and X-ray data we present an in-depth analysis of the afterglow, energetics, supernova and host galaxy of XRF 050416a, placing it among the best-studied X-ray flashes to date. Moreover, thanks to our dedicated late-time monitoring campaign, we show that XRF 050416a produced a strong radio flare at days accompanied by a brief plateau phase in the X-ray band. Finally, we discuss the nature of XRF 050416a in the context of off-axis and dirty fireball models for X-ray flashes.
2 Observations
XRF 050416a was discovered by the Swift Burst Alert Telescope (BAT) on 2005 April 16.4616 UT. The ratio of keV and keV channel fluences, , classifies the event as an X-ray flash (Sakamoto et al. 2006). This is consistent with the low peak photon energy, keV (Sakamoto et al. 2006); a factor of lower than the typical values observed for long-duration GRBs (Band et al. 1993) and a factor of larger than the values inferred for XRFs 020903 and 060218 (Sakamoto et al. 2004; Campana et al. 2006)
As discussed by Sakamoto et al. (2006), the prompt emission light-curve is characterized by a relatively smooth, triangular peak which is only detected at energies below 50 keV. The burst duration is sec (15-150 keV), placing it between the classes of short- and long-duration GRBs while the hardness ratio shows a clear softening. In addition, Sakamoto et al. (2006) note two intriguing features of the data: (1) the rise time of the pulse is longer than the decay time, and (2) the cross-correlation lag function (an indication of the spectral softening) is sec, apparently inconsistent with the overall softening trend observed for the light-curves. This lag function estimate is significantly different than the typical values inferred for long-duration GRBs and even more extreme than the zero spectral lags inferred for short-hard bursts (Norris & Bonnell 2006). We note, however, that the spectral lag for XRF 050416a was derived through a comparison of the two softest BAT bands (15-25 and 25-50 keV) and therefore prevents a clear comparison with the spectral lag estimates for other Swift GRBs for which 15-25 and 50-100 keV bands are typically used. Given that the temporal evolution is not strongly variable, this may indicate that the prompt emission was produced by another process (e.g. external shocks, Dermer, Chiang & Böttcher 1999). Finally, we note that this burst is inconsistent with the lag-luminosity correlation for long-duration GRBs which posits that low luminosity bursts such as XRF 050416a have long spectral lags (Norris, Marani & Bonnell 2000).
2.1 Early Optical Observations
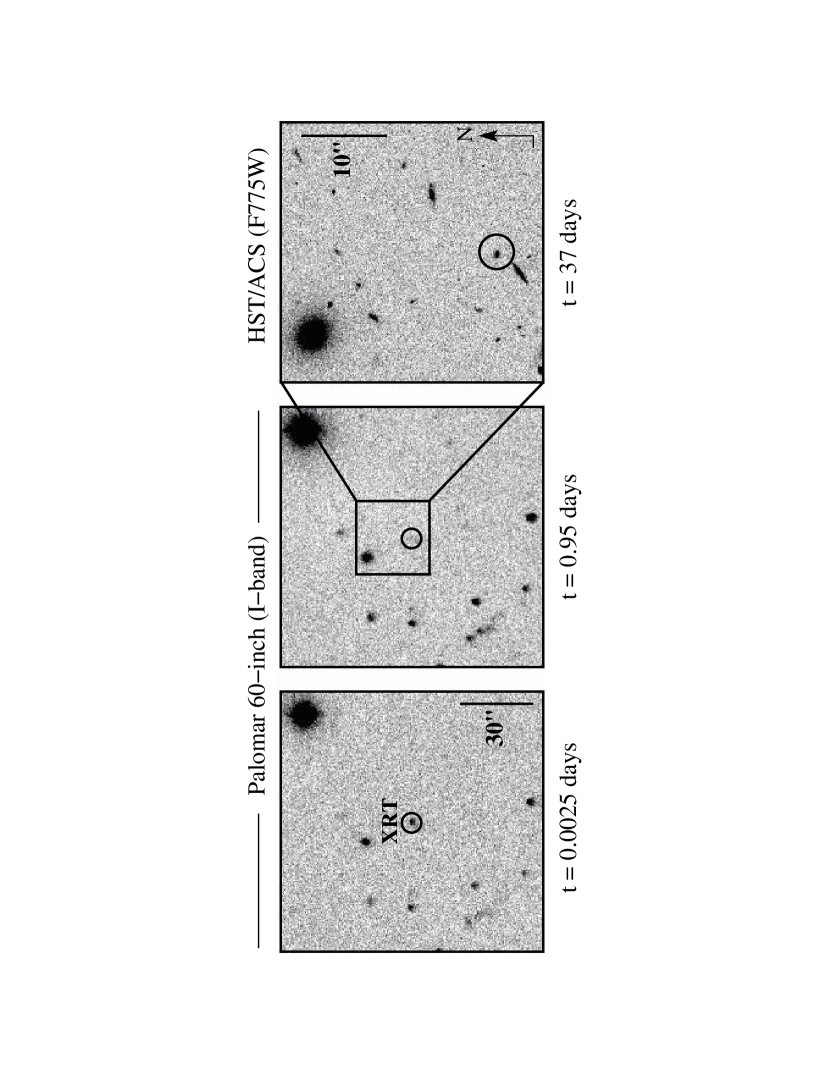
Using the roboticized Palomar 60-inch telescope (P60) we initiated observations of the field of XRF 050416a at 2005 April 16.4634 UT (2.5 minutes after the burst). In our first 120 second image we discovered a new source within the Swift/BAT error circle at , (J2000) with an uncertainty of 0.5 arcsec in each coordinate based on an astrometric tie to the USNO-B catalog (Figure 1). We subsequently monitored the afterglow evolution with the Palomar 60-inch, 200-inch, and Siding Springs 2.3-meter telescopes in the , , and band through days.
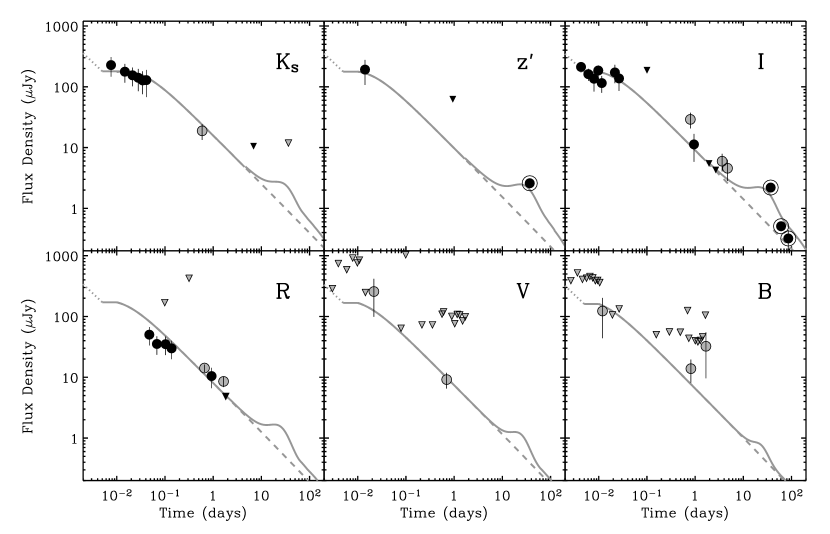
Aperture photometry was performed on each of the images in the standard method using the apphot package within IRAF. Absolute calibration of -, -, and band light-curves was derived using the field calibration of Henden (2005) and utilizing the transformation equations of Smith et al. (2002). The -band light-curve was calibrated against 2MASS using 15 unconfused sources. The errors resulting from calibration uncertainty () were added in quadrature to the measurement errors. As shown in Figure 2 and Table 1, the afterglow was mag at min (mid-exposure).
We supplement these NIR/optical afterglow data with additional measurements from the GCNs (Li et al. 2005; Price et al. 2005; Qiu et al. 2005; Torii 2005; Yanagisawa, Toda & Kawai 2005) and those reported by Holland et al. (2006), obtained with the Swift/UVOT and 1.54-m Danish Telescope. The resulting dataset spans 1930Å (Swift/UVOT UVW2) to 22000Å (); however, we note that the majority of the UV observations are upper limits. Using this extended dataset we measure the temporal and spectral properties of the NIR/optical afterglow emission. We find the following NIR/optical power-law decay indices (, where ) between and 1 day: , , , , , consistent with the values reported by Holland et al. (2006). These values imply a mean temporal index of .
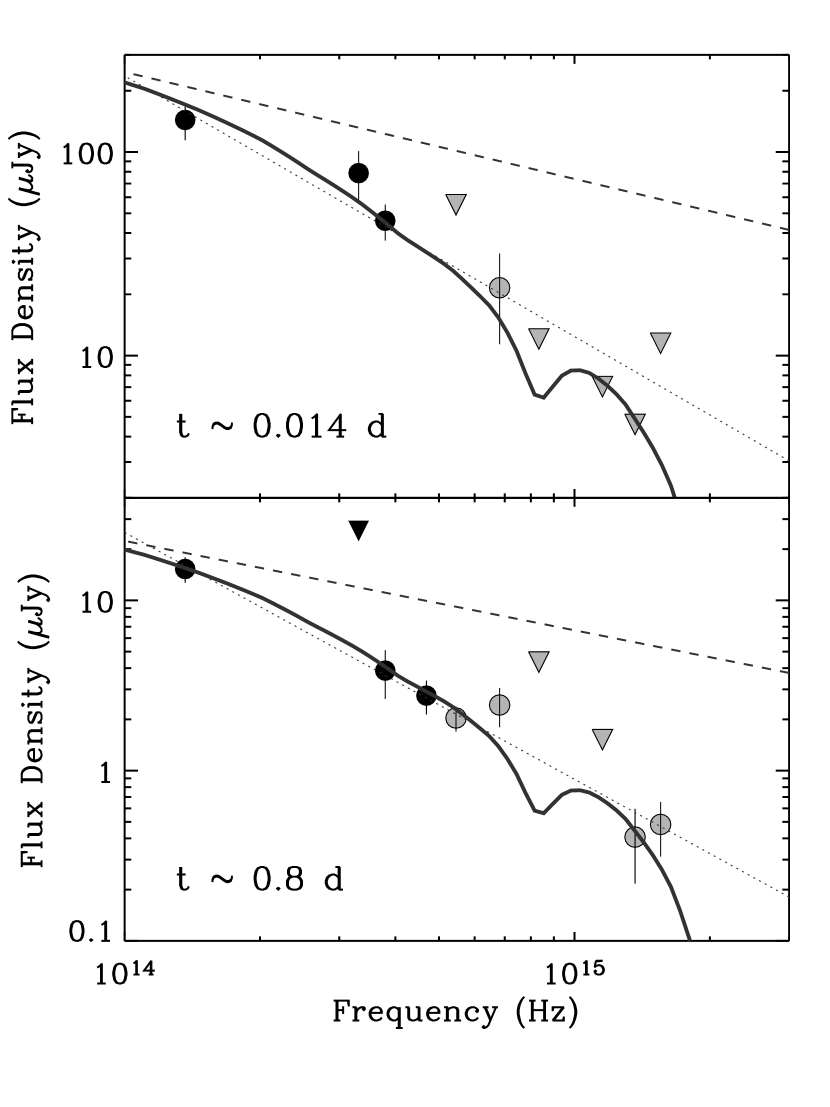
Finally, we analyze the spectral index ( with ) within the NIR/optical bands. As shown in Figure 3 there are two epochs at which the photometric spectrum is well-sampled: and 0.8 days. We fit each of the observed spectra with a simple power-law and find () and () for the first and second epochs, respectively. As will be discussed in §3.1, the observed steep spectrum is indicative of extinction within the host galaxy.
2.2 Late-time Observations with HST
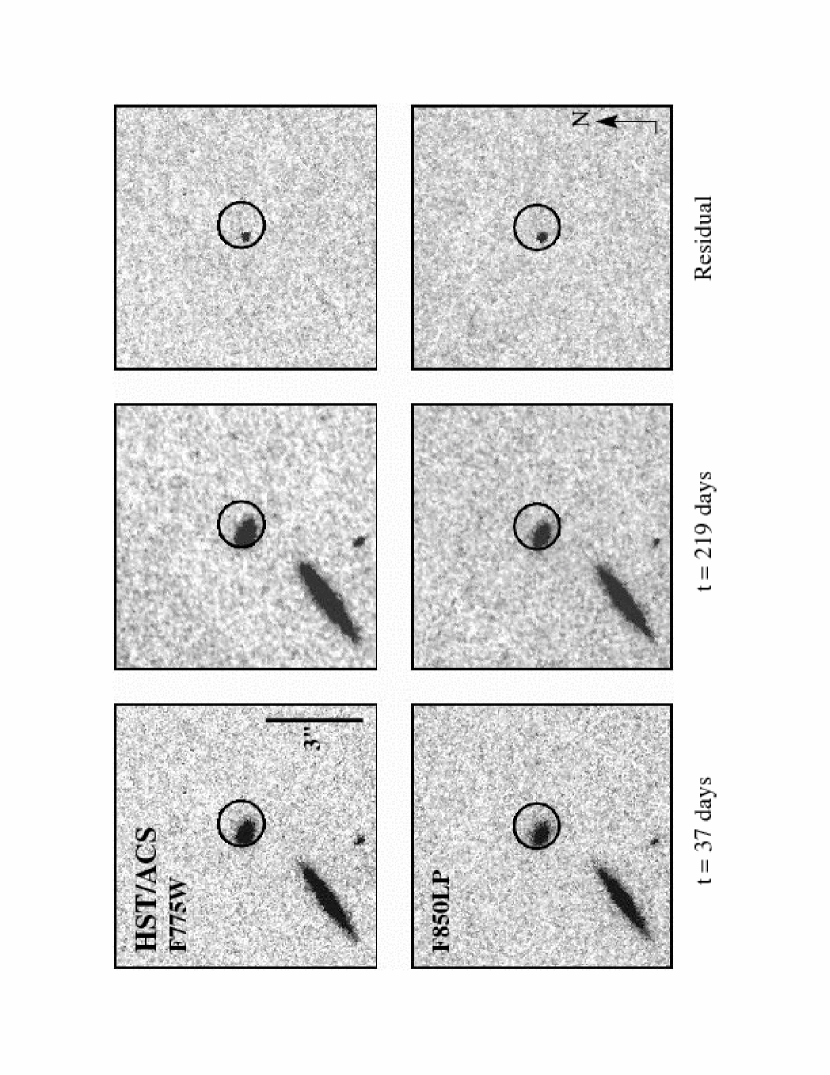
Using the Wide-Field Camera (WFC) of the Advanced Camera for Surveys (ACS) on-board the Hubble Space Telescope (HST), we imaged the field of XRF 050416a four times, spanning 37 to 219 days after the burst. Each epoch consisted of two or four orbits during which we imaged the field in filters F775W and/or F850LP, corresponding to SDSS - and - bands, respectively.
The HST data were processed using the multidrizzle routine (Fruchter & Hook 2002) within the stsdas package of IRAF. Images were drizzled using pixfrac=0.8 and pixscale=1.0 resulting in a final pixel scale of 0.05 arcsec/pixel. Drizzled images were then registered to the final epoch using the xregister package within IRAF. We astrometrically tied the HST and P60 images using 12 unconfused sources in common resulting in a final systematic uncertainty of 0.70 arcsec ().
To search for source variability and remove host galaxy contamination, we used the ISIS subtraction routine by Alard (2000) which accounts for temporal variations in the stellar PSF. Adopting the final epoch observations as templates we produced residual images. These residual images were examined for positive sources positionally coincident with the P60 afterglow.
Photometry was performed on the residual sources within a 0.5 arcsec aperture. We converted the photometric measurements to infinite aperture and calculated the corresponding AB magnitudes within the native HST filters using the aperture corrections and zero-points provided by Sirianni et al. (2005). Here we made the reasonable assumption that the transient flux is negligible in the template images. For comparison with ground-based data, we also converted the F775W measurements to Johnson -band (Vega) magnitudes using the transformation coefficients derived by Sirianni et al. (2005) and assuming the source spectrum implied by the first epoch HST data.
As shown in Table 2 and Figure 4, the transient is clearly detected in the first epoch HST residual images. An astrometric tie between the first and final epochs shows that the residual is offset arcsec from the center of the host galaxy. Our residual images show the source to be F775W and F850LP mag in the AB system ( mag in the Vega system) at days. As shown in Figure 2, these values are a factor of above an extrapolation of the early afterglow decay. The observed spectral index between the F775W and F850LP filters is , significantly steeper than the afterglow spectrum observed at early time (§2.1 and Figure 3) as well as the typical values measured for NIR/optical afterglows (; Panaitescu & Kumar 2002; Yost et al. 2003). As will be discussed in §4.4, the timescale and spectral signature of the observed flux excess are suggestive of a thermal supernova component.
2.3 Spectroscopic Observations
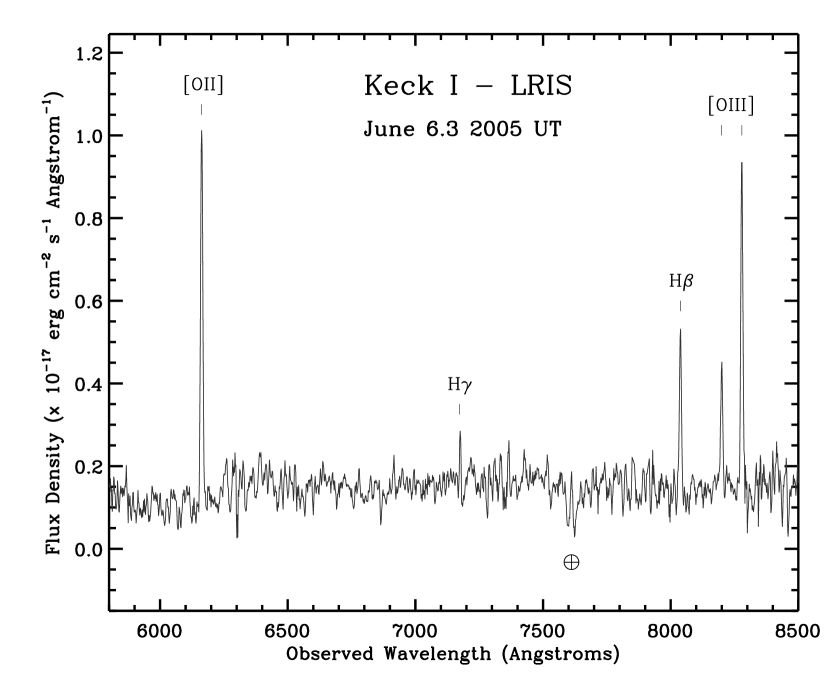
We observed the host galaxy of XRF 050416a with the Low Resolution Imaging Spectrograph on Keck I on 2005 June 6.3 UT ( days). We placed a 1.0 arcsec longslit across the host galaxy at a position angle of PA=. Data were reduced in standard manner using the onedspec and twodspec packages within IRAF. Flux calibration was performed using the spectrophotometric standard star BD+284211.
As shown in Figure 5 and Table 3, we detect several strong emission lines in the spectrum including H, H, [O II], and [O III] at a redshift of . Adopting the standard cosmological parameters (, , ), the isotropic gamma-ray energy release is erg (1 keV – 10 MeV; Sakamoto et al. 2006). Compared with typical long-duration bursts, the prompt energy release of XRF 050416a is a factor of lower (Frail et al. 2001; Bloom, Frail & Kulkarni 2003; Amati 2006 and references therein).
2.4 Radio Observations
We began observing XRF 050416a with the Very Large Array111The Very Large Array and Very Long Baseline Array are operated by the National Radio Astronomy Observatory, a facility of the National Science Foundation operated under cooperative agreement by Associated Universities, Inc. (VLA) on 2005 April 16.49 UT ( min). No radio source was detected coincident with the optical position to a limit of Jy at GHz. However, further observations at days revealed a new radio source with Jy coincident with the optical and X-ray afterglow positions at , (J2000) which we identify as the radio afterglow.
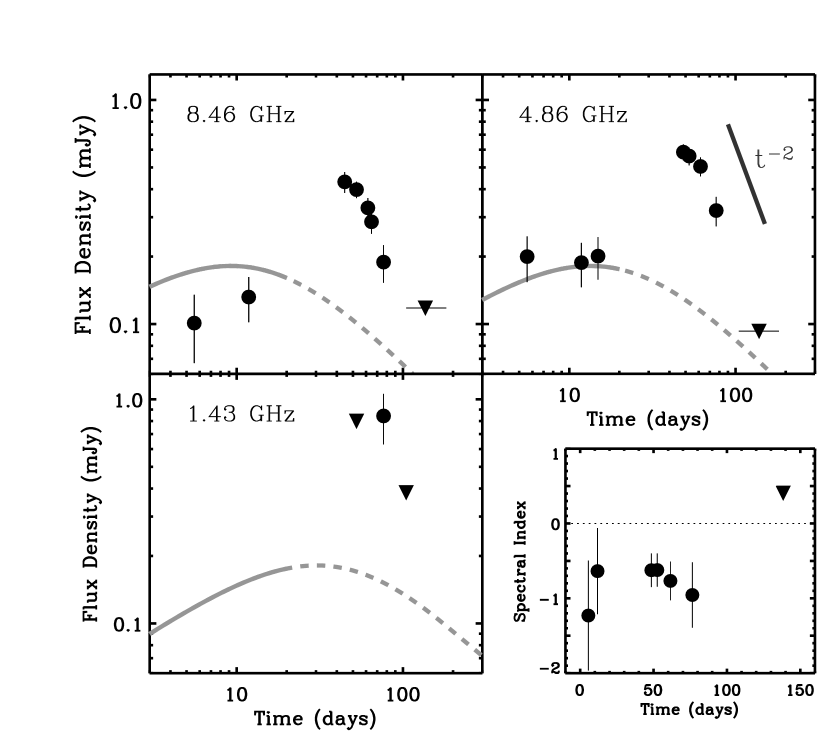
We continued to monitor the radio afterglow at 1.43, 4.86 and 8.46 GHz through days (Table 4). All observations were taken in standard continuum observing mode with a bandwidth of MHz. We used 3C286 (J1331+305) for flux calibration, while phase referencing was performed against calibrators J1221+282 and J1224+213. The data were reduced using standard packages within the Astronomical Image Processing System (AIPS).
As shown in Figure 6, the evolution of the radio afterglow is dissimilar from those of typical GRBs and inconsistent with a standard blastwave model. Between and 40 days an abrupt rebrightening (factor of ) is observed at all radio bands with a temporal index steeper than . Following this radio flare the emission decays rapidly with an index of . The peak radio luminosity at 8.46 GHz, , is typical for GRBs (Frail et al. 2003), a factor of and larger than those of XRFs 020903 and 060218, respectively (Soderberg et al. 2004a, 2006c), and between and times higher than the peak radio luminosities observed for optically-selected Type Ibc supernovae (Soderberg 2006). By days the radio afterglow is no longer detected at any frequency.
2.5 X-ray Observations
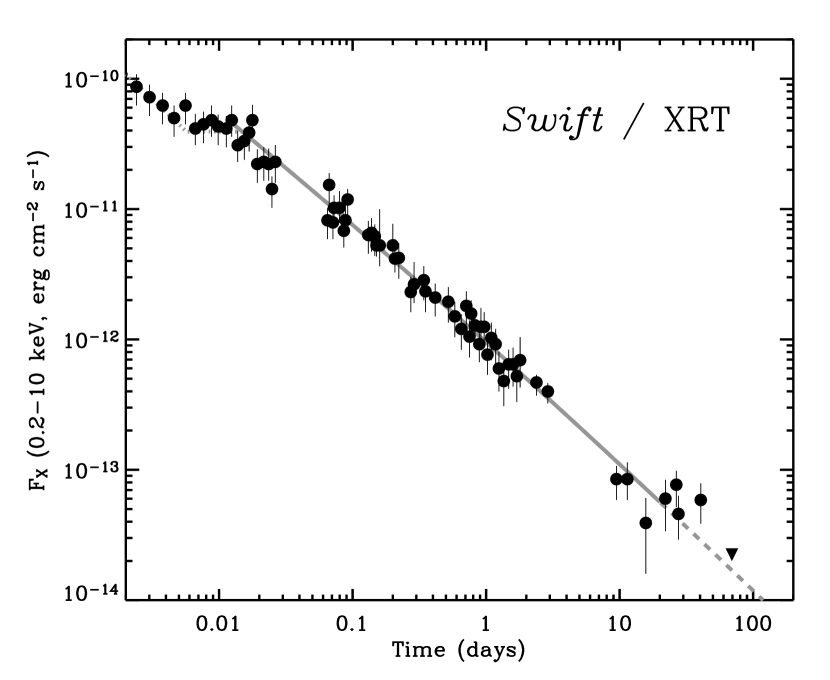
The afterglow of XRF 050416a was observed with the Swift X-ray Telescope (XRT) beginning minutes after the burst and continuing through days, placing it among the best studied X-ray afterglows to date (Nousek et al. 2006; O’Brien et al. 2006). From their analysis of the XRT data, Mangano et al. (2006) report a spectral index of and evidence for significant absorption in the host galaxy, , corresponding to assuming the conversion of Predehl & Schmitt (1995) and a Milky Way extinction curve (Pei 1992). As shown in Figure 7, at hours the X-ray luminosity was , placing it at the lower edge of the observed distribution for GRBs (Berger, Kulkarni & Frail 2003; Freedman & Waxman 2001).
As discussed by Mangano et al. (2006) and shown in Figure 7, the early evolution of the X-ray afterglow can be characterized by three phases: (1) an initial steep decay (2) a flattening between and 20 minutes during which the flux is roughly constant, and (3) a resumed decay through days. These three phases have been shown to be ubiquitous among Swift X-ray afterglows (Nousek et al. 2006). However, at days there is a second flattening which continues through days. By days the X-ray afterglow is no longer detected, implying a significant steepening to between the last two observations. We note that the timescale for the X-ray flattening and subsequent steep decay is coincident with the observed radio flare.
3 Properties of the Early Afterglow
Using the detailed multi-frequency observations of the XRF 050416a afterglow we can constrain the physical properties of the ejecta and the circumburst density. We adopt a standard relativistic blastwave model in which the afterglow emission is produced through the dynamical interaction of the ejecta with the surrounding medium (the forward shock, FS) with an additional component from shock heating of the ejecta (the reverse shock, RS). In this scenario, the total energy density is partitioned between relativistic electrons, , and magnetic fields, , while the thermal energy of the shocked protons accounts for the fraction remaining (see Piran 1999 for a review). The shocked electrons are accelerated into a power-law distribution, above a minimum Lorentz factor, . The emission resulting from the forward and reverse shock components is described by a synchrotron spectrum characterized by three break frequencies — the self-absorption frequency, , the characteristic frequency, , and the cooling frequency, — and a flux normalization, (Sari, Piran & Narayan 1998). In modeling the afterglow spectral and temporal evolution, we adopt the formalism of Granot & Sari (2002) for a relativistic forward shock expanding into a constant density circumburst medium.
3.1 Preliminary Constraints
In fitting the forward shock model to the afterglow data of XRF 050416a we use only observations between 0.014 and 20 days when the afterglow follows a simple power-law evolution. To constrain the spectrum of the forward shock, we first investigate the afterglow evolution in the optical and X-ray bands. As shown in Figure 7, the X-ray data between 0.014 and 20 days are reasonably fit with (). Mangano et al. (2006) report that the X-ray spectral index on this same timescale is , leading to . A comparison to the standard closure relations, () and () indicates that . This conclusion is supported by the near-IR to X-ray spectral slope, at days, which is flatter than as expected if . Therefore, the X-ray observations suggest that .
Next we consider the spectral index within the NIR/optical bands. As discussed in §2.1 and shown in Figure 3, the observed NIR/optical spectral index on this timescale is to . These values are significantly steeper than and imply that the optical flux is suppressed by host galaxy extinction. Making the reasonable assumption that on the timescale of our afterglow observations, and adopting as indicated by the X-ray observations, we estimate for the intrinsic spectral index of the NIR/optical afterglow. Adopting this value for , we find that both NIR/optical spectra are reasonably fit with a Galactic extinction of (Schlegel, Finkbeiner & Davis 1998) and a host galaxy component of (Figure 3). Here we have assumed a Milky Way extinction model for the host (Pei 1992) but note that a comparable fit may be obtained for an SMC extinction curve. We further note that this optically-derived extinction estimate is lower than that inferred from the X-ray spectrum (Mangano et al. 2006), consistent with the trend observed for long-duration GRBs Galama & Wijers (2001).
With this extinction correction, the near-IR to X-ray spectral index becomes , consistent with our estimate for the intrinsic spectral index within the NIR/optical band. Moreover, the extinction-corrected NIR/optical spectral index and observed average temporal index of are consistent with the standard closure relation: . We also note that this supports our assumption of a constant density medium since in a wind environment the expected temporal index is steeper than , and thus inconsistent with the observed values. Using all the available optical and X-ray observations we estimate that Hz at day.
Next we compare the near-IR and radio afterglow data to constrain and the peak spectral flux, . Assuming that passed through the NIR/optical bands near the time of our first -band observations implies that the peak spectral flux is roughly comparable to the extinction-corrected flux: Jy at minutes. Here we focus on the -band data since they are the least sensitive to host galaxy extinction, which we estimate to be mag (a increase in flux) for . Scaling these constraints to day ( and ) and accounting for the smooth shape of the spectral peak, we find Hz and . Here and throughout, is the asymptotic extrapolation of the smooth spectrum peak and is therefore slightly higher than the intrinsic peak flux. We note that since the NIR/optical data require , lower values of imply increasingly higher values of at the time of the first -band observations.
Finally, we test that these constraints are consistent with the radio observations. Given the evolution of , these constraints predict that the spectral peak should pass through the radio band at days with an extrapolated peak flux density of Jy, roughly consistent with the 4.86 GHz observations on this timescale. We emphasize that the early steady decay of the NIR/optical data require that passes through the radio no later than 13 days. Finally, we note that the radio spectrum is optically thin throughout the timescale of VLA monitoring (see Figure 6) and thus we observationally constrain to be below 1.43 GHz.
3.2 Forward Shock Broadband Model
Adopting these constraints we apply a broadband afterglow model fit to the multi-frequency data in order to determine the physical parameters of the burst. The four spectral parameters (, , and ) are fully determined by four physical parameters: the isotropic ejecta energy, , the energy density partition fractions, and , and the circumburst density, . Therefore by constraining the four spectral parameters through broad-band observations, we are able to determine a unique solution for the four physical parameters (see Sari, Piran & Narayan 1998 and Piran 1999 for reviews). Although the radio observations provide only an upper limit on , we are able to define a range of reasonable values by requiring that , which accounts for an equal or greater contribution from shocked protons. This requirement excludes unphysical solutions in which the sum of the contributions from shocked electrons, protons and magnetic fields exceed the total energy density. Combined with the observed constraints for , and we find the following ranges for the physical parameters:
| (1a) | |||
| (1b) | |||
| (1c) | |||
| (1d) | |||
As shown in Figures 2, 6, and 7, this model provides an adequate fit to the broadband data between and 20 days.
3.3 Collimation of the Ejecta and Viewing Angle
The lack of an observed jet break in the X-rays to days, together with the inferred physical parameters constrain the opening angle of the jet (e.g. Sari, Piran & Halpern 1999) to degrees. Here, is the jet break time in days and we have adopted the notation . This limit is slightly larger than the median of the jet opening angles inferred for long-duration GRBs, (Bloom, Frail & Kulkarni 2003; Ghirlanda, Ghisellini & Lazzati 2004; Soderberg et al. 2006a and references therein). This indicates that the beaming-corrected ejecta energy release is erg where the range includes the uncertainty in and the lower limit on . Moreover, we expect the blastwave to become non-relativistic on a timescale yrs (Livio & Waxman 2000). On a similar timescale, the ejecta are predicted to approach spherical symmetry after which the blastwave evolution is well described by the Sedov-von Neumann-Taylor (SNT) solution (Zel’dovich & Raizer 2002; Frail, Waxman & Kulkarni 2000); in this regime the afterglow emission decays with () for frequencies below (above) the cooling frequency.
Next, the early steady decay of the X-ray and NIR/optical afterglow indicates that the jet collimation axis is directed roughly along our line-of-sight. In comparison, GRBs viewed significantly off-axis () are predicted to show a rising afterglow light-curve as the jet spreads sideways and intersects our viewing angle (Granot et al. 2002; Waxman 2004; Soderberg et al. 2006e). Here, is the angle between our line-of-sight and the jet collimation axis. We conclude that the ejecta are viewed roughly on-axis and therefore the inferred beaming-corrected energies are not affected significantly (if at all) by viewing angle effects.
4 Properties of the Late-time Afterglow
Next we address the nature of the late-time broadband afterglow evolution with special attention to the strong radio flare observed at days. Radio flares have been noted for several other GRBs, though only at early times (e.g. GRB 990123 at day; Kulkarni et al. 1999). Based on their observed timescale and evolution, radio flares are typically attributed to emission from the reverse shock (Sari & Piran 1999). Here we present detailed radio observations for XRF 050416a which show for the first time a strong radio flare at late time. Possible causes for a late-time radio rebrightening include the emission from a decelerating jet initially directed away from our line-of-sight (Waxman 2004; Li & Song 2004), circumburst density variations (Wijers 2001; Ramirez-Ruiz et al. 2001), and energy injection from a slow shell catching up to and refreshing the afterglow shock (Rees & Meszaros 1998). We discuss each of these possibilities below.
4.1 Off-axis Jet Emission
It has been shown that the observational signature of a relativistic jet viewed significantly away from our line-of-sight is a rapid achromatic rise in the early afterglow light-curves (Paczynski 2001; Granot et al. 2002; Waxman 2004). In this scenario, the observed peak of the afterglow emission occurs as the spreading jet crosses our viewing angle. The timescale for this peak is days for a GRB jet with typical parameters ( erg, , , ) viewed from an angle (Soderberg et al. 2006e). The subsequent afterglow evolution is the same as that seen by an on-axis observer, decaying steeply with to for frequencies above (Sari, Piran & Halpern 1999). The observed timescale and evolution of the XRF 050416a radio flare are therefore roughly consistent with the predictions of an off-axis relativistic jet.
However, as noted by Mangano et al. (2006) and discussed in §3.3, the early and steady decay of the XRF 050416a broadband afterglow implies the presence of relativistic ejecta directed along our line-of-sight. These ejecta are also responsible for the production of the observed prompt emission. Attributing the strong late-time radio flare to an energetic off-axis relativistic jet therefore implies that multiple relativistic ejecta components were produced in the explosion. Moreover, the steep rise and peak flux of the radio flare imply sharp edges for the off-axis jet and a kinetic energy 2 to 3 times larger than that of the on-axis ejecta. While this scenario cannot be ruled out, we consider it unlikely given the complicated ejecta geometry required.
4.1.1 A Receding Jet
Li & Song (2004) describe a related scenario in which a strong late-time radio flare is observed from a receding jet initially directed anti-parallel to our line-of-sight. In this case, early afterglow emission is expected from the approaching jet while emission from the receding jet is expected on a timescale due to the light travel time delay. This scenario is appealing in that it may explain both the early and late-time afterglow emission observed for XRF 050416a within the standard framework of engine-driven (accretion-fed compact source; Piran 1999) double-sided jets. However, as discussed in §3.3, broadband modeling of the afterglow emission predicts the non-relativistic transition to occur no earlier than yrs – too late to explain the radio flare at 40 days. Moreover, the peak emission from a receding jet should be comparable to the radio flux at and decay with a temporal index given by the Sedov solution, (Li & Song 2004); both of these predictions are inconsistent with the observations. We conclude that afterglow emission from a receding jet is unlikely to produce the observed radio flare.
4.2 Circumburst Density Variations
It has been argued that abrupt variations in the circumburst medium can produce a strong rebrightening in the radio afterglows of GRBs. Specifically, the dynamical interaction of the forward shock with a wind-termination shock at pc is predicted to cause a rebrightening of the radio afterglow on a timescale of a few years (Wijers 2001; Ramirez-Ruiz et al. 2001, 2005). Here it is assumed that the blastwave is expanding non-relativistically when it encounters the density jump, overall consistent with the observed timescales for non-relativistic transitions (Frail, Waxman & Kulkarni 2000; Berger, Kulkarni & Frail 2004; Frail et al. 2005). For comparison, the interaction of a relativistic blastwave with an abrupt (step function) density jump is not expected to cause strong variations in the afterglow light-curves, where here it has been assumed that the post-jump expansion is also relativistic (Nakar & Granot 2006).
In the case of XRF 050416a, the strong radio flare and X-ray plateau phase occur on a timescale when the blastwave is still relativistic, and therefore an abrupt circumburst density jump appears an unlikely explanation. This is supported by the fact that during the relativistic regime, the flux at frequencies above should be unaffected by circumburst density variations (Granot & Sari 2002). We speculate, however, that a very large density jump may be able to decelerate the blastwave to non-relativistic speeds on a very short timescale and may therefore be able to explain the unusual late-time afterglow evolution. The increase in density would cause a shift in which may explain the peculiar evolution of the spectral index in the radio band (Figure 6). Based on our afterglow modeling (§3.2), we estimate that the circumburst radius of the forward shock at the onset of the radio flare was roughly pc, roughly consistent with the radius of a wind-termination shock (Garcia-Segura, Langer & Mac Low 1996; Chevalier, Li & Fransson 2004). In this scenario, we expect a post-jump self-similar evolution consistent with the Sedov-Taylor solution. Since the late-time radio and X-ray data are not sufficiently sensitive to trace the post-flare evolution, we cannot rule out this possibility.
Finally, we investigated a scenario where the radio/X-ray flare is produced by the dynamical interaction of the quasi-spherical, non-relativistic SN ejecta with a CSM density enhancement. In fact, density jumps have been invoked to explain radio modulations observed for local (non-relativistic) SNe Ibc (e.g. SN 2003bg; Soderberg et al. 2006b). Adopting a simple minimum energy calculation (Kulkarni et al. 1998) and requiring that the shock energy is equally partitioned between magnetic fields and relativistic electrons, we find that attributing the strong radio emission to the quasi-spherical SN component requires that the SN ejecta is relativistic () at the time of the radio/X-ray flare. However, as discussed above, strong flux variations are not expected while the blastwave is relativistic. Combined with the fact that the flare is at least a factor of more radio luminous than any other SN Ibc ever observed (including GRB-SN 1998bw, Kulkarni et al. 1998), we conclude that the radio/X-ray flare can not be attributed to the quasi-spherical SN ejecta.
4.3 Energy Injection
An episode of energy injection may also cause a rebrightening of the afterglow flux. Energy injection may arise from long-lived central engine activity or under the framework of a “refreshed” shock where a slow moving shell ejected during the initial burst eventually catches up with the afterglow shock (Rees & Meszaros 1998; Granot, Nakar & Piran 2003). The observed ratio of the settling time to the epoch of injection, , can distinguish between these two scenarios. For the injection is produced by engine activity, while indicates a refreshed shock. In the case of XRF 050416a, the X-ray and radio data after 20 days imply , suggesting that the ejecta were refreshed on this timescale.
As shown in Figure 6, an extrapolation of the early radio evolution lies a factor of below the observed flux at the onset of the radio flare. An energy increase affects the spectral parameters according to the following scalings: , , , and (Granot & Sari 2002). Given that is within the radio band on this timescale we have and thus the radio flare corresponds to an energy injection of a comparable factor, . For the X-ray band, , thus for an energy injection of a factor of corresponds to a comparable increase in the X-ray flux. The Swift/XRT observations suggest a flattening on this timescale. Here we adopt the conservative assumption that the shock microphysics (, and ) do not evolve during the energy injection.
One important implication of the energy injection model is that the post-injection asymptotic temporal decay should be the same as that before the injection. This prediction is consistent with the energy injection episodes invoked for GRBs 021004 and 030329 (Björnsson, Gudmundsson & Jóhannesson 2004; Granot, Nakar & Piran 2003). However, in the case of XRF 050416a, the late-time radio and X-ray data suggest a steep post-injection decay, , significantly steeper than that observed pre-injection. Moreover, the afterglow should asymptotically approach a flux normalization larger by a factor of in both the radio and X-ray bands. As shown in Figures 6 and 7, this appears inconsistent with the observations which suggest that the late-time afterglow is comparable (or fainter) than an extrapolation of the early afterglow model. We note, however, that the faintness of the late-time afterglow and the steep post-injection decay may be explained if a jet break occurred on roughly the same timescale as the energy injection.
In comparison with other late-time afterglow studies (Frail, Waxman & Kulkarni 2000; Tiengo et al. 2003; Berger, Kulkarni & Frail 2004; Kouveliotou et al. 2004; Frail et al. 2005), the radio flare and X-ray flattening observed for XRF 050416a are clearly atypical for long-duration GRBs. We therefore attribute the observed evolution to an unusual scenario involving either a large circumburst density jump or a late-time injection of energy (from a slow shell or off-axis ejecta).
4.4 An Associated Supernova
The HST measurements at late-time can be used to constrain any possible contribution from an associated supernova. Based on previous studies of GRB-SNe, the thermal emission from an associated supernova is predicted to reach maximum light on a timescale of days with a peak magnitude of mag or fainter (Zeh, Klose & Hartmann 2004; Soderberg et al. 2006d and references therein). Observationally, the emergence of a SN component produces a steepening of the optical spectrum as the supernova nears maximum light and dominates the afterglow emission.
An extrapolation of the broadband afterglow model to days shows that the HST data are brighter by a factor of . For comparison, the radio flare and X-ray plateau on this same timescale represent flux density enhancements by factors of roughly and 2, respectively.
As discussed in §2.2 we measure the spectrum of the optical transient within the ACS bands and find at 37 days. After correction for extinction (see §2.1), the implied spectral index becomes . For comparison, the spectral index between the radio and X-ray bands on this timescale (coincident with the radio flare and X-ray flattening) is and the indices within the bands are (Figure 6) and (Mangano et al. 2006), respectively. Given that the HST derived spectral index, even after correction for extinction, is (1) significantly steeper than the NIR/optical index observed at early time, , (2) significantly steeper than measured at a comparable epoch, and (3) inconsistent with the range of synchrotron spectral indices predicted for a relativistic blastwave (, Sari, Piran & Narayan 1998), we conclude that the optical flux at days is dominated by another emission process, likely an associated SN.
Next, to determine if the late-time optical data are consistent with the temporal evolution of a typical GRB/XRF-associated supernova, we compare the HST flux values with synthesized SN light-curves. We compiled UBVRIJHK observations of SN 1998bw from the literature (Galama et al. 1998; McKenzie & Schaefer 1999; Patat et al. 2001) and smoothed the extinction-corrected (Galactic component of E(B-V)=0.059, Schlegel, Finkbeiner & Davis 1998) light-curves. Here we assume that the SN 1998bw host-galaxy extinction is negligible, consistent with the findings of Patat et al. (2001) based on a spectroscopic analysis of the host galaxy. We then produced -corrected NIR/optical light-curves of SN 1998bw at the redshift of XRF 050416a by interpolating over the photometric spectrum and stretching the arrival time of the photons by a factor of .
Shown in Figure 2 are the synthesized light-curves for SN 1998bw at , summed together with the afterglow model. The HST data are roughly comparable with the flux normalization and evolution of the summed model. Therefore, the temporal and spectral properties of the HST data suggest that XRF 050416a was associated with a supernova similar to SN 1998bw. However, we caution that the temporal coincidence of the SN peak with the radio flare makes it difficult to estimate the relative contributions of the SN and afterglow.
5 Host Galaxy Properties
We now turn to the properties of the GRB host galaxy. We measure the brightness of the host galaxy in the final HST epoch to be F775W mag ( mag). These values are not corrected for extinction. At the rest-frame -band is traced by the observed F775W band, leading to an absolute magnitude, mag, or a luminosity . This host luminosity is similar to that inferred for XRF 030528 (Rau, Salvato & Greiner 2005) and the hosts of typical GRBs (Le Floc’h et al. 2003). At , the measured offset of the optical transient (§2.1) relative to the center of the host galaxy corresponds to pc. This offset is a factor of smaller than the median value for long-duration GRBs (Bloom, Kulkarni & Djorgovski 2002).
As shown in Figure 5, the host exhibits several emission lines typical of star-forming galaxies. We estimate the star formation rate in the host galaxy from the observed fluxes of the various emission lines. Using the flux of the [O II] line, erg cm-2 s-1 (Table 3), and the conversion of Kennicutt (1998), M⊙ yr-1, we find a star formation rate of about M⊙ yr-1. From the H line flux, erg cm-2 s-1, and assuming the Case-B recombination ratio of and the conversion of Kennicutt (1998), we infer a star formation rate of M⊙ yr-1. Thus, we conclude that the star formation rate (not corrected for extinction) is roughly M⊙ yr-1. We note that the observed ratio of H/H compared to the theoretical value of about (Osterbrock 1989) suggests a significant extinction correction (factor of ) following the method of (Calzetti, Kinney & Storchi-Bergmann 1994). We conclude that the star formation rate for the host of XRF 050416a is similar to those inferred for long-duration GRBs (Christensen, Hjorth & Gorosabel 2004; Berger et al. 2003a) and at least an order of magnitude larger than that inferred for XRF 020903 (Soderberg et al. 2004a; Bersier et al. 2006).
The combination of the inferred star formation rate and host luminosity provides a measure of the specific star formation rate. We find a value of M⊙ yr-1 */ (uncorrected for extinction), which is about a factor of two lower than the mean specific star formation rate for the hosts of long-duration GRBs (Christensen, Hjorth & Gorosabel 2004).
Next, we use the relative strengths of the oxygen and hydrogen emission lines to infer the ionization state and oxygen abundance. The relevant indicators are and . Using the calibrations of McGaugh (1991) and Kobulnicky & Kewley (2004) we find that for the upper branch the metallicity is while for the lower branch it is about 7.9; the two branches are due to the double-valued nature of in terms of metallicity. Thus, the host metallicity of XRF 050416a is , larger than that inferred for XRF 060218 (Modjaz et al. 2006; Wiersema et al. 2007) and comparable to that for XRF 030528 (Rau, Salvato & Greiner 2005). Moreover, this range is somewhat higher than the typical metallicities for GRB hosts, some of which have metallicities that are solar (e.g., Prochaska et al. 2006).
6 Is XRF 050416a a Short Burst?
With a prompt emission duration of just T sec (Sakamoto et al. 2006), it is interesting to consider XRF 050416a as a member of the short-hard class of gamma-ray bursts, popularly believed to result from the coalescence of neutron stars or black holes (e.g., Eichler et al. 1989). Based on the bi-modal BATSE duration distribution, bursts with seconds are assumed to belong to the long-duration class (Kouveliotou et al. 1993), although a decomposition of the overlapping distributions suggests that a small fraction of short-hard bursts (SHBs) have durations longer than this cut-off. The distinction between short-hard and long-duration bursts is further complicated by the detection of soft X-ray tails lasting several seconds following SHBs 050709 and 050724 (Villasenor et al. 2005; Barthelmy et al. 2005). This suggests that SHBs are not necessarily characterized by a pure hard emission spectrum (Sakamoto 2006). Related to this issue is the use of spectral lags to distinguish between long and short bursts. As discussed by Norris & Bonnell (2006), long-duration bursts typically have longer lags that correlate with isotropic equivalent prompt gamma-ray luminosity (Norris, Marani & Bonnell 2000). On the other hand, SHBs have negligible (or even negative) spectral lags.
In the case of XRF 050416a, the prompt duration places it between the long- and short-duration classes. The low value of may suggest that it belongs to the long-duration class, however, it is becoming clear that hardness cannot be used to reliably distinguish between the two classes (see Nakar 2007). Similarly, while the negative lag inferred for XRF 050416a may suggest a SHB classification, examples do exist of long-duration BATSE bursts with negative lags (Norris & Bonnell 2006).
Afterglow modeling may provide additional clues. The range of values we infer for the XRF 050416a beaming-corrected energies are overall consistent with those of long-duration GRBs including the subclass of sub-energetic bursts. At the same time, they are roughly consistent with the values inferred for SHBs (Fox et al. 2005; Berger et al. 2005; Soderberg et al. 2006a). However, the low circumburst density, , is a factor of 10 to smaller than the typical values inferred for long-duration GRBs (e.g. Panaitescu & Kumar 2002; Yost et al. 2003; Chevalier, Li & Fransson 2004) but comparable to those of SHBs (Fox et al. 2005; Berger et al. 2005; Bloom et al. 2006b; Burrows et al. 2006; Panaitescu 2006; Soderberg et al. 2006a). The observed radio flare and X-ray flattening at 20 days are atypical for both long- and short- duration GRBs and therefore cannot be used to classify this event. However, it is interesting to note that large variations in the circumburst density are more naturally explained in the context of a massive stellar progenitor with interacting stellar winds (Garcia-Segura, Langer & Mac Low 1996; Ramirez-Ruiz et al. 2001).
Next is a discussion of the XRF 050416a host galaxy since long- and short- bursts may also be distinguished by their environments (see Berger 2006 for a recent review). As discussed in §5, the host is a star-forming galaxy with an inferred SFR and metallicity comparable to those of long-duration GRBs. Moreover, XRF 050416a is located near the center and brightest part of its host galaxy. It is thus consistent with the locations of long-duration bursts with respect to their hosts (Bloom, Kulkarni & Djorgovski 2002; Fruchter et al. 2006). For comparison, SHBs are typically localized to low SFR hosts with significant old stellar populations at radial offsets up to a factor of 10 larger than those of typical long-duration bursts (Berger et al. 2005; Fox et al. 2005; Bloom et al. 2006a; Soderberg et al. 2006a).
Finally, the discovery of an associated Type Ic supernova is perhaps one of the best methods to distinguish between long- and short-bursts. The discovery of several long-duration bursts and X-ray flashes at in the last few years has firmly established that GRBs and XRFs are accompanied by supernovae of Type Ic (Galama et al. 1998; Stanek et al. 2003; Malesani et al. 2004; Soderberg et al. 2005b; Pian et al. 2006). A study of the luminosity distribution for GRB/XRF-SNe reveals a significant dispersion, implying a spread of (at least) an order of magnitude in peak optical luminosity (Zeh, Klose & Hartmann 2004; Soderberg et al. 2006d). At the same time, deep imaging of SHBs has constrained any associated SN emission to be up to times less luminous as SN 1998bw (Fox et al. 2005; Soderberg et al. 2006a). In the case of XRF 050416a, the temporal and spectral properties of the HST data suggest that XRF 050416a was accompanied by a supernova with a peak luminosity roughly similar to SN 1998bw. We stress, however, that the temporal coincidence of the radio flare with the SN peak complicates any study of the SN properties.
Based on the associated SN and large-scale environmental properties, we conclude that XRF 050416a is a member of the long-duration class of gamma-ray bursts. This event highlights the difficulty in classifying bursts based on their prompt emission properties alone.
7 Discussion and Conclusions
We present extensive broad-band NIR/optical and radio data for the afterglow of the X-ray flash 050416a and show that it is localized to a star-forming (M⊙ yr-1) host galaxy at . Along with XRFs 020903, 030723 and 060218, this burst is one of the best studied X-ray flashes to date. Moreover, XRF 050416a is only the third XRF with a spectroscopic redshift for which a broadband afterglow study has been performed and the physical parameters have been constrained. The isotropic-equivalent prompt and kinetic energy releases are (Sakamoto et al. 2006) and erg respectively. These values are a factor of times larger than those of XRF 020903 (Sakamoto et al. 2004; Soderberg et al. 2004a) and up to times larger than those inferred for sub-energetic GRBs 980425, 031203 and XRF 060218 (Pian et al. 2000; Kulkarni et al. 1998; Sazonov, Lutovinov & Sunyaev 2004; Soderberg et al. 2004b; Campana et al. 2006; Soderberg et al. 2006c).
Adopting the results of our standard synchrotron model and days we constrain the collimation of the ejecta to , slightly larger than the median value of for typical GRBs (Bloom, Frail & Kulkarni 2003; Ghirlanda, Ghisellini & Lazzati 2004 and references therein). This indicates that the beaming-corrected energy release is erg and ) erg, implying a total relativistic energy yield of erg, which straddles the median value for cosmological GRBs, erg (Berger et al. 2003b). However, the efficiency in converting the energy in the ejecta into -rays is , significantly lower than the typical values for GRBs (Panaitescu & Kumar 2002; Yost et al. 2003) and comparable to that inferred for XRF 020903 (, Soderberg et al. 2004a). This strengthens the idea that XRFs and GRBs are distinguished by their ability to couple significant energy to highly-relativistic material (Soderberg et al. 2004a; Zhang, Woosley & Heger 2004).
In addition to the burst energetics, several key results emerge from our broadband analysis of XRF 050416a. First is the detection of a bright, late-time radio flare accompanied by an observed flattening in the X-ray bands which we attribute to a large circumburst density enhancement or episode of energy injection (refreshing shell or off-axis ejecta) at days. In the context of a density jump, it is interesting to note that the inferred pre-jump circumburst density is several orders of magnitude lower than the values typically inferred for long-duration GRBs (see Soderberg et al. 2006e for a recent compilation). Moreover, radio observations of local (optically-selected) core-collapse SNe show similar flux modulations (factor of 2 to 3) attributed to abrupt variations in the circumstellar medium (Weiler et al. 1991; Ryder et al. 2004; Soderberg et al. 2006b).
Next, the temporal and spectral evolution of the optical afterglow suggests the contribution from a supernova component with peak luminosity and light-curve shape comparable to SN 1998bw. Given the temporal coincidence of the radio flare and X-ray flattening with the SN peak, XRF 050416a highlights the need for full spectral coverage in late-time GRB/XRF-SN searches. This is illustrated by the optical rebrightening observed for XRF 030723 at days and interpretted as a thermal SN component (Fynbo et al. 2004) while the X-ray and radio data show similar rebrightenings at late-time suggesting a CSM density jump or energy injection (Butler et al. 2005, Soderberg et al. in prep).
With the addition of XRF 050416a, there are three XRFs (020903, 060218 and now 050416a) with spectroscopic redshifts observed in association with supernovae with peak luminosities varying by up to a factor of 10 compared to SN 1998bw (Soderberg et al. 2005b; Bersier et al. 2006; Pian et al. 2006). However, deep HST observations of XRF 040701 at revealed that any associated SN was at least a factor of 10 (and likely ) times fainter than SN 1998bw (Soderberg et al. 2005b). It is therefore clear that most XRFs produce Nickel-rich supernova explosions, but that there is a significant dispersion in the peak luminosities of XRF-associated SNe. A similar result is found for GRB-associated SNe (Zeh, Klose & Hartmann 2004; Soderberg et al. 2006d) and further strengthens the idea that GRBs and XRFs are intimately related.
Finally, we address XRF 050416a within the framework of off-axis and dirty fireball models for XRFs. As discussed in §3.3, the evolution of the early afterglow indicates that the ejecta are being viewed along the collimation axis. Similarly, on-axis viewing angles are inferred from afterglow studies of XRFs 020903 (Soderberg et al. 2004a), 050215B (Levan et al. 2006), 050406 (Romano et al. 2006), and 060218 (Campana et al. 2006; Soderberg et al. 2006c). Unification models in which X-ray flashes are understood as typical GRBs viewed away from the burst collimation axis (e.g. Granot et al. 2002; Yamazaki, Yonetoku & Nakamura 2003) are therefore inconsistent with the observations for these five events. To date, such models are only consistent with the observations of one X-ray flash: XRF 030723 (Fynbo et al. 2004; Butler et al. 2005; Granot, Ramirez-Ruiz & Perna 2005).
While the lack of high energy photons prevents a direct constraint on the Lorentz factor of the burst, our detailed afterglow modeling allows us to place a lower limit on the initial bulk Lorentz factor, , by extrapolating back to the first XRT observation at sec. This value is somewhat lower than the typical values inferred for cosmological GRBs (Panaitescu & Kumar 2002) and consistent with the upper range of values predicted for a dirty fireball. Given that some dirty fireball models predict XRFs to have wider jets than typical GRBs (e.g., Zhang, Woosley & MacFadyen 2003), it is interesting to note that there are no X-ray flashes for which an achromatic jet break has been observed. This may suggest that their ejecta are not strongly collimated. In fact, detailed radio observations of XRFs 020903 and 060218 spanning days imply a quasi-spherical ejecta geometry in both cases (Soderberg et al. 2004a, 2006c).
While the basic properties of X-ray flashes (redshifts, hosts, isotropic -ray energies) are now available for several events, it is clear that broadband afterglow observations are required for a complete understanding of the burst properties. With the addition of XRF 050416a to the existing sample of only a few well-studied events, we continue to work towards a systematic comparison of the global characteristics of XRFs and GRBs. While limited, the current sample suggests that the two classes share similar ejecta energies, associated SNe, and viewing angles. Further studies of XRF afterglows will be used to confirm whether the two classes differ in their collimation angles.
The authors thank Re’em Sari and Don Lamb for helpful discussions. As always, the authors thank Jochen Greiner for maintaining his GRB page. A.M.S. and S.B.C. are supported by the NASA Graduate Student Research Program. E.B. and A.G. acknowledge support by NASA through Hubble Fellowship grants awarded by STScI, which is operated by AURA, Inc., for NASA. GRB research at Caltech is supported through NASA.
References
- Alard (2000) Alard, C. 2000, A&AS, 144, 363.
- Amati (2006) Amati, L. 2006, MNRAS, 2006, 372, 233.
- Band et al. (1993) Band, D. et al. 1993, ApJ, 413, 281.
- Barthelmy et al. (2005) Barthelmy, S. D. et al. 2005, Nature, 438, 994.
- Berger (2006) Berger, E. 2006, in AIP Conf. Proc. 838: Gamma-Ray Bursts in the Swift Era, ed. S. S. Holt, N. Gehrels, and J. A. Nousek, 33.
- Berger et al. (2003a) Berger, E., Cowie, L. L., Kulkarni, S. R., Frail, D. A., Aussel, H., and Barger, A. J. 2003a, ApJ, 588, 99.
- Berger, Kulkarni & Frail (2003) Berger, E., Kulkarni, S. R., and Frail, D. A. 2003, ApJ, 590, 379.
- Berger, Kulkarni & Frail (2004) Berger, E., Kulkarni, S. R., and Frail, D. A. 2004, ApJ, 612, 966.
- Berger et al. (2003b) Berger, E. et al. 2003b, Nature, 426, 154.
- Berger et al. (2005) Berger, E. et al. 2005, Nature, 438, 988.
- Bersier et al. (2006) Bersier, D. et al. 2006, ApJ, 643, 284.
- Björnsson, Gudmundsson & Jóhannesson (2004) Björnsson, G., Gudmundsson, E. H., and Jóhannesson, G. 2004, ApJ, 615, L77.
- Bloom et al. (2003) Bloom, J. S., Fox, D., van Dokkum, P. G., Kulkarni, S. R., Berger, E., Djorgovski, S. G., and Frail, D. A. 2003, ApJ, 599, 957.
- Bloom, Frail & Kulkarni (2003) Bloom, J. S., Frail, D. A., and Kulkarni, S. R. 2003, ApJ, 594, 674.
- Bloom, Kulkarni & Djorgovski (2002) Bloom, J. S., Kulkarni, S. R., and Djorgovski, S. G. 2002, AJ, 123, 1111.
- Bloom et al. (2006a) Bloom, J. S. et al. 2006a, astro-ph/0607223
- Bloom et al. (2006b) Bloom, J. S. et al. 2006b, ApJ, 638, 354.
- Burrows et al. (2006) Burrows, D. N. et al. 2006, ApJ, 653, 468.
- Butler et al. (2005) Butler, N. R. et al. 2005, ApJ, 621, 884.
- Calzetti, Kinney & Storchi-Bergmann (1994) Calzetti, D., Kinney, A. L., and Storchi-Bergmann, T. 1994, ApJ, 429, 582.
- Campana et al. (2006) Campana, S. et al. 2006, Nature, 442, 1008.
- Chevalier, Li & Fransson (2004) Chevalier, R. A., Li, Z.-Y., and Fransson, C. 2004, ApJ, 606, 369.
- Christensen, Hjorth & Gorosabel (2004) Christensen, L., Hjorth, J., and Gorosabel, J. 2004, A&A, 425, 913.
- Dermer, Chiang & Böttcher (1999) Dermer, C. D., Chiang, J., and Böttcher, M. 1999, ApJ, 513, 656.
- Eichler et al. (1989) Eichler, D., Livio, M., Piran, T., and Schramm, D. N. 1989, Nature, 340, 126.
- Fox et al. (2005) Fox, D. B. et al. 2005, Nature, 437, 845.
- Frail et al. (2003) Frail, D. A., Kulkarni, S. R., Berger, E., and Wieringa, M. H. 2003, AJ, 125, 2299.
- Frail et al. (2001) Frail, D. A. et al. 2001, ApJ, 562, L55.
- Frail et al. (2005) Frail, D. A., Soderberg, A. M., Kulkarni, S. R., Berger, E., Yost, S., Fox, D. W., and Harrison, F. A. 2005, ApJ, 619, 994.
- Frail, Waxman & Kulkarni (2000) Frail, D. A., Waxman, E., and Kulkarni, S. R. 2000, ApJ, 537, 191.
- Freedman & Waxman (2001) Freedman, D. L. and Waxman, E. 2001, ApJ, 547, 922.
- Fruchter & Hook (2002) Fruchter, A. S. and Hook, R. N. 2002, PASP, 114, 144.
- Fruchter et al. (2006) Fruchter, A. S. et al. 2006, Nature, 441, 463.
- Fynbo et al. (2004) Fynbo, J. P. U. et al. 2004, ApJ, 609, 962.
- Galama et al. (1998) Galama, T. J. et al. 1998, Nature, 395, 670.
- Galama & Wijers (2001) Galama, T. J. and Wijers, R. A. M. J. 2001, ApJ, 549, L209.
- Garcia-Segura, Langer & Mac Low (1996) Garcia-Segura, G., Langer, N., and Mac Low, M.-M. 1996, A&A, 316, 133.
- Ghirlanda, Ghisellini & Lazzati (2004) Ghirlanda, G., Ghisellini, G., and Lazzati, D. 2004, ApJ, 616, 331.
- Granot, Nakar & Piran (2003) Granot, J., Nakar, E., and Piran, T. 2003, Nature, 426, 138.
- Granot et al. (2002) Granot, J., Panaitescu, A., Kumar, P., and Woosley, S. E. 2002, ApJ, 570, L61.
- Granot & Sari (2002) Granot, J. and Sari, R. 2002, ApJ, 568, 820.
- Granot, Ramirez-Ruiz & Perna (2005) Granot, J. and Ramirez-Ruiz, E. and Perna, R. 2005, ApJ, 630, 1003.
- Heise et al. (2001) Heise, J., in’t Zand, J., Kippen, R. M., and Woods, P. M. 2001, in Gamma-ray Bursts in the Afterglow Era, ed. E. Costa, F. Frontera, and J. Hjorth, 16.
- Henden (2005) Henden, A. 2005, GRB Coordinates Network, 3454, 1.
- Holland et al. (2006) Holland, S. T. et al. 2006, ArXiv Astrophysics e-prints. astro-ph/0604316.
- Jakobsson et al. (2004) Jakobsson, P. et al. 2004, A&A, 427, 785.
- Kennicutt (1998) Kennicutt, R. C. 1998, ARA&A, 36, 189.
- Kobulnicky & Kewley (2004) Kobulnicky, H. A. and Kewley, L. J. 2004, ApJ, 617, 240.
- Kouveliotou et al. (1993) Kouveliotou, C., Meegan, C. A., Fishman, G. J., Bhat, N. P., Briggs, M. S., Koshut, T. M., Paciesas, W. S., and Pendleton, G. N. 1993, ApJ, 413, L101.
- Kouveliotou et al. (2004) Kouveliotou, C. et al. 2004, ApJ, 608, 872.
- Kulkarni et al. (1999) Kulkarni, S. R. et al. 1999, ApJ, 522, L97.
- Kulkarni et al. (1998) Kulkarni, S. R. et al. 1998, Nature, 395, 663.
- Le Floc’h et al. (2003) Le Floc’h, E. et al. 2003, A&A, 400, 499.
- Levan et al. (2006) Levan, A. J. et al. 2006, ApJ, 648, 1132.
- Li et al. (2005) Li, W., Chornock, R., Jha, S., and Filippenko, A. V. 2005, GRB Coordinates Network, 3270, 1.
- Li & Song (2004) Li, Z. and Song, L. M. 2004, ApJ, 614, L17.
- Lithwick & Sari (2001) Lithwick, Y. and Sari, R. 2001, ApJ, 555, 540.
- Livio & Waxman (2000) Livio, M. and Waxman, E. 2000, ApJ, 538, 187.
- Malesani et al. (2004) Malesani, D. et al. 2004, ApJ, 609, L5.
- Mangano et al. (2006) Mangano, V. et al. 2006, ArXiv Astrophysics e-prints. astro-ph/0603738.
- McGaugh (1991) McGaugh, S. S. 1991, ApJ, 380, 140.
- McKenzie & Schaefer (1999) McKenzie, E. H. and Schaefer, B. E. 1999, PASP, 111, 964.
- Mirabal et al. (2006) Mirabal, N., Halpern, J. P., An, D., Thorstensen, J. R., and Terndrup, D. M. 2006, ApJ, 643, L99.
- Modjaz et al. (2006) Modjaz, M. et al. 2006, ApJ, 645, L21.
- Nakar & Granot (2006) Nakar, E. and Granot, J. 2006, ArXiv Astrophysics e-prints. astro-ph/0606011.
- Nakar (2007) Nakar, E. 2007, Physics Reports (in press). astro-ph/0701748.
- Norris & Bonnell (2006) Norris, J. P. and Bonnell, J. T. 2006, ApJ, 643, 266.
- Norris, Marani & Bonnell (2000) Norris, J. P., Marani, G. F., and Bonnell, J. T. 2000, ApJ, 534, 248.
- Nousek et al. (2006) Nousek, J. A. et al. 2006, ApJ, 642, 389.
- O’Brien et al. (2006) O’Brien, P. T. et al. 2006, ApJ, 647, 1213.
- Osterbrock (1989) Osterbrock, D. E. 1989, Astrophysics of gaseous nebulae and active galactic nuclei, (University of Minnesota, et al. Mill Valley, CA: Research supported by the University of California, John Simon Guggenheim Memorial Foundation, University Science Books).
- Paczynski (2001) Paczynski, B. 2001, Acta Astronomica, 51, 1.
- Panaitescu (2006) Panaitescu, A. 2006, MNRAS, 367, L42.
- Panaitescu & Kumar (2002) Panaitescu, A. and Kumar, P. 2002, ApJ, 571, 779.
- Patat et al. (2001) Patat, F. et al. 2001, ApJ, 555, 900.
- Pei (1992) Pei, Y. C. 1992, ApJ, 395, 130.
- Pian et al. (2000) Pian, E. et al. 2000, ApJ, 536, 778.
- Pian et al. (2006) Pian, E. et al. 2006, Nature, 442, 1011.
- Piran (1999) Piran, T. 1999, Phys. Rep., 314, 575.
- Predehl & Schmitt (1995) Predehl, P. and Schmitt, J. H. M. M. 1995, A&A, 293, 889.
- Price et al. (2005) Price, P. A., Minezaki, T., Cowie, L., and Yoshii, Y. 2005, GRB Coordinates Network, 3312, 1.
- Prochaska et al. (2006) Prochaska, J. X. et al. 2006, ApJ, 642, 989.
- Qiu et al. (2005) Qiu, Y., Lu, C. L., Lou, Y. Q., Huang, K. Y., and Urata, Y. 2005, GRB Coordinates Network, 3286, 1.
- Ramirez-Ruiz et al. (2001) Ramirez-Ruiz, E., Dray, L. M., Madau, P., and Tout, C. A. 2001, MNRAS, 327, 829.
- Ramirez-Ruiz et al. (2005) Ramirez-Ruiz, E., García-Segura, G., Salmonson, J. D., and Pérez-Rendón, B. 2005, ApJ, 631, 435.
- Rau, Salvato & Greiner (2005) Rau, A., Salvato, M., and Greiner, J. 2005, A&A, 444, 425.
- Rees & Meszaros (1998) Rees, M. J. and Meszaros, P. 1998, ApJ, 496, L1+.
- Romano et al. (2006) Romano, P. et al. 2006, A&A, 450, 59.
- Ryder et al. (2004) Ryder, S. D., Sadler, E. M., Subrahmanyan, R., Weiler, K. W., Panagia, N., and Stockdale, C. 2004, MNRAS, 349, 1093.
- Sakamoto (2006) Sakamoto, T. 2006, in AIP Conf. Proc. 838: Gamma-Ray Bursts in the Swift Era, ed. S. S. Holt, N. Gehrels, and J. A. Nousek, 43.
- Sakamoto et al. (2006) Sakamoto, T. et al. 2006, ApJ, 636, L73.
- Sakamoto et al. (2004) Sakamoto, T. et al. 2004, ApJ, 602, 875.
- Sakamoto et al. (2005) Sakamoto, T. et al. 2005, ApJ, 629, 311.
- Sari & Piran (1999) Sari, R. and Piran, T. 1999, ApJ, 517, L109.
- Sari, Piran & Halpern (1999) Sari, R., Piran, T., and Halpern, J. P. 1999, ApJ, 519, L17.
- Sari, Piran & Narayan (1998) Sari, R., Piran, T., and Narayan, R. 1998, ApJ, 497, L17+.
- Sazonov, Lutovinov & Sunyaev (2004) Sazonov, S. Y., Lutovinov, A. A., and Sunyaev, R. A. 2004, Nature, 430, 646.
- Schady et al. (2006) Schady, P. et al. 2006, ApJ, 643, 276.
- Schlegel, Finkbeiner & Davis (1998) Schlegel, D. J., Finkbeiner, D. P., and Davis, M. 1998, ApJ, 500, 525.
- Sirianni et al. (2005) Sirianni, M. et al. 2005, PASP, 117, 1049.
- Smith et al. (2002) Smith, J. A. et al. 2002, AJ, 123, 2121.
- Soderberg (2006) Soderberg, A. M. 2006, in AIP Conf. Proc. 838: Gamma-Ray Bursts in the Swift Era, ed. S. S. Holt, N. Gehrels, and J. A. Nousek, 380.
- Soderberg et al. (2006a) Soderberg, A. M. et al. 2006a, ApJ, 650, 261.
- Soderberg et al. (2006b) Soderberg, A. M., Chevalier, R. A., Kulkarni, S. R., and Frail, D. A. 2006b, ApJ, 651, 1005.
- Soderberg et al. (2004a) Soderberg, A. M. et al. 2004a, ApJ, 606, 994.
- Soderberg et al. (2004b) Soderberg, A. M. et al. 2004b, Nature, 430, 648.
- Soderberg et al. (2005b) Soderberg, A. M. et al. 2005b, ApJ, 627, 877.
- Soderberg et al. (2006c) Soderberg, A. M. et al. 2006c, Nature, 442, 1014.
- Soderberg et al. (2006d) Soderberg, A. M. et al. 2006d, ApJ, 636, 391.
- Soderberg et al. (2006e) Soderberg, A. M., Nakar, E., Berger, E., and Kulkarni, S. R. 2006e, ApJ, 638, 930.
- Stanek et al. (2003) Stanek, K. Z. et al. 2003, ApJ, 591, L17.
- Tiengo et al. (2003) Tiengo, A., Mereghetti, S., Ghisellini, G., Rossi, E., Ghirlanda, G., and Schartel, N. 2003, A&A, 409, 983.
- Torii (2005) Torii, K. 2005, GRB Coordinates Network, 3272, 1.
- Villasenor et al. (2005) Villasenor, J. S. et al. 2005, Nature, 437, 855.
- Waxman (2004) Waxman, E. 2004, ApJ, 602, 886.
- Weiler et al. (1991) Weiler, K. W., van Dyk, S. D., Discenna, J. L., Panagia, N., and Sramek, R. A. 1991, ApJ, 380, 161.
- Wiersema et al. (2007) Wiersema, K. et al. 2007, A&A, in press (astro-ph/0701034).
- Wijers (2001) Wijers, R. A. M. J. 2001, in Gamma-ray Bursts in the Afterglow Era, ed. E. Costa, F. Frontera, and J. Hjorth, 306.
- Yamazaki, Yonetoku & Nakamura (2003) Yamazaki, R., Yonetoku, D., and Nakamura, T. 2003, ApJ, 594, L79.
- Yanagisawa, Toda & Kawai (2005) Yanagisawa, K., Toda, H., and Kawai, N. 2005, GRB Coordinates Network, 3287, 1.
- Yost et al. (2003) Yost, S. A., Harrison, F. A., Sari, R., and Frail, D. A. 2003, ApJ, 597, 459.
- Zeh, Klose & Hartmann (2004) Zeh, A., Klose, S., and Hartmann, D. H. 2004, ApJ, 609, 952.
- Zel’dovich & Raizer (2002) Zel’dovich, Y. B. and Raizer, Y. P. 2002, Physics of Shock Waves and High Temperature Hydrodynamic Phenomena, (Mineola, NY: Dover).
- Zhang, Woosley & Heger (2004) Zhang, W., Woosley, S. E., and Heger, A. 2004, ApJ, 608, 365.
- Zhang, Woosley & MacFadyen (2003) Zhang, W., Woosley, S. E., and MacFadyen, A. I. 2003, ApJ, 586, 356.
| Date Obs | aaDays since explosion have been calculated for the mid-point of each exposure. | Telescope | Filter | magnitudebbMagnitudes have not been corrected for extinction. Limits are given as . |
|---|---|---|---|---|
| (UT) | (days) | |||
| 2005 April 16.4641 | 0.0025 | Palomar 60-inch | ||
| 2005 April 16.4659 | 0.0043 | Palomar 60-inch | ||
| 2005 April 16.4677 | 0.0061 | Palomar 60-inch | ||
| 2005 April 16.4696 | 0.0080 | Palomar 60-inch | ||
| 2005 April 16.4692 | 0.0076 | Palomar 200-inch | ||
| 2005 April 16.4714 | 0.0098 | Palomar 60-inch | ||
| 2005 April 16.4731 | 0.0116 | Palomar 60-inch | ||
| 2005 April 16.4772 | 0.0156 | Palomar 60-inch | ccAB system. | |
| 2005 April 16.4763 | 0.0147 | Palomar 200-inch | ||
| 2005 April 16.4833 | 0.0217 | Palomar 60-inch | ||
| 2005 April 16.4828 | 0.0212 | Palomar 200-inch | ||
| 2005 April 16.4880 | 0.0264 | Palomar 60-inch | ||
| 2005 April 16.4895 | 0.0279 | Palomar 200-inch | ||
| 2005 April 16.4960 | 0.0344 | Palomar 200-inch | ||
| 2005 April 16.5026 | 0.0410 | Palomar 200-inch | ||
| 2005 April 16.5089 | 0.0473 | ANU 2.3-meter | ||
| 2005 April 16.5502 | 0.0886 | ANU 2.3-meter | ||
| 2005 April 16.5543 | 0.0927 | ANU 2.3-meter | ||
| 2005 April 16.5585 | 0.0969 | ANU 2.3-meter | ||
| 2005 April 16.5626 | 0.1010 | ANU 2.3-meter | ||
| 2005 April 16.5669 | 0.1053 | ANU 2.3-meter | ||
| 2005 April 16.5702 | 0.1086 | ANU 2.3-meter | ||
| 2005 April 16.5744 | 0.1128 | ANU 2.3-meter | ||
| 2005 April 16.5779 | 0.1163 | ANU 2.3-meter | ||
| 2005 April 16.5816 | 0.1200 | ANU 2.3-meter | ||
| 2005 April 16.5850 | 0.1234 | ANU 2.3-meter | ||
| 2005 April 16.5893 | 0.1277 | ANU 2.3-meter | ||
| 2005 April 16.5924 | 0.1308 | ANU 2.3-meter | ||
| 2005 April 16.5975 | 0.1359 | ANU 2.3-meter | ||
| 2005 April 16.6092 | 0.1476 | ANU 2.3-meter | ||
| 2005 April 16.6187 | 0.1571 | ANU 2.3-meter | ||
| 2005 April 17.3895 | 0.9279 | Palomar 60-inch | ||
| 2005 April 17.4006 | 0.9390 | Palomar 60-inch | ccAB system. | |
| 2005 April 17.4087 | 0.9467 | Palomar 60-inch | ||
| 2005 April 18.2884 | 1.8264 | Palomar 60-inch | ||
| 2005 April 18.4031 | 1.9411 | Palomar 60-inch | ||
| 2005 April 23.3511 | 6.8896 | Palomar 200-inch |
| Date Obs | Exp. Time | Filter | HST magaaAB system magnitudes in the HST filters given in column 4. Photometry was done on residual images (see §2.2). We have assumed the source flux to be negligible in the final (template) epoch. Magnitudes have not been corrected for extinction. | Johnson magbbWe convert the F775W magnitudes in column 5 to Johnson -band (Vega system) as described in §2.2. Magnitudes have not been corrected for extinction. | |
|---|---|---|---|---|---|
| (UT) | (days) | (sec) | (AB) | (Vega) | |
| 2005 May 23.38 | 36.92 | 3282 | F775W | ||
| 2005 May 23.46 | 37.00 | 3430 | F850LP | ||
| 2005 June 16.17 | 60.71 | 3986 | F775W | ||
| 2005 July 11.15 | 85.69 | 4224 | F775W | ||
| 2005 November 21.06 | 218.60 | 4224 | F850LP | ||
| 2005 November 21.19 | 218.73 | 4224 | F775W |
| Line | (rest) | (observed)aaObserved wavelengths have been corrected to vacuum. | Redshift | FluxbbFlux values have not been corrected for Galactic extinction |
|---|---|---|---|---|
| (Å) | (Å) | () | ||
| 3728.38 | 6162.08 | 0.6528 | ||
| H | 4341.72 | 7174.64 | 0.6525 | |
| H | 4862.72 | 8037.14 | 0.6528 | |
| 4960.30 | 8198.79 | 0.6529 | ||
| 5008.24 | 8277.57 | 0.6528 |
.
| Date Obs | aaAll errors are given as (rms). | |||
|---|---|---|---|---|
| (UT) | (days) | (Jy) | (Jy) | (Jy) |
| 2005 April 16.49 | 0.026 | |||
| 2005 April 22.03 | 5.57 | |||
| 2005 April 28.29 | 11.83 | |||
| 2005 May 1.35 | 14.89 | |||
| 2005 May 31.10 | 44.64 | |||
| 2005 June 3.99 | 48.53 | |||
| 2005 June 8.03 | 52.57 | |||
| 2005 June 16.97 | 61.51 | |||
| 2005 June 20.16 | 64.70 | |||
| 2005 July 1.92 | 76.46 | |||
| 2005 July 30.02 | 104.56 | |||
| 2005 August 14.97 | 120.51 | |||
| 2005 August 21.89 | 127.42 | |||
| 2005 September 19.90 | 156.44 | |||
| 2005 October 15.73 | 182.27 |