The EDELWEISS Collaboration
Measurement of the response of heat-and-ionization germanium detectors to nuclear recoils
Abstract
The heat quenching factor (the ratio of the heat signals produced by nuclear and electron recoils of equal energy) of the heat-and-ionization germanium bolometers used by the EDELWEISS collaboration has been measured. It is explained how this factor affects the energy scale and the effective quenching factor observed in calibrations with neutron sources. This effective quenching effect is found to be equal to , where is the quenching factor of the ionization yield. To measure , a precise EDELWEISS measurement of is combined with values of obtained from a review of all available measurements of this quantity in tagged neutron beam experiments. The systematic uncertainties associated with this method to evaluate are discussed in detail. For recoil energies between 20 and 100 keV, the resulting heat quenching factor is = 0.91 0.03 0.04, where the two errors are the contributions from the and measurements, respectively. The present compilation of values and evaluation of represent one of the most precise determinations of the absolute energy scale for any detector used in direct searches for dark matter.
pacs:
29.40.Wk, 95.35.+dI Introduction
Heat-and-ionization germanium detectors are extensively used for direct search of the weakly interacting massive particles (WIMPs) that could constitute the Dark Matter halo of our Galaxycdms-soudan ; edw2003 . The scattering of a WIMP on a Ge atom produces a nuclear recoil with a kinetic energy in the ten’s of keV rangebib-lewin . The recoil is stopped in the detector volume within a distance of 100 nm. The energy loss occurs as a combination of ionization (electronic dE/dx) and atomic collisions (nuclear dE/dx)bib-lindh . In heat-and-ionization detectors, the event is identified using two signatures. The first is the ionization signal, corresponding to the collection on electrodes of the electron-hole pairs created by the energy loss process. The second is the heat (or phonon) signal, recorded by a thermal sensor in contact with the germanium crystal. It has been demonstrated that combining the two simultaneous measurements provides an efficient discrimination against the large background of electron recoils originating from the natural and radioactivitycdms-soudan ; edw2003 . The basis of this discrimination is that the number of electron-hole pairs created by an electron recoil of a given energy is three to four times larger than that created by a nuclear recoil of the same energy.
The process at the origin of the reduced ionization yield has been extensively studied since the original work of Lindhardbib-lindh . The effect has been measured repeatedly as a function of recoil energy in germanium ionization detectors at liquid Nitrogen temperature (77 K) bib-chasman1 ; bib-sattler ; bib-chasman2 ; bib-jones ; bib-messous ; bib-baudis , and more recently at 35 mK bib-sicane . In these experiments, the ionization signals recorded with such detectors are first calibrated using gamma-ray sources, producing energetic electron recoils. This energy scale is called keV-equivalent-electron (keVee). Using this calibration, the detector is then exposed to a neutron source. The elastic collisions of neutrons with atoms in the detector volume produce nuclear recoils. The energy of the recoils is constrained by the use of monoenergetic neutron beams, the detection of the neutron scattering angle and/or its time-of-flight bib-chasman1 ; bib-sattler ; bib-chasman2 ; bib-jones ; bib-messous ; bib-baudis . It is then observed that the ionization yield for a nuclear recoil is a factor smaller than that produced by an electron recoil of equal energy.
In analogy with the ionization quenching factor , one can similarly introduce a quenching factor for the heat signal in thermal detectors. This factor does not affect the ability of heat-and-ionization detectors to discriminate electron and nuclear recoils111Except in the very special case where =, clearly excluded by the measurements discussed in the following.. However, this factor enters in the determination of the energy calibration for nuclear recoils and, consequently, in the energy threshold for their detection. Heat-and-ionization detectors are designed so that the initial deposited energy thermalizes in time for the signal read-out, independently of the process at its origin, with as little as possible losses to the outside world. It is thus expected that is close to one. Possible deviations can only arise from processes that affect differently electron and nuclear recoils. In Ge crystal at cryogenic temperatures (typically 10 to 100 mK), the possible sources of such differences are usually considered to be small, but have never been measured precisely. Examples of such processes are the storage of energy in stable crystal defects generated by the recoiling nuclei, or the emission of photons during the initial stage of ionization. Systematic detector-dependent effects could also appear if the heat signal is read out before allowing for the full thermalization of the phonon excitations in the crystal.
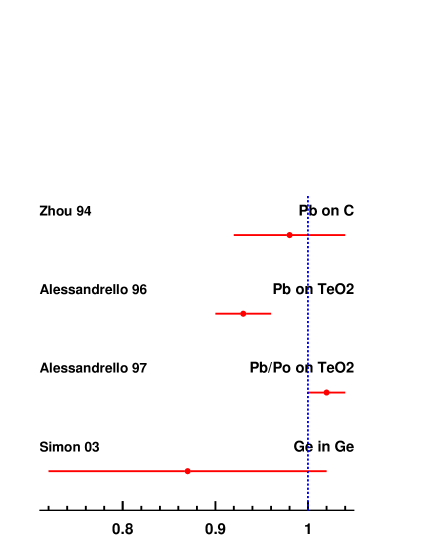
A direct measurement of is a delicate experiment. Fig. 1 summarizes the available measurements for all type of low-temperature devices. They are all consistent with unity, although the only measurement directly relevant to germanium, performed with a tagged neutron beam, is not very precise bib-sicane . The measurements in the other bolometric devices involve 206Pb recoils from 210Pb alpha decays close to the surface of diamond bib-zhou and TeO2 bib-aless detectors. It could be argued that processes that could lead to deviations from unity in a germanium semiconductor might not show up as strongly, or even cancel out, in the other measured substrates. The technique of using surface recoils cannot be applied easily to germanium heat-and-ionization detectors because of the presence of electrodes, dead layers and systematic effects in the drift of electrons and holes near the surface of the detectorbib-surf .
However, as it will be shown here, heat-and-ionization bolometers provide an accurate measurement of the ratio . This idea has already been qualitatively stated in Ref. bib-shutt , where it was observed that the data appeared to be consistent with , without defining an explicit procedure for extracting a quantitative value. In this work, we define a procedure in which the value for Ge recoils in Ge is obtained by combining the measurements of from heat-and-ionization detectors with the available direct measurements. In the first section, the mathematical formulae necessary to obtain the final result and, more importantly, its systematic uncertainty, are presented. In the second section, we review the available data, compute their average values as a function of recoil energy, and evaluate their statistical and systematic uncertainties. The third section presents the results of measurements using the EDELWEISS detectors, and discusses their associated systematic errors. The results are also compared to those of Ref. bib-shutt . In the fourth section, the measurements are compared with the computed average values. The final result can be interpreted either as the most precise available measurement of the heat quenching factor for Ge atoms recoiling in the bulk of a Ge crystal, or, conversely, as an evaluation of the uncertainties on the absolute energy scale of nuclear recoils in the EDELWEISS heat-and-ionization detectors due to imperfection of the understanding of the underlying physics.
II Definition of terms
II.1 Ionization measurement
The amplitude of the ionization signal is proportional to the number of collected electron-hole pairs . In heat-and-ionization detectors, the applied difference of potential on the electrodes is chosen large enough so that losses due to trapping are small. This is verified222In EDELWEISS detectors, this is verified for 3 Volts. by observing that is independent of . Under these conditions, for electron recoils
where is the electron recoil energy and is the average energy necessary to create one electron-hole pair. At 77 K, = 2.96 eVbib-knoll . At cryogenic temperature, this value is expected to increase slightly due to the variation of the gap energy. A value of 3.0 0.1 eV is adopted here, consistent with the measurement of Ref. bib-epsgamma and the value used by the EDELWEISS and CDMS experiments.
The amplitude is calibrated using gamma-ray sources to provide , the energy in units of keVee.
For nuclear recoils, the average energy per electron-hole pair is approximately 12 eV, and varies with energy. The quenching factor for the ionization signal of nuclear recoils is defined as = , and
The Lindhard theory describing the energy losses of energetic ions in matter provides some predictions for the value of bib-lindh . Within this model, the fraction of the incident energy dissipated in ionization is calculated from the electronic and nuclear stopping power of Ge ions in Ge. Because of the approximations behind this calculation, it cannot be expected to provide an accurate prediction of the absolute value of . However, it will be shown in the following section that it describes reasonably well the overall energy dependence of . The Lindhard model will be used to interpolate between measurements of at different energies. We thus introduce this prediction as a reference function, , evaluated for Ge recoils in Ge following the usual parametrizations bib-lewin ; bib-lindh :
| (1) |
where is a dimensionless energy, is related to the electronic energy loss (), and for Ge recoils in Ge:
| (2) | |||||
| (3) | |||||
| (4) |
II.2 The heat or phonon measurement
For electron recoils in heat-and-ionization detectors, the heat signal amplitude is due to the initial energy of the recoil and to the Joule heating associated to the current of collected electron and holes through the detector (Neganov-Luke effectbib-luke ):
| (5) |
where is the charge of the proton and is the absolute value of the applied potential. For simplicity, we note the quantity as , and . For nuclear recoils in a truly calorimetric detector (=1), the amplitude is:
If the phonon yield for nuclear recoils is reduced by a factor , the Joule heating contribution remains proportional to the number of created electron-hole pairs and:
Once the heat signal amplitude is calibrated in units of keVee using a gamma-ray source, we obtain the energy and
II.3 Recoil energy measurement for =1 and 1
The two independent quantities and can be used to evaluate the following two quantities:
| (6) |
| (7) |
We also define and as the values of in the case of electron and nuclear recoils, respectively. In the case where , the variable and have simple interpretations. As , the variable represents the recoil energy, irrespective of the type of recoil. The variable measures the quenching effect relevant to the incident particle, as for electron recoils, while for nuclear recoils.
In the more general case where , the relationships for electron recoils and are still true. For nuclear recoils, however, the following values are obtained:
A plot of the measured values of versus , as it is typically donecdms-soudan ; edw2003 , will still display the characteristic separation of the two populations of electron and nuclear recoils. However the position of the so-called “nuclear recoil band” () has to be interpreted with care. First, the measured values will be divided by a factor relative to the true value of . This has no consequence for the identification of nuclear recoils in Refs.cdms-soudan ; edw2003 , since the position of this band is always taken from the results of the neutron source calibrations of the relevant detector. However, the apparent recoil energy for nuclear recoil , obtained by assuming , is not equal to the true recoil energy . For example, =0.9, and an apparent recoil energy threshold of = 10 keV corresponds to a true threshold of = 11 keV.
The neutron calibration of the first heat-and-ionization detectorsbib-shutt quickly established that was not very different from 1, as the measured values were compatible to the direct measurement of performed at 77 K with Ge diode detectors. This work pursues this idea further by actually performing the evaluation of
| (8) |
using a compilation of the available direct measurements for and the most precise measurements performed by the EDELWEISS collaboration with its detectors. A complete assessment of the statistical and systematic uncertainties associated to both types of measurement will also be performed.
II.4 Propagation of uncertainties
To evaluate the systematic uncertainties on as evaluated with Eq. 8, it is useful to study its dependence on different variables. First, the uncertainty on depends linearly on those on the measurement. In the next section, these uncertainties are discussed in details. As for the uncertainties on , we have:
| (9) | |||||
| (10) | |||||
| (11) |
An effect that must be taken into account when evaluating the ratio of the and measurements is that in general . At lowest order (small deviations of from 1 and small slope ), the value of can be obtained from that of by:
| (12) |
where, as it will be shown later, can be taken from the Lindhard theory with a good precision.
III A review of Q measurements
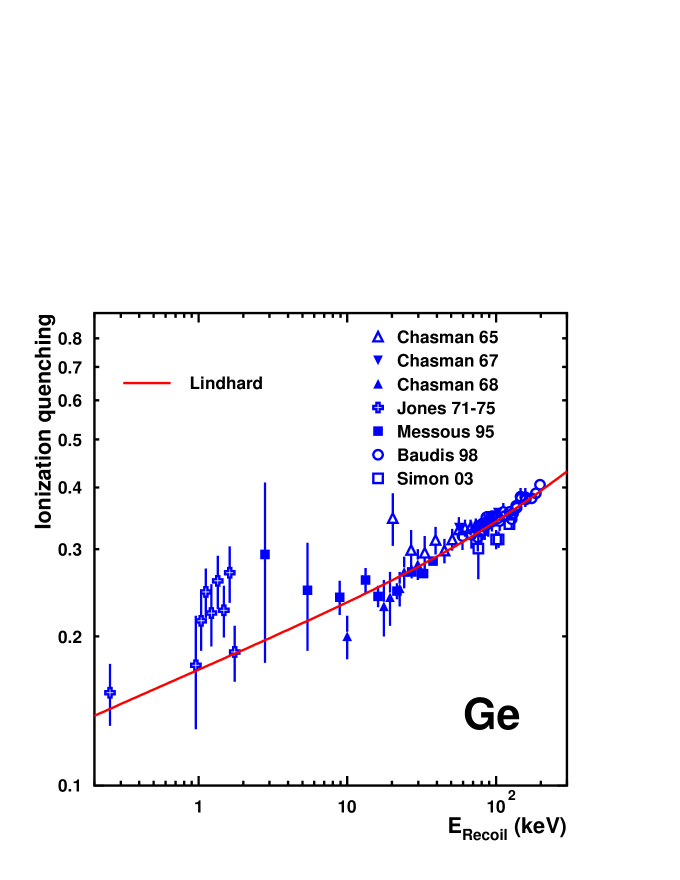
Fig. 2 shows the results333The data from Ref. bib-sattler are not included in this review because of the reasons explained in Ref. bib-chasman2 . of the direct measurements of ionization quenching for germanium recoils in germanium from Refs. bib-chasman1 ; bib-chasman2 ; bib-messous ; bib-baudis ; bib-jones ; bib-sicane . The measurements from Ref. bib-shutt are discussed in Sect. IV, as they consist in a measurement of and not of . No large inconsistency can be observed. The recoil energy dependence of the data is well described by the Lindhard model (Eq. 1), shown as a continuous curve on the same plot.
The measurements were performed with various experimental techniques. The systematic uncertainty on can be reduced by combining them. However, the recoil energy intervals used in the measurements are not the same, and one must take into account the energy dependence of when combining two measurements performed at different average recoil energies. For this reason, we will not perform weighted averages of , but instead use , with given by Eq. 1. These weighted averages will be done for each of the recoil energy bin used in Sect. IV. They are shown in Table 1. In order to take into account possible correlations between the error bars within the same experimental data set in a given energy interval, only one measurement per experiment is used per interval. This measurement is chosen as the one with the smallest error. The weights are the square of the inverse of the quoted total uncertainties. The uncertainty on the combined ratios is computed assuming that the errors are not correlated between the measurements. If in a given energy bin, the reduced chi-square of the combination of results, , is larger than one, the uncertainty is multiplied by the square root of this quantity. The average recoil energy for each energy bin is calculated as the energy of the individual measurements averaged using the same weights. Finally, the average ratio is multiplied with , yielding a set of values of with their experimental uncertainties that exploits at best the available data sets.
Table 1 shows that the different measurements are consistent within small adjustment to the quoted errors, with four out of eight reduced values above unity, of which two are slightly above 2. This consistency is remarkable considering that the measurements were performed over a period of 38 years, with experimental setups and techniques that differ considerably and with constant improvements in the understanding of the systematic biases. Over the range from 5 to 200 keV, there is no sign of deviation of larger than 5%. This indicates that the choice of the function for interpolating the results within an energy bin is appropriate.
In the energy bin from 80 to 100 keV, the results of the three available measurements are consistent within less than 1%. The combined result has an uncertainty of 1%, making it one of the most precisely measured quenching factor in any type of detector. One can also note that the absolute value of is very close to the experimental measurements. This is not too surprising since the overall normalizations of the nuclear and electronic stopping powers in the Lindhard model (Eqs. 2 to 4) are based on experimental data. However the experimental values of do not depend on this precise choice of reference.
IV The EDELWEISS Q/Q’ measurement
As discussed in Sect. II.3, the EDELWEISS heat-and-ionization detectors provide a measurement of , where and, for events due to the elastic scattering of neutrons on Ge nuclei, the measurements have a Gaussian dispersion centered on the value = . In this section, we present the results obtained with five detectors444The two other EDELWEISS detectorsedw-calib GeAl6 and GeAl9 have not been used because of the stringent requirements for resolution and precision of the energy calibration necessary for the present measurement., labeled GeAl10, GGA1, GGA3, GSA1 and GSA3. Their characteristics and performances are detailed in Ref. edw2003 ; bib-edw2002 ; edw-calib , where the experimental setup and its operation are also described. The main difference between these detectors is whether the amorphous layer under the aluminum electrodes is made of germanium (GGA series) or of silicon (GSA series), or whether there is none (GeAl series). This difference affects the charge collection properties of the detector edw2003 ; bib-edw2002 . The electrodes are polarized to a potential of 4.00 V, resulting in a value of = 4/3.
The experimental procedure and data analysis proceed according to the following steps. First, the detectors are calibrated in keVee using -ray sources (Sect. IV.1). They are then exposed to a fast neutron flux of the order of 1 to 10 n/cm2/h using a weak 252Cf source. From this data is deduced , the average value of as a function of for elastic neutron scattering events (Sect. IV.2). At this point, the results are compared with those of Ref. bib-shutt . The data are then corrected for multiple scattering and energy shifts (Sect. IV.3) and the systematic uncertainties on the measurement are evaluated (Sect. IV.4). Finally, the quenching of the heat signal is obtained by dividing the values of Sect. III by the corrected values.
IV.1 Calibration with rays
The first step is the calibration of the detectors in keVee with -ray sources. An often overlooked difficulty in quenching factor measurements is that of the precise calibration of the detector in the low-energy range relevant for dark matter searches (10 to 30 keV, and even below for quenched signals). Eqs. 9 and 10 show that, for and , a 1% precision on requires a precision of 1.3% and 0.7% on the measurement of the heat and ionization signals, respectively.
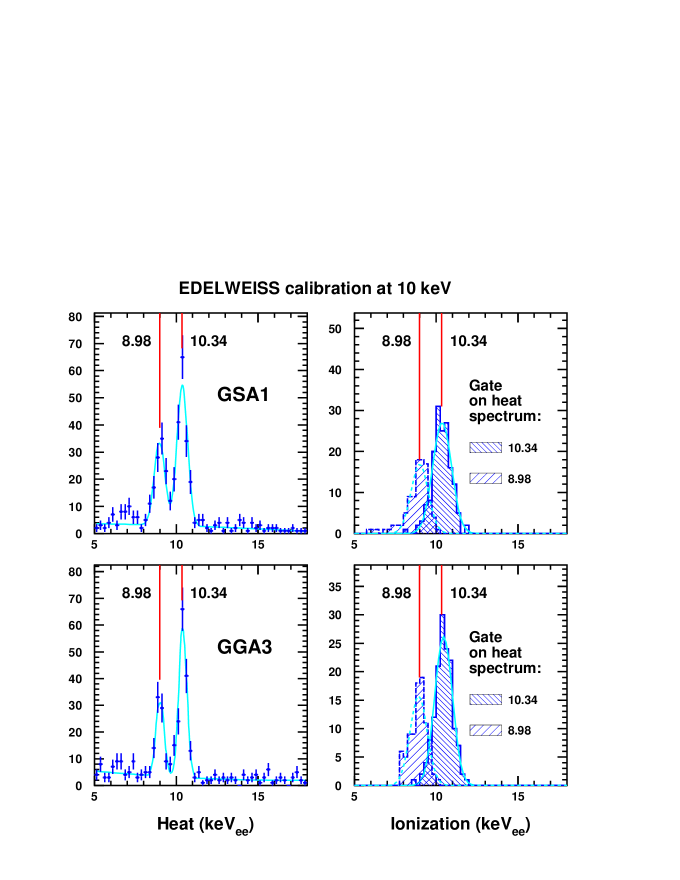
It is difficult to calibrate the response of the bulk of a detector to 10 keV rays because of their short attenuation length, which excludes the possibility of using external sources. This difficulty is somehow alleviated in semi-conductor detectors. Because of the good linearity of their ionization signal, the extrapolation of the calibration from higher energy is more reliable than, for example, scintillating detectors. In the case of germanium detectors in an underground and very-low background environment, there is the additional unique possibility to check the calibration at 10 keVee using the doublet arising from the slow decay of the cosmogenic isotopes 68Ge and 65Zn ( = 271 and 244 days, respectively), and also the isotope 71Ge arising from the activation of the detector with the 252Cf neutron source ( = 11.5 days). Fig. 3 shows the two peaks at 8.98 and 10.34 keV coming from the electron conversion decay of Ge and Zn, respectively, as recorded in EDELWEISS detectors in a low-background run following a neutron calibration. With these data, it is possible to control with a precision of 1% the absolute energy calibration at 10 keVee of the ionization and heat signals independently. At other energies, the relative calibration of the two signals can be easily checked using the distribution of the ratio of the two signals recorded in the Compton plateau produced by a 137Cs -ray source.
IV.2 Neutron calibration data
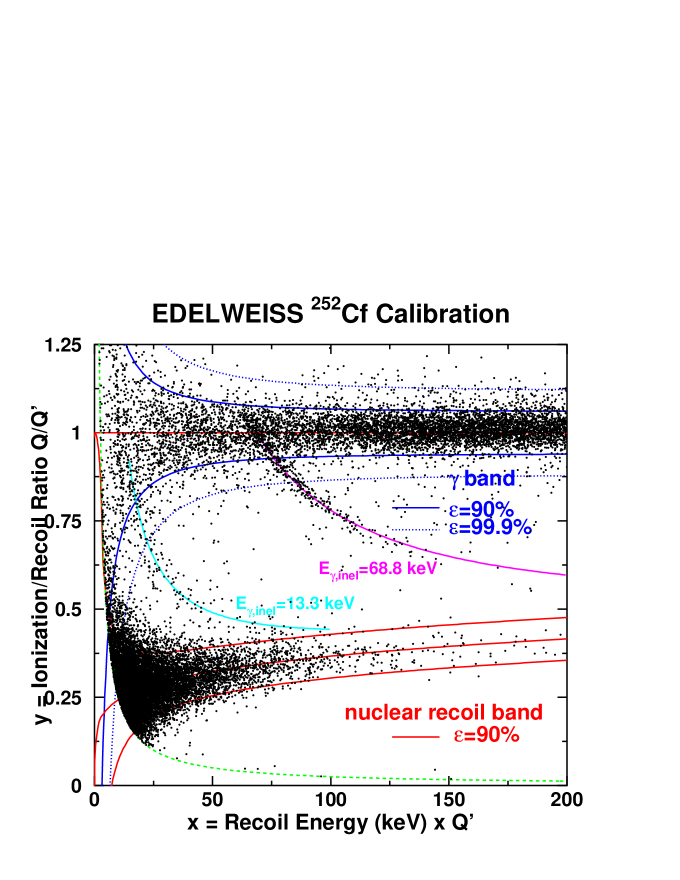
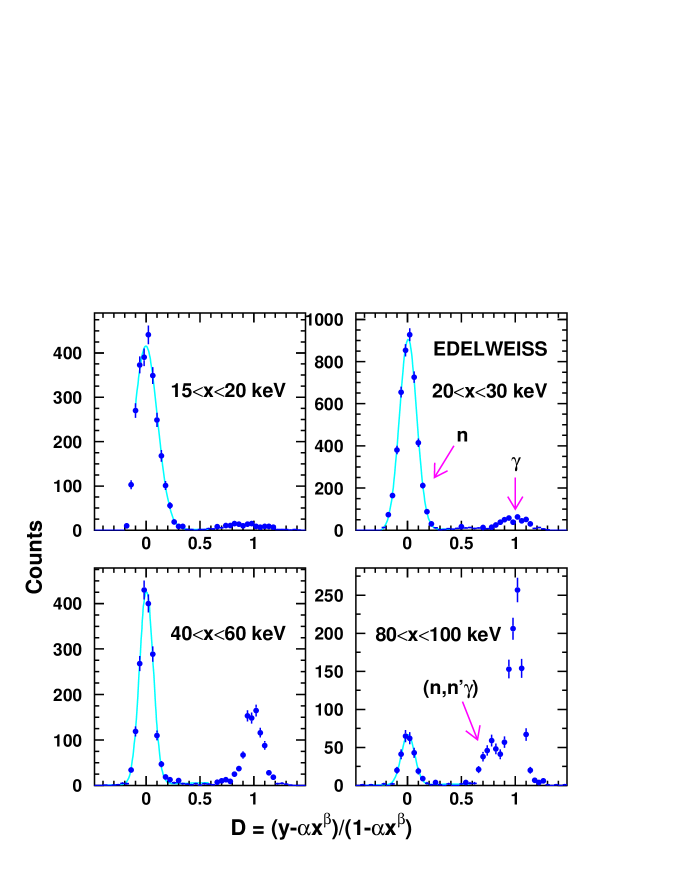
Fig. 4 shows the distribution of recorded in the detectors GSA1, GSA3 and GGA3 when exposed to the 252Cf neutron source. The data of these three detectors are combined in that plot because they have similar experimental resolutions.
Of the 20340 counts in Fig. 4, the overwhelming majority is part of four well-understood populations, described here. The first two populations are by far the most important. The first, centered at , corresponds to rays. It is well contained within the 90% efficiency zone computed from the experimental resolution on the heat and ionization channels for these detectors, also shown on that figure. The second population lies mostly inside the zone expected for Ge nuclear recoils. On Fig. 4, the center of this zone is parametrized as in Ref. edw2003 as a band centered at = , with and . Two lesser populations are observed, corresponding to the inelastic collision of a neutron on a 73Ge nucleus with the excitation of the 13.3 and 68.8 keV states. In these cases, the value of is the energy-weighted average of the quenching of the Ge recoil and of the electromagnetic radiation emitted in coincidence. Inelastic excitation of states decaying with higher-energy rays, observed as Compton electrons in the detector, would produce counts evenly spread between the two zones associated with electron and nuclear recoils, and over the entire energy range displayed in Fig. 4.
In Fig. 4, there is a clear trend for to increase with recoil energy for elastic nuclear scattering events. We define as the average values for this population, as a function of . The variations of within the energy intervals defined in Table 1 is not negligible at the level of precision required here. Accordingly, this energy dependence is removed by considering distributions of the variable , defined as:
| (13) |
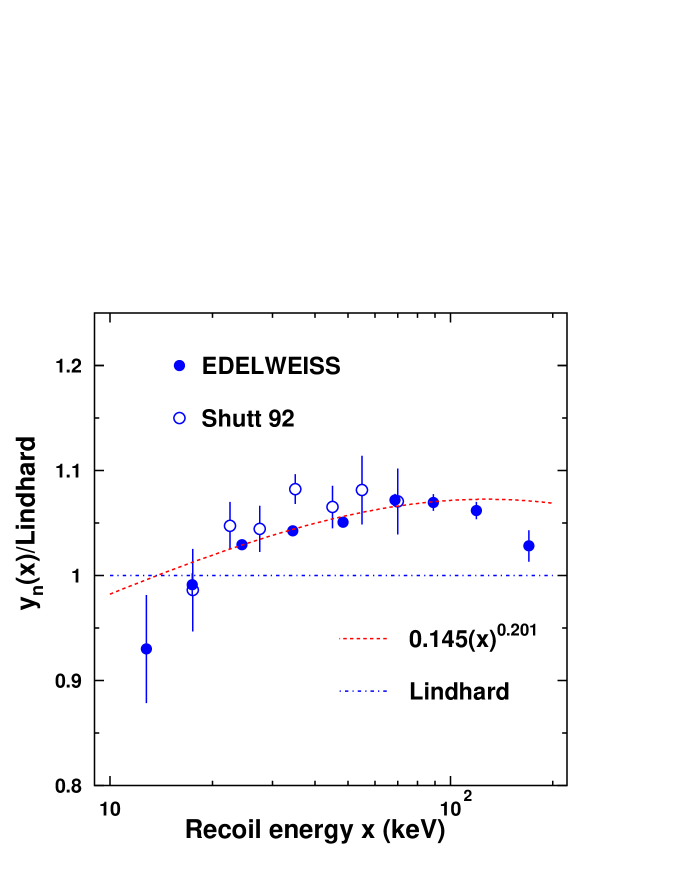
where and are chosen such as to describe best the behavior of . Examples of distributions recorded in the neutron calibration runs for different intervals of recoil energy are shown in fig. 5. In practice, the standard values edw2003 ; bib-edw2002 ; edw-calib of and are first used. The centroid of the distributions for elastic scattering events is extracted for each bin of . The values are transformed into values of using the inverse of Eq. 13. The results for the sum of the five EDELWEISS detectors under study are listed in the third column of Table 2. They are also shown in Fig. 6, where for clarity is divided by the corresponding prediction of the Lindhard theory, . The values are then least-square adjusted with the function , yielding values of and . The entire procedure is then repeated, but this time using the new values of and in Eq. 13. With these values, it is observed in Fig. 5 that the new distributions are well centered on . However, the values extracted from the new distributions are equal to the previous ones, indicating that the procedure to remove the energy dependence of does not depend strongly on the precise choice of and .
In Fig. 6, the EDELWEISS data are compared to those from Ref. bib-shutt . For both data sets, only statistical errors are shown. Except for the values at = 35 keV, the experimental results are compatible within the statistical uncertainties. However, two important sources of bias have not been corrected yet, and will be discussed in the following section. As Ref. bib-shutt was the first report of the observation of quenching effects in heat-and-ionization detector, it did not present the detailed information necessary for evaluating these biases. In particular, there is no quantitative statement concerning the precision of the -ray calibration, and no discussion of the effect of multiple scattering. As it will be shown in the following section, the multiple scattering of neutrons inside the detectors decreases the apparent value of . This effect could explain why the data from the 180 g central volume of the EDELWEISS detectors seem to lie systematically below those obtained with the relatively more compact detector of Ref. bib-shutt .
IV.3 Multiple scattering and energy scale corrections
In order to interpret the measured values as , the data must be corrected for two systematic effects: multiple scattering and the shift in energy scale when the variable is transformed into a true recoil energy .
It was shown in Ref. edw-calib that the fact that there are more than one neutron-nucleus interaction in a significant number of neutron scattering events has the consequence of shifting down the measured values of . For example, in an event where a single neutron produces two nuclear recoils of energy and , the apparent quenching is equal to the energy-weighted sum of and . Depending on the relative values of and , the weighted sum will lie somewhere between and . As 0, this means that the measured value of decreases as the contribution from multiple scattering increases.
This bias can be corrected with the help of Monte Carlo simulations. In EDELWEISS, the results of simulations bib-lem06 based on the computer codes GEANT3 and MCNPX were compared and found to give consistent results to within 1%. The corresponding correction factors to be applied to are listed in Table 2. They are of the order of 6 to 9%. They are larger by 2 to 3% compared with earlier simulations performed for Ref. edw-calib with GEANT3. Since then, problems with these simulations have been identified and solved, leading to a better agreement with MCNPX. However, since this correction relies entirely on simulations, the uncertainty on the correction procedure is taken as a third of the correction.
The second correction corresponds to the application of Eq. 12. It requires the knowledge of , and thus must be evaluated iteratively, first by evaluating it assuming =1, and then replacing the derived value in Eq. 12, and repeat until convergence. Since is very close to unity, only one iteration was found necessary to obtain stable corrections, listed in Table 2. The size of the correction is approximately 2%.
These two corrections are applied to the values of in the third column of Table 2 in order to obtain the values in the last column of the same table.
IV.4 Systematic uncertainties
The seventh column of Table 2 lists the systematic uncertainties identified in addition to that associated with the multiple scattering correction. The sources of systematic biases considered here are those associated with the data selection and with the uncertainties on the energy calibration of and , and on the value of .
The energy calibration is reliable to within 1%. In addition to the test described in Sect. IV.1, it was checked that the values of , the centroid of the distributions for electron recoils, stay within 1% of unity from run to run, whether with a neutron or -ray source or in the low-background runs. For the contribution of , the dependence of the heat gain as a function of the applied voltage (Eq. 5) was checked. Unaccounted deviations of more than 0.1 V are excluded, resulting in an uncertainty on of less than 1%. The uncertainty on due to the uncertainty on (Sect. II.1) is less than 0.5%.
Finally, the determination of the values was repeated for each of the five detectors individually. This not only checks the effects of detector-to-detector fluctuations of the calibration, but also the influence of the different experimental cuts. For example, the lower cut on is 2.5 keV for GGA3, GSA1 and GSA3, and is 3.5 keV for GeAl10 and GGA1. As discussed in Ref. edw2003 , this corresponds to thresholds on recoil energy of approximately 11 and 14 keV, respectively. The effect of this cut can be observed on Figs. 4 and 5 as a decrease of efficiency at the very lowest value of . For this reason, for values below 20 keV, values of below -0.1 are excluded from the analysis. As a result, the fluctuations in obtained from one detector to another for keV are larger than for most other intervals (Table 1).
For each interval in , the largest deviation of any detector from the quoted value is taken as a systematic uncertainty. This value is added in quadrature to 1% of the value of to yield the systematic uncertainty listed in Table 2. This conservative error tests possible deviations due to the technical differences between the GeAl, GGA and GSA detectors. It also tests the robustness of the measurement and in particular the reproducibility of the calibration procedure.
This systematic error is added in quadrature with the uncertainty associated with the multiple scattering correction and the statistical error, resulting in the total error quoted in the last column of Table 2. These three contributions represent typically relative errors of the order of 3%, 3% and 0.5% of the quoted values.
Two further systematic checks were performed. In the first one, the data selection and analysis procedure was applied to the simulated data sample described in Sect. IV.3. The values extracted from the single scatter events are found to agree with the parameterization that had been input into the simulation, within a precision of 1%. The systematic biases due to the finite energy resolution and the selection procedure are thus well within the quoted total systematic errors. In the second test, values of were also extracted from inelastic scattering events. In this test, the data were corrected for the presence of an unquenched ray with an energy of either 13.3 or 68.8 keV. The remaining ionization and heat energies, and , were input to Eqs. 6 and 7. Within statistical errors, the resulting distribution shows a band centered at the same values of as the equivalent distribution for elastic neutron scattering events. Because of the reduced statistics (1% of the elastic scattering sample), these data sets were not included in the final analysis.
The present method to evaluate assumes that the ionization quenching does not change between 17 mK (the temperatures at which is measured) and 77 K (the temperature for almost all of the measurements). The only direct experimental test of this assumption is provided by the measurements at 35 mK of Ref. bib-sicane . They are compatible with those performed at 77 K, within an experimental uncertainty of approximatively 5%. However, there is no compelling reason to suggest that depends on temperature, since the few percent variation of the gap in germanium over this temperature range should affect equally both types of recoils. Therefore, the temperature dependence of between 17 mK and 77 K is assumed to be negligible.
V Q’ results and discussion
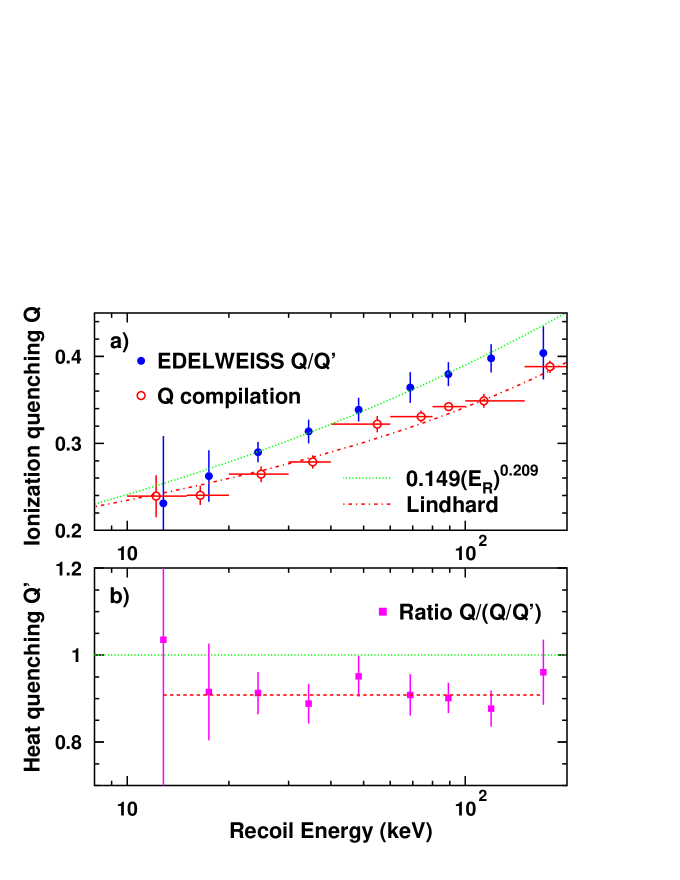
Table 3 summarizes the measurements of and from Sect. III and IV, respectively. These two data sets are also compared in Fig. 7a. Because of the correction for multiple scattering and the relation between and , the best fit to the data ( and ) differs slightly from the and values describing the data of Section IV.2. This figure shows that the values of are systematically larger than those of . As a consequence, the resulting values of deduced from their ratio are systematically lower than unity (see Table 3 and Fig. 7b). The weighted average of all measurements is 0.91. As the uncertainty on the measurements at different energies are correlated, it is not possible to reduce the error on this average. However, it can be said that all values and errors between 20 and 100 keV are consistent with = 0.91 0.05. Outside this energy range, larger discrepancies are not excluded, as the measurements are less precise. Typically, the contributions of the and measurements to the total uncertainty are 0.03 and 0.04, respectively. The latter error could be reduced by improving our understanding of the influence of multiple scattering.
This determination of is the most precise measurement of quenching in the bulk of a low-temperature bolometric detector (Refs. bib-zhou ; bib-aless , plotted on Fig. 1). It is three times more precise than the direct germanium measurementbib-sicane . It is the first precise measurement based on data other than Pb and Po surface recoils from U/Th chain products.
The measurement indicates that the thermal responses of our detectors to nuclear and electron recoils are different. This is an incitation to evaluate with more precision the effects that could be responsible. For example, simulations of the slowing down of 10 to 200 keV germanium recoils in germanium with the simplest version of the program SRIM2003 bib-srim provide some indications that a few percent of the kinetic energy of the initial recoil can be trapped in defects due to displacements of atoms in the matrix. However the actual fraction depends considerably on the details of the simulation. How long these defects persist in the out-of-equilibrium environment along the recoil track is also a delicate question to address, especially in a low-temperature semiconductor medium bib-mdsim .
It should be noted that the uncertainty related to the value of does not affect the evaluation of the efficiency for nuclear recoils, nor the rejection capabilities of the EDELWEISS detectors. This is because the bands for nuclear and electronic recoils are determined for every detector using a neutron source calibration, with exactly the same experimental conditions as in the physics runs. These bands are defined in terms of as observed in a given detector, and do not rely on any prediction concerning and . However, the value of does affect the interpretation of in terms of absolute energy, and thus affects the overall efficiency of the detector because of the presence of an experimental threshold. The effect of a shift in energy scale on the limits on the WIMP-nucleon cross-section set by the EDELWEISS data was studied in Ref. edw2003 . In this case, a 10% shift of the energy scale was found to result in a 10% to 20% shift on the cross-section limits, a small effect at the scale of the present sensitivity of the experiments. In addition, the evaluation of both and presented here are among the most precise quenching measurements for any detector used in the direct search for dark matter. In contrast, little is available concerning the scintillation quenching of iodine in NaI bib-qiode . The experimental data on the quenching in Xe are only now just starting to converge and to cover the low energy range relevant for dark matter searches bib-qxe . The wealth of available data on germanium and the consistency of the results make it one of the most reliable technique for detecting and identifying nuclear recoils.
VI Conclusion
The heat quenching factor (the ratio of the heat signals produced by nuclear and electron recoils of equal energy) of the heat-and-ionization germanium bolometers used by the EDELWEISS collaboration has been measured. It is shown that the calibration of these detectors with neutrons provides a measurement of the ratio , where and are the quenching factors of the ionization yield and heat measurement, respectively. Consequently, the existing direct measurements of have been reviewed and the resulting values have been divided by the EDELWEISS measurements. The resulting heat quenching factor for germanium recoil energies between 20 and 100 keV is = 0.91 0.03 0.04, where the two errors are the contributions from the and measurements, respectively. The evaluation of both and presented here are among the most precise quenching measurements for any detector used in the direct search for dark matter.
Acknowledgements.
The help of the technical staff of the Laboratoire Souterrain de Modane and the participant laboratories is gratefully acknowledged. This work has been partially supported by the EEC Applied Cryodetector network (Contract No. HPRN-CT-2002-00322) and the ILIAS integrating activity (Contract No. RII3-CT-2003-506222).References
- (1) D.S. Akerib et al (CDMS Coll.), Phys. Rev. D72 (2005) 052009.
- (2) V. Sanglard et al (EDELWEISS Coll.), Phys. Rev. D 71 (2005) 122002.
- (3) J.D. Lewin and P.F. Smith, Astropart. Phys. 6 (1996) 87.
- (4) J. Lindhard et al, K. Dan. Viderask. Selsk., Math. Fys. Medd 33 (1963) 10 and 36 (1968) 10.
- (5) C. Chasman, K.W. Jones and R.A. Ristinen, Phys. Rev. Lett. 15 (1965) 245.
- (6) A.R. Sattler, F.L. Vook and J.M. Palms, Phys. Rev. 143 (1966) 588.
-
(7)
C. Chasman et al, Phys. Rev. 154 (1967) 239;
C. Chasman et al, Phys. Rev. Lett. 21 (1968) 1430. -
(8)
K.W. Jones et al, Phys. Rev. A 11 (1975) 1347;
K.W. Jones et al, Phys. Rev. C 4 (1971) 125. - (9) Y. Messous et al, Astropart. Phys. 3 (1995) 361.
- (10) L. Baudis et al, Nucl. Instr. Meth. A 418 (1998) 348.
- (11) E. Simon et al. Nucl. Instr. Meth. A 507 (2003) 643.
- (12) J.W. Zhou et al, Nucl. Instr. Meth. A 349 (1994) 225.
-
(13)
A. Alessandrello et al, Phys. Lett. B 408 (1997) 465;
A. Alessandrello et al, Phys. Lett. B 384 (1996) 316. - (14) T. Shutt et al, in Low Temperature Detectors, edited by F.S. Porter, D. McCammon, M. Galeazzi and Stahle, AIP Conf. Proc. No 605 (AIP, Melville, NY, 2002) p 513.
- (15) T. Shutt et al, Phys. Rev. Lett. 69 (1992) 3425.
- (16) G.F. Knoll, Radiation Detection and Measurement, 2nd ed., Wiley, New York, 1989.
- (17) X.-F. Navick et al., Nucl. Instr. Meth. A 444 (2000) 361.
-
(18)
M.P. Chapellier et al., Physica B 284-288 (2000) 2135;
P.N. Luke, J. Appl. Phys. 64 (1988) 6858;
B. Neganov and V. Trofimov, USSR patent No 1037771, 1981; Otkrytia i izobreteniya 146 (1985) 215. -
(19)
A. Benoît et al (EDELWEISS Coll.), Phys.Lett. B 545
(2002) 43;
A. Benoît et al (EDELWEISS Coll.), Phys. Lett. B 513 (2001) 15. - (20) O. Martineau et al, (EDELWEISS Coll.), Nucl. Instr. Meth. A 530 (2004) 426.
- (21) R. Lemrani and G. Gerbier, to be published in Proceedings of TAUP 2005: the Ninth Int. Conf. on Topics in Astroparticle and Underground Physics, 10-14 September 2005, Zaragoza, Spain (J. Physics: Conf. Series).
-
(22)
SRIM 2003 program (http://www.srim.org/);
J. F. Ziegler J. P. Biersack and U. Littmark, The Stopping and Range of Ions in Solids, Pergamon Press, New York, 1985. - (23) K. Nordlund, M. Ghaly, R. S. Averback, M. Caturla, T. Diaz de la Rubia and J. Tarus, Phys. Rev. B 57 (1998) 7556.
-
(24)
G. Gerbier et al, Astropart. Phys. 11 (1999) 287;
D. R. Tovey et al, Phys. Lett. B 433 (1998) 150. -
(25)
E. Aprile et al, Phys. Rev. D 72 (2005) 072006;
D. Akimov et al, Phys. Lett. B 524 (2002) 245.
| Refs. | ||||||
|---|---|---|---|---|---|---|
| (keV) | (keV) | |||||
| 5-10 | bib-messous | 1.05 0.08 | - | 8.6 | 0.230 | 0.241 0.019 |
| 10-15 | bib-chasman2 ; bib-messous | 0.99 0.10 | 2.01 | 12.2 | 0.241 | 0.239 0.024 |
| 15-20 | bib-chasman2 ; bib-messous | 0.95 0.04 | 0.34 | 16.4 | 0.252 | 0.240 0.011 |
| 20-30 | bib-chasman1 ; bib-chasman2 ; bib-messous | 0.98 0.03 | 1.29 | 24.9 | 0.269 | 0.265 0.009 |
| 30-40 | bib-chasman1 ; bib-messous | 0.98 0.03 | 1.34 | 35.4 | 0.284 | 0.279 0.008 |
| 40-60 | bib-chasman1 ; bib-chasman2 ; bib-baudis | 1.05 0.03 | 0.48 | 54.9 | 0.306 | 0.322 0.009 |
| 60-80 | bib-chasman1 ; bib-baudis ; bib-sicane | 1.03 0.02 | 0.71 | 74.0 | 0.323 | 0.331 0.007 |
| 80-100 | bib-chasman1 ; bib-baudis ; bib-sicane | 1.02 0.01 | 0.31 | 89.3 | 0.334 | 0.342 0.005 |
| 100-150 | bib-chasman1 ; bib-baudis ; bib-sicane ; bib-chasman2 | 1.00 0.02 | 2.21 | 113.6 | 0.350 | 0.349 0.008 |
| 150-200 | bib-baudis | 1.01 0.02 | - | 178.2 | 0.384 | 0.388 0.007 |
| Stat. | Multiple scattering | Calib. | |||||
|---|---|---|---|---|---|---|---|
| (keV) | (keV) | error | correction | (Eq. 12) | error | ||
| 10-15 | 12.8 | 0.226 | 0.014 | 1.039 0.013 | 0.985 | 0.017 | 0.231 0.077 |
| 15-20 | 17.4 | 0.252 | 0.003 | 1.059 0.020 | 0.983 | 0.008 | 0.263 0.029 |
| 20-30 | 24.4 | 0.276 | 0.001 | 1.070 0.023 | 0.983 | 0.003 | 0.290 0.012 |
| 30-40 | 34.4 | 0.295 | 0.001 | 1.083 0.028 | 0.982 | 0.004 | 0.314 0.014 |
| 40-60 | 48.4 | 0.315 | 0.001 | 1.096 0.032 | 0.982 | 0.003 | 0.339 0.013 |
| 60-80 | 68.7 | 0.341 | 0.002 | 1.088 0.029 | 0.981 | 0.005 | 0.364 0.017 |
| 80-100 | 89.1 | 0.357 | 0.003 | 1.084 0.028 | 0.980 | 0.004 | 0.380 0.014 |
| 100-150 | 119.3 | 0.375 | 0.003 | 1.083 0.028 | 0.979 | 0.006 | 0.398 0.016 |
| 150-200 | 170.1 | 0.391 | 0.006 | 1.057 0.019 | 0.978 | 0.012 | 0.404 0.031 |
| (keV) | (keV) | |||
|---|---|---|---|---|
| 10-15 | 12.8 | 0.231 0.077 | 0.239 0.024 | 1.04 0.36 |
| 15-20 | 17.4 | 0.263 0.029 | 0.240 0.011 | 0.91 0.11 |
| 20-30 | 24.4 | 0.290 0.012 | 0.265 0.009 | 0.91 0.05 |
| 30-40 | 34,4 | 0.314 0.014 | 0.279 0.008 | 0.89 0.05 |
| 40-60 | 48.4 | 0.339 0.013 | 0.322 0.009 | 0.95 0.05 |
| 60-80 | 68.7 | 0.364 0.017 | 0.331 0.007 | 0.91 0.05 |
| 80-100 | 89.1 | 0.380 0.014 | 0.342 0.005 | 0.90 0.03 |
| 100-150 | 119.3 | 0.398 0.016 | 0.349 0.008 | 0.88 0.04 |
| 150-200 | 170.1 | 0.404 0.031 | 0.388 0.007 | 0.96 0.07 |