Have we detected the most luminous ULX so far?
Abstract
We report the XMM–Newton detection of a moderately bright X–ray source (F erg cm-2 s-1) superimposed on the outer arms of the inactive spiral galaxy MCG–03-34-63 (z=0.0213). It is clearly offset from the nucleus (by about 19”) but well within the D25 ellipse of the galaxy, just along its bar axis. The field has also been observed with the Hubble Space Telescope (HST) enabling us to compute a lower limit of on the X–ray to optical flux ratio which, together with the X–ray spectrum of the source, argues against a background AGN. On the other hand, the detection of excess X–ray absorption and the lack of a bright optical counterpart argue against foreground contamination. Short–timescale variability is observed, ruling out the hypothesis of a particularly powerful supernova. If it is associated with the apparent host galaxy, the source is the most powerful Ultra–Luminous X–ray source (ULX) detected so far with a peak luminosity of erg s-1 in the 0.5–7 keV band. If confirmed by future multi–wavelength observations, the inferred bolometric luminosity ( erg s-1) requires a rather extreme beaming factor (larger than 115) to accommodate accretion onto a stellar–mass black hole of and the source could represent instead one of the best intermediate–mass black hole candidate so far. If beaming is excluded, the Eddington limit implies a mass of for the accreting compact object.
keywords:
X-rays: binaries – X-rays: individual: XMMU J132218.3–164247 – galaxies: spiral – galaxies: individual: MCG–03-34-63 – black hole physics1 Introduction
All known black holes belong to two families: stellar–mass black holes are seen in X–ray binaries, while super–massive ones are present in the centres of galaxy bulges sometimes revealing themselves as Active Galactic Nuclei (AGN). While the former have masses up to (e.g. Fryer & Kalogera 2001), the latter have masses in the range –, the smaller–mass super–massive black hole to date being that in NGC 4395 with a mass of a few times (Peterson et al. 2005). Although it has long been thought that intermediate–mass black holes (IMBH) with masses – may form in dense stellar clusters (e.g. Frank & Rees 1976; Portegies Zwart et al. 1999), there are no known IMBHs filling the mass–gap between the two known families. If present, active IMBHs may reveal themselves as accreting X–ray sources exceeding by a large factor the Eddington luminosity of stellar–mass black holes (L erg s-1 for a “maximal–mass” stellar–mass black hole of ).
Ultra–Luminous X–ray sources (ULX) are off–nuclear point–like X–ray sources seen in other galaxies (than the Milky Way) with luminosities exceeding L (see e.g. Colbert & Mushotzky 1999; Mushotzky 2004). Since the Eddington argument implies a lower limit of on the mass of the central object, ULXs are often regarded as IMBH–candidates (see e.g. Miller & Colbert 2003; Fabbiano 2005). However, inferring a lower limit on the mass of an accreting compact object only from its bolometric luminosity can lead to misleading results. This is because, if potential anisotropies of emission (e.g. beaming, see Reynolds et al. 1997; King et al. 2001) or accretion (e.g. radiation–driven inhomogeneous accretion, see Begelman 2002) are not taken into account, the lower limit on the mass of the object may be severely over–estimated. Both the beaming and inhomogeneous accretion scenarios can be invoked to explain luminosities up to a few times erg s-1 with accretion on standard stellar–mass black holes. However, geometric beaming (e.g. a funnel geometry) and inhomogeneous accretion can only provide an effective luminosity exceeding the Eddington limit by a factor 23 (Madau 1988) and 10, (Ruszkowski & Begelman 2003) respectively. Thus, for ULXs with luminosities exceeding erg s-1, relativistic beaming seem the only option to avoid the presence of an IMBH. It is thus clear that the best IMBH–candidates are ULXs in the high end of the luminosity function with luminosity approaching (or possibly above) erg s-1. The best IMBH–candidate so far is a ULX in the galaxy M 82. Its extreme luminosity (up to erg s-1), together with the detection of a 54 mHz QPO and an Fe K line (which both argue against a beamed source), make it difficult not to invoke an IMBH (Matsumoto et al. 2001; Kaaret et al. 2001; Strohmayer & Mushotzky 2003).
Here we report the XMM–Newton detection of an X–ray source which is plausibly a ULX in the galaxy MCG–03-34-63. If it is at the distance of its apparent host galaxy, the bolometric luminosity of erg s-1, exceeds by a factor the Eddington luminosity for a stellar–mass black hole, making it the most luminous ULX ever detected, and possibly one of the best IMBH–candidate so far.
2 MCG–03-34-63 ULX–1
XMM–Newton observed the active galaxy IRAS 13197–1627 (z=0.0165) on 2005 January 24 for about 45 ks (Miniutti et al. 2006). IRAS 13197–1627 is not isolated in the sky and the inactive spiral galaxy MCG–03-34-63 (z=0.0213) is only 1.8’ away towards NW, in the field of view of all the XMM–Newton EPIC cameras. MCG–03-34-63 has been often confused with IRAS 13197–1627 (a.k.a. MCG–03-34-64) until 1996, where it was detected in the radio with a total flux of 93.4 mJy at 4.9 GHz (Colbert et al. 1996). It is also a relatively luminous IR galaxy with , most likely associated with star–formation (Surace, Sanders & Mazzarella 2004).
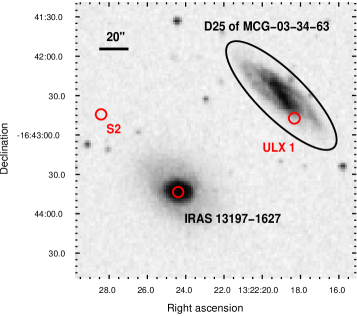
In the top left panel of Fig. 1, we show the optical Digitized Sky Survey (DSS) image centred between the two galaxies. We also show as circles the X–ray sources detected in the field, and the D25 ellipse of MCG–03-34-63 (the dimension defined to be equal to 25 mag arcsec-2). Besides IRAS 13197–1627, the second strongest X–ray source is superimposed on the outer arms of the galaxy MCG–03-34-63111A second source (S2 in Fig. 1) is also detected. Its X–ray spectrum suggests it is a Compton–thin Seyfert 2 galaxy at z0.16 (Miniutti et al. in preparation).. Its X–ray position is displaced by about 19” in the SW direction with respect to the optical centre of the galaxy and its coordinates (J2000) are RA 13h22m18.3s and DEC -16d42m47.7s. Its official name is thus XMMU J132218.3–164247 and we shall call it ULX 1 here for brevity. The X–ray position of ULX 1 has been determined by running the source detection task edetect_chain and is corrected by cross–correlating 4 X–ray sources with the USNO–B1.0 optical catalogue (Monet et al. 2003). The 1 r.m.s. absolute astrometric accuracy of XMM–Newton222see Kirsh et al. 2006, XMM–Newton calibration document XMM-SOC-CAL-TN-0018 at http://xmm.vilspa.esa.es is about 2”. Here, we make a conservative choice and we assume an error–circle of 2” in radius. The X–ray position will be soon known with much better accuracy thanks to an approved Chandra observation. No optical point–like counterpart is seen in the DSS meaning that the source is fainter than 21 in R and 22.5 in B.
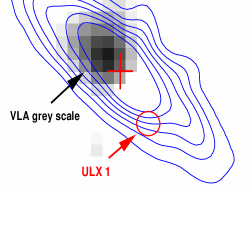
We also analysed the Optical Monitor (OM) mosaic of the field images (UVW1 filter). The UV contours trace MCG–03-34-63, peak at about 17” NE of the galaxy centre, and no point–like source corresponds to ULX 1. Radio images (VLA 21 cm, 1993 May) have been analysed as well and, besides the AGN IRAS 13197–1627, there is an excess within the D25 ellipse of MCG–03-34-63 which is however not consistent with ULX 1 nor exactly centred on the galaxy optical centre (see top right panel of Fig. 1). At 4.9 GHz, the nucleus of MCG–03-34-63 is clearly detected (Colbert et al. 1996), but there is no radio excess at the position of ULX 1.
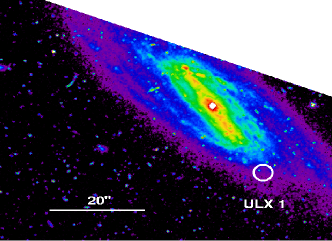
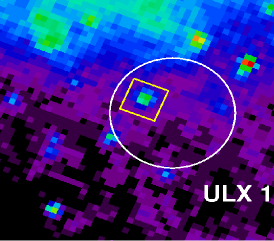
The Hubble Space Telescope (HST) also observed the region in July 1994 for 500 s with the WFPC2 and the F606W filter applied. A portion of the HST image is shown in the bottom left panel of Fig. 1 together with a white circle of 2” radius centred on the X–ray position of ULX 1 and representing the XMM–Newton error–circle. The HST astrometry has been corrected by using 5 common sources with the USNO–B1.0 catalogue. It is interesting to notice that ULX 1 lies along the bar axis of MCG–03-34-63 where the interstellar medium may be stressed and where off–nuclear X–ray sources have been found in other galaxies (see e.g. in NGC 1672, Brandt et al. 1996). In the bottom right panel of Fig. 1, we show a zoom into the HST image. The brightest optical source within the XMM–Newton error–circle is marked with a yellow box and represents the most likely optical counterpart (if any) of ULX 1. Another faint source is present in the error–circle and two are seen at its edges towards SE.
In the X–rays, the field has been observed with ASCA and BeppoSAX, but the moderate angular resolution of the two X–ray mission detectors does not allow us to distinguish between the bright AGN IRAS 13197–1627 and ULX 1. IRAS 13197–1627 is detected by Swift/BAT (Markwardt et al. 2005). However, given the 17’ angular resolution nothing can be said on ULX 1. No pointed ROSAT observation exists and ULX 1 is too faint to be detected in the ROSAT All Sky Survey.
3 X–ray data analysis
ULX 1 provides 457 background–corrected counts in the EPIC–pn camera, and about 300 in each of the MOS detectors in the 0.5–7 keV band. We extracted the X–ray light curve of ULX 1 from the MOS+pn detectors to search for short–timescale variability. Given the low count rate (about 0.025 Cts/s), we chose a relatively long time bin of 2.9 ks in order to reduce the errors on the individual data points. The resulting background-subtracted light curve is shown in Fig. 2. A fit with a constant gives for 12 dof, showing the the source is variable at the 99.3 per cent confidence level. By applying the Kolmogorov–Smirnov test, the significance of the variability is increased to the 99.94 per cent level.

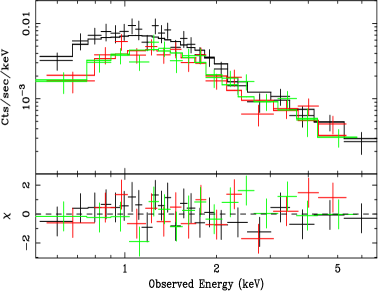
We also extracted the X–ray spectra from both the pn and MOS cameras in the same 0.5–7 keV band. As a first attempt to describe the X–ray spectral shape of ULX 1, we consider an absorbed power law model and we fix the absorbing column to the Galactic value, i.e. at cm-2 (Dickey & Lockman 1990). The joint fit to the pn and MOS data is unacceptable ( for 51 dof) because the spectrum is more curved than the model, suggesting the presence of excess absorption. We then keep the Galactic column fixed, but add a second (neutral) absorption component. The statistical quality of the fit improves dramatically and we obtain for 50 dof. We measure an excess absorption column density of cm-2, while the power law has a slope . The spectra, best–fit model and residuals are shown in Fig. 3. We point out that the observed amount of excess absorption is typical for ULXs, suggesting that part of it originates in the ULX environment (Swartz et al. 2004; Winter, Mushotzky & Reynolds 2006). The X–ray spectral slope also compares very well with other ULXs and lies at the boundary between “low–state” and “high–state” sources (as classified by Winter et al. 2006).
The observed 0.5–7 keV flux is erg cm-2 s-1. By extrapolating the model up to 10 keV, the source has a 0.5–10 keV flux of erg cm-2 s-1. Note that the observed variability (see Fig. 2) implies that during the observation ULX 1 reached a flux of about erg cm-2 s-1 in the 0.5–10 keV band.
3.1 The extreme luminosity of ULX 1
The excess absorption we detect and the lack of a bright optical counterpart (see discussion below) makes it unlikely that the source is a foreground object, though we cannot exclude it. If so, the X–ray luminosity of the source can be computed as a lower limit under the hypothesis that it is at least at the distance of MCG–03-34-63 (z=0.0213). By using our best–fitting absorbed power–law model, it turns out that ULX 1 has an intrinsic luminosity L erg s-1 in the 0.5–7 keV band and L erg s-1 once extrapolated to 10 keV (with ks s-1, , and ). If the light curve variability is taken into account, the source reached a luminosity of erg s-1 ( erg s-1) in the 0.5–7 keV (0.5–10 keV) during the XMM–Newton observation.
We point out that of the 230 ULXs detected and catalogued up to now (e.g. Liu & Mirabel 2005; Ptak et al. 2006), only a few have luminosities exceeding erg s-1. Luminosities of the order of erg s-1 or above are extremely unusual, as also shown by the luminosity cutoff in the cumulative luminosity functions (Swartz et al. 2004; Gilfanov, Grimm & Sunyaev 2004). This makes ULX 1 a rare, if not unique, source among the other known ULXs.
3.2 Adding a thermal component
To test the similarity of the X–ray properties of ULX 1 with stellar–mass accreting black holes, we also tried two different models: a multi–colour disc (MCD) spectrum (DISKBB) plus power law, and a Comptonization model (COMPTT) that describes Compton up–scattering in a corona of optical depth and electron temperature from a Wien distribution of soft seed photons from the disc (with temperature ). It is worth noting here that the detection of a thermal component could give important (though not conclusive) insights on the compact object mass since, for standard accretion disk, (objects hosting black-holes of have typical temperatures of 1 keV). A cool thermal component from the accretion disc may thus provide some indication for a particularly massive black hole (see e.g. Miller, Fabian & Miller 2004).
However, when applied to the pn and MOS data, neither model provides a statistically significant improvement with respect to the power law one. We can only measure 90 per cent upper limits for the temperature of the putative thermal component of keV (MCD model), and keV (COMPTT). Thus, the data are consistent with a cool disc, but the thermal component is by no means required by the data.
4 An extreme ULX or a background AGN?
The extreme luminosity estimated above assumes that ULX 1 lies within its apparent host galaxy MCG–03-34-63. Luminosities approaching erg s-1 can also be reached by extremely powerful supernovae occurring in dense environments, but given that their emission either fades or remains constant over a 1 yr timescale (e.g. Schlegel 1995), the observed X–ray short–timescale variability rules out this hypothesis. However, ULX 1 could be a background X–ray source. In this case, the inferred luminosity is only a lower limit and a background AGN could well be invoked to explain the X–ray power of the source. This hypothesis can only be tested observationally by obtaining an optical spectrum of the counterpart (if any), but we can nevertheless provide two arguments in favour of an association with MCG–03-34-63.
4.1 The – estimator
The number of expected X–ray sources within a given area can be estimated by assuming that our field is characterised by the same – as observed from deep XMM–Newton exposures of the Lockman Hole (Hasinger et al. 2001). Our ULX candidate has a 0.5–2 keV flux of erg cm-2 s-1 and the Lockman Hole – implies the presence of about 30 sources per square degree with the same or higher flux (we point out that 30 sources is a conservative estimate). Since the D25 ellipse of MCG–03-34-63 covers an area of square degrees, the number of expected sources within D25 is 0.007. In the 2–10 keV band, we measure a flux of erg cm-2 s-1 which again corresponds to about 30 sources per square degree providing the same small number of expected sources.
As mentioned, this is only the number of expected sources within a given area (the D25 ellipse of MCG–03-34-63) and not directly the probability that ULX 1 is a background AGN. We provide the above estimate for comparison with previous works on other ULXs, but we must point out that an accurate estimate of the true probability that an X–ray source within a galaxy is a background AGN has yet to be produced, and is well beyond the purpose of this Letter.
4.2 The X–ray to optical flux ratio
Another possible way to constrain the nature of the source is by considering the X–ray to optical flux ratio (X/O). AGN have typical X/O below 10 and detailed studies of the optically faint sources in the XMM–Newton HELLAS2XMM and Chandra deep fields surveys reveal that less than 5 per cent of the hard X–ray selected sources have X/O higher than 90 (Mignoli et al. 2004; Civano, Comastri & Brusa 2005).
We have computed the X/O for the brightest, and most likely optical counterpart, HST source in the XMM–Newton error–circle (i.e. the source within the yellow box in the bottom right panel of Fig. 1). From the HST image, we estimate a magnitude m giving rise to R (see Holtzman et al. 1995 for the conversion between HST and Johnson magnitudes). By using the definition , we then estimate X/O which represents a lower limit on the X/O of ULX 1 (where FX is the 2–10 keV flux). As mentioned above, sources with X/O represent less than 5 per cent of the hard X–ray sources population in Chandra and XMM–Newton deep fields. Moreover, the X–ray and near infrared data of high–X/O sources in the Chandra deep fields and the HELLAS2XMM survey identify most (if not all) sources as heavily absorbed AGN (Civano, Comastri & Brusa 2005; Mignoli et al. 2004). In the case of ULX 1, the steep photon index and moderate absorption are inconsistent with this scenario. The detection of an unobscured background AGN with X/O would be a very rare event on its own, and its detection within the D25 ellipse of a spiral galaxy seems highly unlikely, supporting the idea that ULX 1 is not a background AGN but more likely an X–ray binary. It should also be pointed out that the ULXs that have been later classified as background AGN had standard rather than high X/O (Foschini et al. 2002; Masetti et al. 2003).
5 Conclusions
If ULX 1 is indeed associated with its apparent host galaxy MCG–03-34-63, its luminosity greatly exceeds that of a neutron star, and we have to consider an accreting black hole. In this case, by considering as a template stellar–mass accreting black holes in our Galaxy, the bolometric luminosity is likely to be a few times higher than the 2–10 keV luminosity. By extending our spectral model, we estimate an intrinsic luminosity of erg s-1 in the 0.2–150 keV band, which we take as a reasonable proxy for the bolometric luminosity of ULX 1. In the absence of beaming, the Eddington limit can be used to infer the presence of a black hole, i.e. ULX 1 would be powered by an accreting IMBH.
To reduce the mass of the compact object within the acceptable range of stellar–mass black holes, the intrinsic luminosity has to be boosted by a factor , which could be due to beaming. The simplest candidate mechanism to produce X–ray beaming in an accreting source is to consider a thick accretion disc with a smaller optical depth over a limited range of angles around the rotation axis producing thereby a central funnel. Such a geometry has been investigated by Madau (1998) who found that if maximal beaming is considered, the effective observed luminosity () can exceed the Eddington limit by a factor of 23 (see also Misra & Sriram 2003 who derived a much smaller factor of 5). Thus, even by considering maximal beaming with , ULX 1 does still require a black hole with mass . The mass of the central black hole could be in principle reduced to 10–20 by considering maximal beaming and a source which is super–Eddington by a large factor (5–10), which seems a rather finely–tuned choice of the parameters. However, Begelman, King & Pringle (2006) recently pointed out that such a scenario is possible though it would predict a strong soft thermalized component (not required by the X–ray spectrum of ULX 1). Beaming can also occur if the X–ray emission is associated with a relativistic jet whose axis is aligned with the line of sight, as proposed by e.g. Reynolds et al. (1997) for ULXs. Indeed, a source with the jet axis aligned within a few degrees with our line of sight and with a sufficiently high Lorentz factor () could account for the observed luminosity with a sub–Eddington jet from a stellar–mass black hole.
Acknowledgements
Based on observations obtained with XMM-Newton, an ESA science mission with instruments and contributions directly funded by ESA Member States and NASA. This research made use of observations made with the NASA/ESA Hubble Space Telescope, obtained from the Data Archive at the Space Telescope Science Institute, which is operated by the Association of Universities for Research in Astronomy, Inc., under NASA contract NAS 5-26555. The Digitized Sky Surveys were produced at the Space Telescope Science Institute under U.S. Government grant NAG W-2166 based on data obtained using the Oschin Schmidt Telescope on Palomar Mountain and the UK Schmidt Telescope. G. Miniutti thanks the PPARC for support. GP, MD, MC and G. Malaguti thank ASI financial support under contract I/023/05/0. ACF thanks the Royal Society for support. PG is supported by an ESO (European Southern Observatory) Fellowship. We would like to thank the referee for her/his constructive criticisms and suggestions.
References
- [\citeauthoryearBegelman 2002] Begelman M.C., 2002, ApJ, 568, L97
- [\citeauthoryearBegelman, King & Pringle 2006] Begelman M.C., King A.R., Pringle J.E., 2006, MNRAS in press (preprint astro-ph/0604497)
- [\citeauthoryearBrandt, Halpern & Iwasawa 1996] Brandt W.N., Halpern J.P., Iwasawa K., 1996, MNRAS, 281, 687
- [\citeauthoryearCivano, Comastri & Brusa 2005] Civano F., Comastri A., Brusa M., 2005, MNRAS, 358, 693
- [\citeauthoryearColbert et al. 1996] Colbert E.J.M., Baum S.A., Gallimore J.F., O’Dea C.P., Christensen J.A., 1996, ApJ, 467, 551
- [\citeauthoryearColbert & Mushotzky 1999] Colbert E., Mushotzky R.F., 1999, ApJ, 519, 89
- [\citeauthoryearDickey & Lockman 1990] Dickey J.M., Lockman F.J., 1990, ARAA, 28, 215
- [\citeauthoryearMarkwardt et al. 2005] Markwardt C.B., Tueller J., Skinner G.K., Gehrels N., Barthelmy S.D., Mushotzky R.F., 2005, ApJ, 633, L77
- [\citeauthoryearFabbiano 2005] Fabbiano G., 2005, Science, 307, 533
- [\citeauthoryearFoschini et al. 2002] Foschini L. et al., 2002, A&A, 396, 787
- [\citeauthoryearFrank & Rees 1976] Frank J, Rees M.J., 1976, MNRAS, 176, 633
- [\citeauthoryearFryer & Kalogera 2001] Fryer C.L., Kalogera V., 2001, ApJ, 554, 548
- [\citeauthoryearGilfanov, Grimm & Sunyaev 2004] Gilfanov M., Grimm H.–J., Sunyaev R., 2004, MNRAS, 351, 1365
- [\citeauthoryearHasinger et al. 2001] Hasinger G. et al., 2001, A&A, 365, L45
- [\citeauthoryearHoltzman et al. 1995] Holtzman J.A., Burrows C.J., Casertano S., Hester J.J., Trauger J.T., Watson A.M., Worthey G., 1995, PASP, 107, 1065
- [\citeauthoryearKaaret et al. 2001] Kaaret P., Prestwich A. H., Zezas A., Murray S.S., Kim D.-W., Kilgard R.E., Schlegel E.M., Ward M.J., 2001, MNRAS, 321, L29
- [\citeauthoryearKing et al. 2001] King A.R., Davies M.B., Ward M.J., Fabbiano G., Elvis M., 2001, ApJ, 552, L109
- [\citeauthoryearLiu & Mirabel 2005] Liu Q.Z., Mirabel I.F., 2005, A&A, 429, 1125
- [\citeauthoryearMadau 1988] Madau P., 1988, ApJ, 327, 116
- [\citeauthoryearMasetti et al. 2003] Masetti N., Foschini L., Ho L.C., Dadina M., di Cocco G., Malaguti G., Palazzi E., 2003, A&A, 406, L27
- [\citeauthoryearMatsumoto et al. 2001] Matsumoto H., Tsuru T.G., Koyama K., Awaki H., Canizares C.R., Kawai N., Matsushita S., Kawabe R., 2001, ApJ, 547, L25
- [\citeauthoryearMignoli et al. 2004] Mignoli M. et al., 2004, A&A, 418, 827
- [\citeauthoryearMiller & Colbert 2003] Miller M.C., Colbert E., 2004, IJMP D, 13, 1 (preprint astro–ph/0308402)
- [\citeauthoryearMiller, Fabian & Miller 2004] Miller J.M., Fabian A.C., Miller M.C., 2004, ApJ, 614, L117
- [\citeauthoryearMiniutti et al. 2006] Miniutti G., Ponti G., Dadina M., Cappi M., Malaguti G., 2006, submitted to MNRAS
- [\citeauthoryearMisra & Sriram 2003] Misra R., Sriram K, 2003, ApJ, 584, 981
- [\citeauthoryearMonet et al. 2003] Monet D.G. et al., 2003, ApJ, 125, 984
- [\citeauthoryearMushotzky 2004] Mushotzky R.F., 2004, Proceedings of “Stellar–mass, Intermediate–mass, and Supermassive Black Holes”, eds. S. Mineshige and K. Makishima, 2003 Kyoto, Progr. Theor. Phys. Suppl., 155, 27
- [\citeauthoryearPeterson et al. 2005] Peterson B.M. et al., 2005, ApJ, 632, 799
- [\citeauthoryearPortegies Zwart et al. 1999] Portegies Zwart S.F., Makino J., McMillan S.L.W., Hut P., 1999, A&A, 348, L17
- [\citeauthoryearPtak et al. 2006] Ptak A., Colbert E., van der Marel R., Roye E., Heckman T., Towne B., 2006, ApJS in press (preprint astro-ph/0605561)
- [\citeauthoryearReynolds et al. 1997] Reynolds C.S., Loan A.J., Fabian A.C., Makishima K., Brandt W.N., Mizuno T., 1997, MNRAS, 286, 349
- [\citeauthoryearRuszkowski & Begelman 2003] Ruszkowski M., Begelman M.C., 2003, ApJ, 586, 384
- [\citeauthoryearSchlegel 1995] Schlegel E.M., 1995, Rep. Prog. Phys., 58, 1375
- [\citeauthoryearStrohmayer & Mushotzky 2003] Strohmayer T.E., Mushotzky R.F., 2003, ApJ, 586, L61
- [\citeauthoryearSurace, Sanders & Mazzarella 2004] Surace J.A., Sanders D.B., Mazzarella J.M., 2004, AJ, 127, 3235
- [\citeauthoryearSwartz et al. 2004] Swartz D.A., Ghosh K.K., Tennant A.F., Wu K., 2004, ApJS, 154, 519
- [\citeauthoryearWinter, Mushotzky & Reynolds 2006] Winter L.M., Mushotzky R.F., Reynolds C.S., 2006, MNRAS in press (preprint astro-ph/0512480)