Three intervening galaxy absorbers towards GRB060418: faint and dusty?
Abstract
We present an analysis of three strong, intervening Mg II absorption systems () towards the optical afterglow of gamma-ray burst (GRB) 060418. From high resolution UVES spectra we measure metal column densities and find that the highest redshift absorber exhibits a large amount of dust depletion compared with DLAs seen in QSO spectra. The intervening = 1.107 absorber is also unusual in exhibiting a clear 2175 Å bump, the first time this feature has been definitively detected in a GRB spectrum. The GRB afterglow spectrum is best fit with a two component extinction curve: an SMC extinction law at (the redshift of the host) with E() = 0.070.01 and a Galactic extinction curve at with E() = 0.080.01. We also present a moderately deep NTT -band image of the GRB060418 field and spectroscopy of four galaxies within 1 arcminute. None of these objects has a redshift that matches any of the intervening absorbers, and we conclude that the galaxies responsible for the two intervening Mg II absorbers at have luminosities .
keywords:
quasars: absorption lines – dust, extinction – galaxies: ISM – gamma-rays: bursts1 Introduction
One of the most powerful tools in the study of the interstellar medium (ISM) is the use of bright background sources on whose continua the absorption signature of intervening gas is clearly scribed. In the Milky Way, these background sources are usually stars and for extragalactic work, quasars. Combined with the large apertures of modern telescopes and the high resolving power of echelle spectrographs, absorption line spectroscopy has yielded a detailed model of the ISM and the intergalactic medium (IGM) from the present day to z=5 (see reviews by Savage & Sembach 1996; Rauch 1998; Wolfe, Gawiser & Prochaska 2005). Very recently, a new type of background source has become available – the optical afterglows of gamma-ray bursts (GRBs). In particular, the launch of the Swift satellite and its rapid provision of accurate coordinates, has seen the coming of age of prompt, optical, ground-based follow-up of GRBs. Although low resolution spectra of the optical afterglow obtained a few hours after the GRB already showed signs of intervening (as well as host galaxy) absorption (e.g. Metzger et al. 1997; Mirabal et al. 2002; Vreeswijk et al. 2004), a water-shed has been recently crossed with the first echelle spectroscopy. In a number of cases, this follow-up is obtained within an hour of the burst (e.g. Chen et al. 2005), with the fastest follow-up being a mere 10 minutes after the GRB trigger (Vreeswijk et al., in preparation). A number of exciting insights into the GRB environment are emerging from these prompt, high resolution data, including the detection of numerous fine structure transition lines (Vreeswijk et al. 2004; Chen et al. 2005; Prochaska, Chen & Bloom 2006).
With a growing database of afterglow spectra, and with the addition of high S/N, high resolution spectra in a number of cases, we are also approaching the point at which preliminary statistics of intervening absorbers can be attempted. Prochter et al. (2006) have recently reported a puzzling over-abundance of intervening high equivalent width (EW) Mg II absorbers compared with QSO sightlines. Three possible explanations are proposed: dust extinction in QSO sightlines (see also Savaglio, Fall & Fiore 2003), gravitational lensing in GRB sightlines and associated (intrinsic) absorption as responsible for some of the GRB Mg II population. Although the first of these, bias due to dust, has been shown to be small towards QSOs at absorption redshifts spanning (Ellison et al. 2001, 2004; Akerman et al. 2004; Ellison, Hall & Lira 2005; Jorgenson et al. 2006), some concerns about sample size remain and GRBs offer an interesting alternative probe.
Another attractive property of studying intervening absorbers towards GRB afterglows is that the fading source allows for a more sensitive search for absorber-galaxy counterparts than is possible towards QSOs. Although the canonical result for Mg II absorbers is that they are associated with relatively bright galaxies (e.g. Steidel, Dickinson & Persson 1994) there are issues concerning incompleteness and mis-identification (Churchill, Kacprzak & Steidel 2005). In this paper, we combine high resolution optical spectroscopy of the afterglow to determine dust and abundance properties of the intervening absorbers, with imaging of the GRB field and spectroscopy of low impact parameter galaxies.
We use the following cosmological parameters: 70 km/s/Mpc.
2 Data
2.1 UVES spectroscopy of the afterglow
Our group has been involved in commisioning a Rapid Response Mode (RRM)111http://www.eso.org/observing/p2pp/rrm.html at the Very Large Telescope (VLT) in Chile. In this paper, we discuss the intervening absorption systems of GRB 060418 which was observed with the RRM using the UVES echelle spectrograph. Details of the observations can be found in Vreeswijk et al.(in preparation). In brief, the wavelength coverage is 330 – 1000 nm, the resolution 7 km s-1 and the S/N per pixel ranges from 15 – 25. Special care was taken with the merging of the echelle orders, combining the coverage from UVES’s three CCDs and flux calibration (which included a correction for Galactic extinction with E() = 0.224, Schlegel, Finkbeiner & Davis 1998). We selected strong Mg II absorbers with rest frame EW(Mg II 2796) 1 Å; these are listed in Table 1222Note that the EWs quoted for Mg II are slightly higher than the values used for the -index calculation. In Table 1 we quote the full line EW, but the -index excludes the extreme velocities of the profile where the absorption has a significance of . In none of these Mg II absorbers do we cover the Ly line, but we can apply the Ellison (2006) -index as an indicator of whether the absorber is likely to be a DLA. In their pilot sample, Ellison (2006) found that absorbers with EW(Mg II 2796) / have a 90% probability of being DLAs. All three Mg II systems in our sample have -indices greater than 6.3.
| EW(Mg II 2796)rest | -index | N(Fe II) | N(Si II) | N(Zn II) | N(Cr II) | N(Mn II) | N(Ti II) | |
|---|---|---|---|---|---|---|---|---|
| 0.603 | 1.240.09 Å | 8.0 | 14.850.20 | … | … | … | 12.790.03 | 12.510.03 |
| 0.656 | 1.000.08 Å | 7.2 | 13.990.03 | … | … | … | 12.15 | … |
| 1.107 | 1.870.06 Å | 7.1 | 14.670.03 | 15.470.05 | 12.870.03 | 12.70 | 13.040.06 | 11.75 |
All limits are 5.
2.2 Imaging
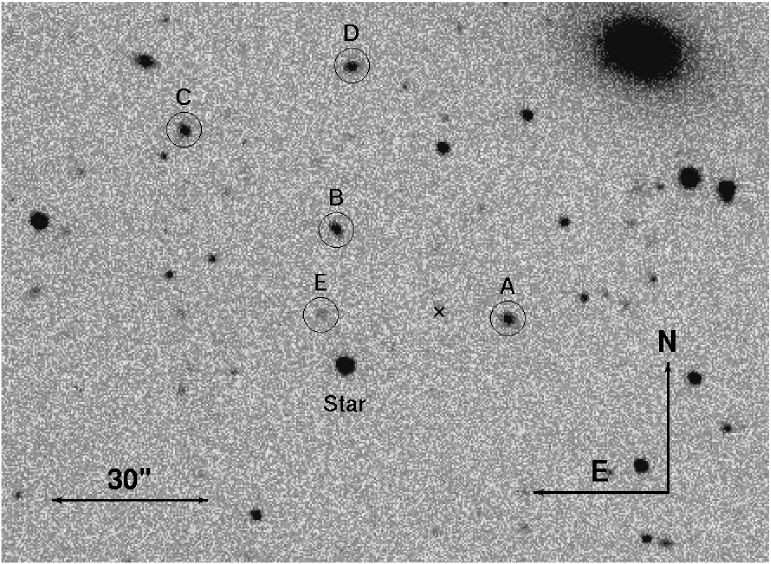
We obtained second exposures of the GRB field on 21 April 2006 using EMMI-RILD on the NTT at La Silla. The final image is shown in Figure 1 and has a 5 detection limit of within a 3 arcsecond diameter aperture. We also obtained spectra of four objects around the host galaxy (galaxies A, B, C and D), with impact parameters ranging from 13 to 60 arcseconds3331 arcsecond is 6.69 kpc (proper) at and 8.17 kpc at .. The spectra were obtained with the EMMI grism #3 yielding a FWHM resolution of 8 Å. The total integration time per object was 7200 seconds for galaxies A and B and 2400 seconds for galaxies C and D. None of the 4 objects exhibit strong emission lines but a cross-correlation with an elliptical galaxy template yields redshifts below 0.4 (see Figure 1 caption) based on stellar absorption features. None of these objects is therefore likely to be associated with the strong absorption systems listed in Table 1. The second closest object (after galaxy A) to the GRB that is detected in our image is galaxy E with an impact parameter of 23 arcseconds and an approximate R band magnitude of 22.7, too faint to follow-up with a 4-m class telescope.
3 Relative Abundances in GRB Absorbers
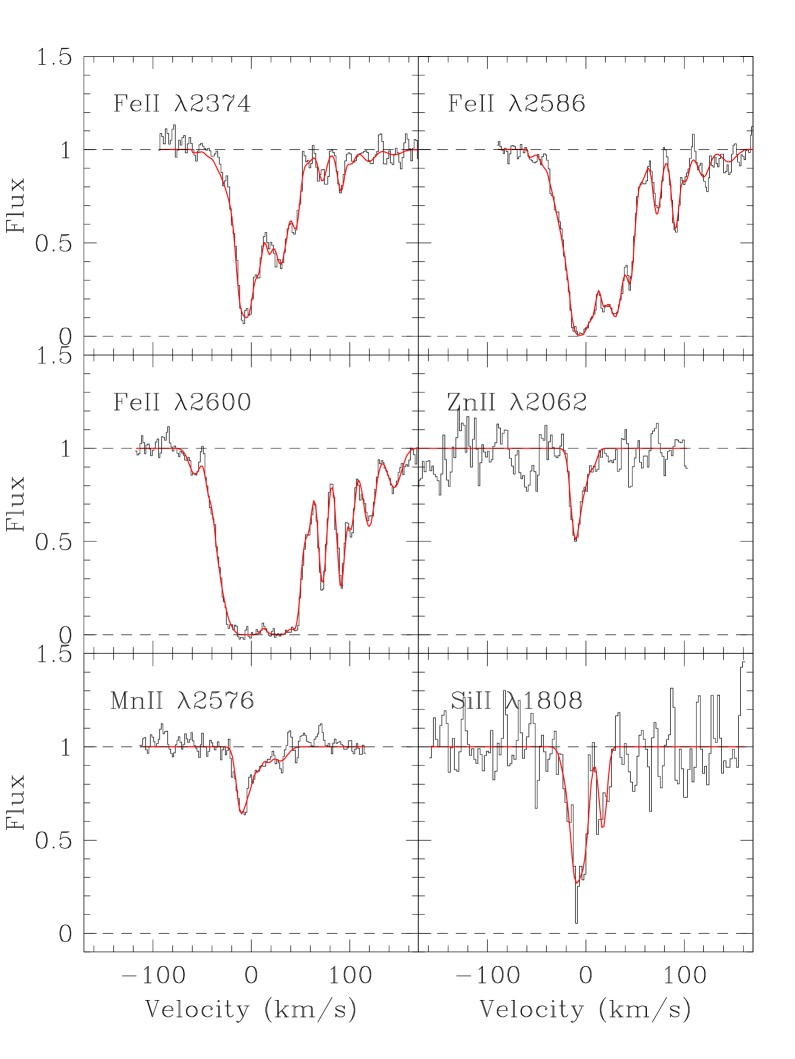
We have fitted the metal line profiles of intervening absorbers in the UVES spectrum with Voigt profiles using the software VPFIT444http://www.ast.cam.ac.uk/~rfc/vpfit.html. The column densities are listed in Table 1. Unfortunately, the two lower redshift systems () do not have coverage of many metal lines, although the higher redshift has numerous transitions included in our wavelength coverage; a selection of the absorption lines and fits is shown in Figure 2.
Abundances will be driven by the combination of underlying nucleosynthetic patterns plus the relative susceptibility to dust depletion. Disentangling these effects in order to profile the chemical enrichment (and, therefore, star formation) histories has been a long-term goal of DLA research (e.g Dessauges-Zavadsky et al. 2006). We do not know the absolute metallicity of the = 1.107 GRB060418 absorber due to the lack of N(HI) measurement. However, the large depletion factor (see below) implies that the metallicity may be at least 1/10 of solar (Ledoux et al. 2003). Indeed, this is the average metallicity of DLAs at (Meiring et al. 2006), which would require a relatively high N(HI)=21.24. Alternatively (and taking Zn as an undepleted measure of metallicity), this absorber would have solar metallicity for N(HI) = 20.24.
Even in the absence of absolute abundances, the relative abundances that can be deduced from Table 1 reveal that the = 1.107 GRB060418 absorber has a large amount of dust depletion (i.e. low gas-to-dust ratio). This is usually inferred from the ratios of iron or chromium to zinc (e.g. Pettini et al. 1997), relative to the solar value: [Fe/Zn], [Cr/Zn]. We determine [Fe/Zn]= which is lower than 95% of DLAs (e.g. Meiring et al. 2006)555Where necessary, we adopt the solar abundance scale of Lodders (2003).. We also measure [Cr/Zn] which is lower than all of the DLAs in the compilation of 40 DLAs presented by Meiring et al. (2006). Other abundance ratios show similar extreme values, also indicative of dust. For example Si and Ti are both alpha capture elements whose Galactic stellar abundances track each quite well, although with a 0.1 dex overabundance of Si (e.g. Fulbright 2000). However, the abundances of Ti and Si are very discrepant here: [Ti/Si] . Again, this is likely due to the highly refractory nature of Ti.
4 Extinction Curve
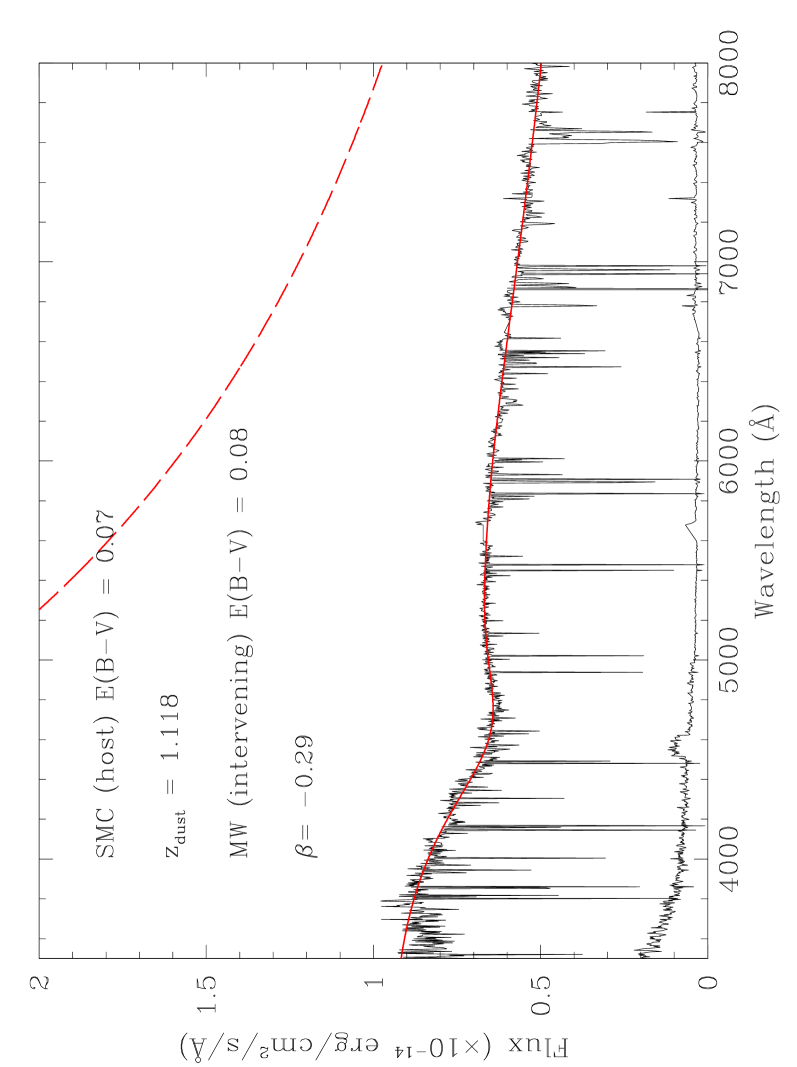
In order to quantify the amount of extinction that is associated with the absorber, we investigate fitting the flux calibrated spectrum as a power law continuum combined with extinction curves for the Milky Way, SMC and LMC as parameterised by Pei (1992). The power-law index () and E() are allowed to vary as free parameters. We included two dust components, one fixed at the redshift of the host () and one for an intervening absorber whose redshift is also a free parameter. In the absence of a 2175 Å feature, the GRB host galaxy extinction is best fit with an SMC curve. However, at we find a clear 2175 Å bump, indicative of carbonaceous grains, which requires either an LMC or MW extinction curve to achieve a good fit. We adopt the Galactic extinction curve as the best fit, based on a lower , which we show in Figure 3. The best fit parameters for intervening Galactic-type dust are (rest-frame, with 1 errors quoted) E() = 0.080.01 (AV = 0.25) at and for the SMC host extinction, E() = 0.070.01 (AV = 0.22). The underlying power-law continuum has a best-fit value of , again with 1 errors quoted based on 68% confidence limits from the minimization. The relatively low reddening at is consistent with the weak Ca II absorption, which we measure to have a rest frame equivalent width of only 0.1 Å (Wild, Hewett & Pettini 2006). The extinction in the host galaxy is consistent with the (rather wide) range of values observed in other GRB afterglow spectra (e.g. Galama & Wijers 2001; Vreeswijk et al. 2004).
Given the large Galactic reddening in the direction of the GRB, we repeat the fitting process with different values of extinction in order to assess the sensitivity of the fit to this parameter. Changing the Galactic E() by 0.1 magnitudes results in a negligible effect on the best fit E() of the absorber ( E() = 0.003), although the best fit changes by up to .
Our data provide the first definitive detection of the 2175 Å bump in a GRB spectrum and one of the highest redshift detections of the feature in the literature. The bump has only previously been observed in a handful of QSO absorbers (e.g. Wang et al. 2004; Junkarinnen et al. 2004), some gravitational lenses (e.g. Motta et al. 2002; Wucknitz et al. 2003) plus a tentative detection associated with the host galaxy of GRB991216 (Vreeswijk et al. 2006). Reddening in QSO absorbers is usually best fit by an SMC-type extinction (e.g. York D. G. et al. 2006). One interesting feature of our detection is that if the bump occurs at (the redshift of the observed metal lines), its inferred rest wavelength is 2186 Å. This is within the 17 Å scatter seen in Galactic sightlines, despite the theoretical prediction that more variation should be seen for a graphite carrier (e.g. Fitzpatrick & Massa 1986).
5 Discussion and Conclusions
We have presented the abundances of intervening absorbers towards GRB060418 and, for the first time in a GRB afterglow spectrum, detected the 2175 Å bump associated with an absorber at = 1.107. The GRB afterglow spectrum can be well fitted with a Milky Way extinction curve with and E() = 0.08, combined with SMC dust at the redshift of the host. The presence of dust in this absorber is supported by significantly sub-solar [Fe/Zn] and [Cr/Zn] ratios, which are similar to the highest dust-to-gas ratios measured in QSO DLAs.
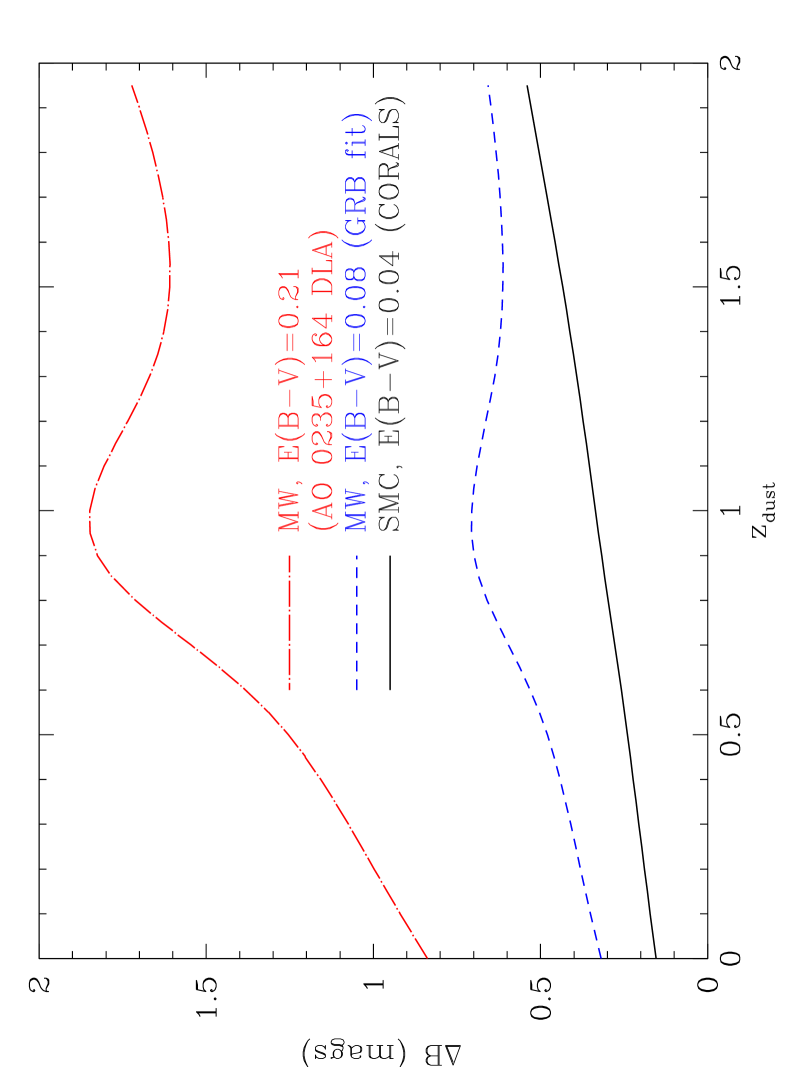
It has been previously suggested (e.g. Savaglio et al. 2003) that GRBs may reveal dustier absorbers than QSO surveys, since bright afterglows could be observed even in the presence of substantial foreground extinction. Recently, Vladilo & Péroux (2005) showed that there is a relationship between N(Zn) and AV in the Galaxy and in Vladilo et al. (2006) suggested a widespread correspondence between depletion and reddening. The N(Zn) – AV relation applied to the absorber towards GRB060418 predicts a rest-frame A. This is in good agreement with the value determined from the Galactic extinction curve fit (A). As pointed out by Vladilo & Péroux (2005), this amount of extinction is quite modest, and unlikely to produce a significant bias in absorber statistics. We demonstrate this in Figure 4 where we show the observed-frame extinction in the -band of a QSO as a function of . We calculate the change in magnitude due to extinction by taking the composite SDSS QSO spectrum (Vanden Berk et al. 2001), applying a typical -band transmission filter (we use the filter curve from SUSI2 on the NTT) and applying the extinction curves of Pei (1992). We show three curves, illustrating the case for the absorber towards GRB060418 and also the DLA towards AO 0235+164. The latter is one of the dustiest DLAs known with E() = 0.23, close to solar metallicity and even exhibiting diffuse interstellar bands (Junkarinnen et al.2004; York, B. A. et al. 2006). In addition, we show the effect of SMC extinction when E() = 0.04, the upper limit determined by Ellison et al. (2005) from colours of an optically complete QSO sample. Only the model based on the DLA towards AO 0235+164 introduces more than mags of extinction in the observed frame -band. Moreover, although the absorber towards GRB060418 has extreme abundance ratios and exhibits a 2175 Å bump, the observed extinction is comparable to that determined from complete optical QSO surveys (i.e. the results of Ellison et al. 2005). Even with dust properties as unusual as this (i.e. extreme depletions and a 2175 Å bump), we support the conclusion of Prochter et al. (2006) that there is currently no convincing evidence to suggest that dust bias is the cause of an enhanced Mg II number density (see also Frank et al. 2006).
Our image of the field around GRB 060418 reveals an absence of bright galaxies () close to the host galaxy. The faintest galaxy within 30 arcsecs of the afterglow (galaxy E on Figure 1) would have a luminosity of 0.7 at 666We used the value of at from Ilbert et al. (2005), including a correction to the Vega system and assuming that the observed frame is similar to the rest frame band at .. Although this is consistent with the luminosities of Mg II absorbers found by Steidel et al. (1994), the impact parameter is 200 kpc, so we conclude that this is unlikely to cause strong Mg II absorption in the afterglow spectrum. Our limiting magnitude of corresponds to at indicating that the absorbing galaxies at are, in this case, fainter than many of the galaxies which have been associated with QSO Mg II absorbers. For example, even when the glare of the quasar was not a contaminating factor, O’Meara, Chen & Kaplan (2006) found galaxies associated with QSO Mg II absorbers.
In summary, based on this one field, we have found one absorber that is apparently unusually depleted compared with QSO DLAs and is rare in exhibiting a Galactic extinction curve with a 2175 Å bump. This is the first definitive detection of the 2175 Å dust bump due to a galaxy in the line of sight to a GRB afterglow. We have also shown that the galaxies responsible for two further absorbers at are fainter than . Determining the extinction properties of more intervening systems in GRB sightlines is required to determine how common these properties are in galaxies seen in absorption in GRB afterglow spectra. The combination of prompt and positionally accurate Swift triggers with ground-based follow-up by teams such as our group777http://www.sc.eso.org/~grbalert/uves/home.html and GRAASP888http://graasp.ucolick.org/graasp.html is likely to provide significant progress in this direction in the near future.
Acknowledgments
Based on observations made with ESO telescopes at the La Silla and Paranal Observatories under programme ID 077.D-0661(A). We are indebted to the staff at the VLT for their help in commissioning and operating the RRM. Our thanks also to Darach Watson, Anja Andersen Hsiao-Wen Chen and Jason X. Prochaska for providing useful comments.
References
- Akerman et al. (2004) Akerman, C. J., Ellison, S. L., Pettini, M., Steidel, C. C. 2005, A&A, 440, 499
- Chen et al. (2005) Chen, H.-W., Prochaska, J. X., Bloom, J. S., Thompson, I., 2005, ApJ, 634, L25
- Churchill, Kacprzak & Steidel (2005) Churchill, W. C., Kacprzak, G., & Steidel, C. C., 2005, p24, proceedings of IAU 199: Probing Galaxies through Quasar Absorption Lines
- Dessauges-Zavadsky et al. (2006) Dessauges-Zavadsky, M., Prochaska, J. X., D’Odorico, S., Calura, F., Matteucci, F., 2006, A&A, 445, 93
- Ellison (2006) Ellison, S. L., 2000, MNRAS, 368, 335
- Ellison et al. (2004) Ellison, S. L., Churchill, C. W., Rix, S. A., Pettini, M., 2004, ApJ, 615, 118
- Ellison, Hall & Lira (2005) Ellison, S. L., Hall, P. B., Lira, P., 2005, AJ, 130, 1345
- Ellison et al. (2001) Ellison, S. L., Yan, L., Hook, I., Pettini, M., Wall, J., Shaver, P., 2001, A&A, 379, 393
- Fitzpatrick & Massa (1986) Fitzpatrick, E. L., & Massa, D., 1986, ApJ, 307, 286
- Frank et al. (2006) Frank, S., et al., 2006, ApJ, submitted, astro-ph/0605676
- Fulbright (2000) Fulbright, J. P., 2000, AJ, 120 1841
- Galama & Wijers (2001) Galama, T., & Wijers, R., 2001, ApJ, 549, L209
- Ilbert et al. (2005) Ilbert, O., et al, 2005, A&A. 439, 863
- Jorgenson et al. (2006) Jorgenson, R., Wolfe, A. M., Prochaska, J. X., Lu, L., Howk, J. C., Cooke, J., Gawiser, E., Gelino, D., 2006, ApJ, in press.
- Junkkarinen et al. (2004) Junkkarinen, V. T., Cohen, R. D., Beaver, E. A., Burbidge, E. M., Lyons, R. W., Madejski, G., 2004, ApJ, 614, 658
- Ledoux et al. (2003) Ledoux, C., Petitjean, P., Srianand, R., 2003, MNRAS, 346, 209
- Lodders (2003) Lodders, K., 2003, ApJ, 591, 1220
- Meiring et al. (2006) Meiring, J., Kulkarni, V. P., Khare, P., Bechtold, J., York, D. G., Cui, J., Lauroesch, J. T., Crotts, A. P. S.Nakamura, O., 2006, MNRAS, accepted
- Metzger et al. (1997) Metzger, M. R., et al., 1997, Nature, 387, 879
- Mirabal et al. (2002) Mirabal, N., et al., 2002, ApJ, 578, 818
- Motta et al. (2002) Motta, V., Mediavilla, E., Munoz, J. A., Falco, E., Kochanek, C. S., Arribas, S., Garcia-Lorenzo, B., Oscoz, A., Serra-Ricart, M., 2002, ApJ, 574, 719
- O’Meara, Chen & Kaplan (2006) O’Meara, J. M., Chen, H.-W., & Kaplan, D. L., 2006, ApJ, L642, 9O
- Pei (1992) Pei, Y., 1992, ApJ, 395, 130
- Pettini et al (1997) Pettini, M., Smith, L.J., King, D.L., & Hunstead, R.W. 1997, ApJ, 486, 665
- Prochaska, Chen & Bloom (2006) Prochaska, J. X., Chen, H.-W., Bloom, J. S., 2006, ApJ, accepted
- Prochter et al. (2006) Prochter, G. E., Prochaska, J. X., Chen, H.-W., Bloom, J. S., Dessauges-Zavadsky, M., Foley, R. J., Pettini, M., Dupree, A. K., Guhathakurta, P., ApJ, submitted
- Rauch (1998) Rauch, M. 1998, ARA&A, 36, 267
- Savaglio, Fall & Fiore (2003) Savaglio, S., Fall S. M., & Fiore, F., 2003, ApJ, 585, 638
- Savage and Sembach (1996) Savage, B. D. & Sembach, K. R., 1996, ARA&A, 34, 279
- Schlegel, Finkbeiner, & Davis (1998) Schlegel, D.J., Finkbeiner, D.P., & Davis, M. 1998 ApJ, 500, 525
- Steidel, Dickinson & Persson (1994) Steidel, C. C., Dickinson, M., & Persson, E., ApJ, 437, L35
- vanden Berk et al. (2001) Vanden Berk, D. E., et al. 2001, ApJ, 122, 549
- Vladilo et al. (2006) Vladilo, G., Centurion, M., Levshakov, S., Peroux, C., Khare, P., Kulkarni, V., York, D. G., 2006, A&A, accepted
- Vladilo & Peroux (2005) Vladilo, G., & Péroux, C., 2005, A&A, 444, 461
- Vreeswijk et al (2004) Vreeswijk, P., et al., 2004, A&A, 419, 927
- Vreeswijk et al (2006) Vreeswijk, P., et al., 2006, A&A, 447, 145
- Wang et al. (2004) Wang, J., Hall, P. B., Ge, J., Li, A., Schneider, D., 2004, ApJ, 609, 589
- Wild, Hewett, & Pettini (2006) Wild, V., Hewett, P. C., & Pettini, M., 2005, MNRAS, 367, 211
- Wolfe, Gawiser & Prochaska (2005) Wolfe, A., Gawiser, E., & Prochaska, J. X., 2005, ARA&A, 43, 861
- Wucknitz et al. (2003) Wucknitz, O., Wisotzki, L., Lopez, S., Gregg, M. D., 2003, A&A, 405, 445
- York et al. (2006) York, B. A., Ellison, S. L., Lawton, B., Churchill, C. W. C., Snow, T., Johnson, R., Ryan, S., 2006, ApJ Letters, accepted
- York et al. (2006) York, D. G., et al. 2006, MNRAS, 367, 945