The evolution of galaxy groups and of galaxies therein
Abstract
Properties of groups of galaxies depend sensitively on the algorithm for group selection, and even the most recent catalogs of groups built from redshift-space selection should suffer from projections and inclusion of infalling galaxies. The cosmo-dynamical evolution of groups from initial Hubble expansion to collapse and virialization leads to a fundamental track in virial-theorem estimated vs crossing time. The increased rates of mergers, both direct and after orbital decay by dynamical friction, in (low velocity dispersion) groups relative to clusters, explain the higher fraction of elliptical galaxies at given local number density in X-ray selected groups, relative to clusters, even when the hierarchical evolution of groups is considered. Galaxies falling into groups and clusters should later travel outwards to typically 2 virial radii, which is close to but somewhat less than the outermost radius where galaxy star formation efficiencies are observed to be enhanced relative to field galaxies of same morphological type. An ongoing analysis of the internal kinematics of X-ray selected groups suggests that the radial profiles of line of sight velocity dispersion are consistent with isotropic NFW distributions for the total mass density, with higher concentrations in massive groups than CDM predictions and lower concentrations in low mass groups. The critical mass, at is consistent with possible breaks in the X-ray luminosity-temperature and Fundamental Plane relations. The internal kinematics of groups indicate that the relation of groups should agree with that extrapolated from clusters with no break at the group scale. The analyses of observed velocity dispersion profiles and of the fundamental track both suggest that low velocity dispersion groups (compact and loose, X-ray emitting or undetected) are quite contaminated by chance projections.
1 Introduction
The attractive nature of gravity tends to assemble galaxies together in groups. With typical grouping algorithms, roughly half of all galaxies reside in groups. A smaller fraction of galaxies live in virialized groups of at least 4 bright galaxies, and a considerably smaller fraction live in the more massive virialized clusters.
Given typical scaling relations, defining the virial radius of groups where the mean density is 200 times the critical density of the Universe, groups of galaxies have ranges of mass within the virial radius, virial and turnaround radii (all assuming ), velocity dispersion and temperature shown in Table 1.
| () | (Mpc) | (Mpc) | () | (keV) | |
|---|---|---|---|---|---|
| Minimum | 12.5 | 0.3 | 1.1 | 140 | 0.2 |
| Maximum | 14.0 | 1.0 | 3.4 | 450 | 2 |
More massive objects can be called clusters. Of course, the limiting mass between groups and clusters is arbitrary and historical. The more massive groups have properties (e.g. mamon:OP04 and Fundamental Plane mamon:SMCB93 relations) expected from the extrapolation of clusters, while the less massive groups do not appear to follow such extrapolations, with the separation between massive cluster-like and low mass groups occurring at .
Groups of galaxies thus provide an important laboratory to understand how the density of the environment affects the properties of galaxies. In turn, the modulation with environment of galaxy properties serves as an important constraint for (semi-)analytical models of galaxy formation.
This review focusses on several dynamical and cosmological aspects of the evolution of groups and of their constituent galaxies.
2 The evolution of groups
2.1 Group expansion, collapse and virialization
Groups are difficult to define from galaxy catalogs, because the selection of nearby galaxies in redshift space causes frequent interlopers and spurious groups mamon:MFW93 ; mamon:DKCW99 (also Eke, at this meeting). This problem of interlopers and spurious groups is probably worsened by the use of the Friends of Friends grouping algorithm, which tends to produce filamentary structures when there are less than a dozen objects (it would be worthwhile to compare the efficiency of the Friends-of-Friends algorithm with other grouping methods, based upon cosmological simulations).
While virialized structures in a CDM Universe with mamon:Spergel+06 have a mean density mamon:KS96 times the mean density of the Universe, i.e. 94 times the critical density of the Universe, groups have been selected in the past with Friends-of-Friends linking lengths corresponding to an overdensity of only 20 mamon:GH83 or 80 mamon:RGH89 ; mamon:MZ02 ; mamon:MZ05 . In comparison, the mean density at the turnaround radius in a CDM Universe with is 14 times that of the Universe (Mamon, in preparation). Overdensities of 80 relative to the mean Universe density thus roughly correspond to the geometric mean between the virial and turnaround radii, and thus, in most catalogs, group galaxies are selected out to the region of rapid infall, and the infalling galaxies bias the group definition, mass estimate and properties. Given very large galaxy samples, such as SDSS, group selection should be done at .
In the extreme, all galaxies of a selected group could be in the infalling region. The departure of such a group from virialization has an important effect on the derived virial mass of the system mamon:Mamon93_Aussois_Dyn ; mamon:Mamon94_Moriond ; mamon:Mamon95_Chalonge . Indeed, while it is difficult to compare groups of different scale and cosmo-dynamical state (expansion, collapse, virialization), I had realized that the dimensionless crossing time, , and the dimensionless mass bias, that is mass from the virial theorem divided by true mass, , provide a plane in which the evolution of isolated systems in an expanding Universe follow a fundamental track (FT), which is independent of their mass mamon:Mamon93_Aussois_Dyn ; mamon:Mamon94_Moriond ; mamon:Mamon95_Chalonge . This track is estimated for the case of a binary system of two extended subgroups of very different masses, with no specific angular momentum. The velocity dispersion of a system can be expressed as . The FT, shown in the left panel of Figure 1, was derived assuming that the velocity dispersion of the expanding/collapsing group is dominated by the term, with the proper velocity dispersion dominating after the full collapse.


The left panel of Figure 1 shows that the true mass is usually severely underestimated by application of the virial theorem. During the early stages of collapse, this occurs because the velocity dispersion of the system is still low (as is small). Near full collapse, the galaxies decouple from their dark matter halos: while the virial theorem measures the mass at the radius of the group where lie the galaxies, there is dark matter beyond that radius. The FT diagram (left panel of Fig. 1) also indicates that while the crossing time is to first approximation a good estimator of the cosmo-dynamical evolution of a group, it suffers from degeneracies between the expansion and early collapse phases, and also between the full collapse and rebound phases. These degeneracies can be lifted in part by combining crossing times with the virial to true mass ratio. Note that the precise evolution of a system after full collapse is not well known and probably varies from group to group, depending on the specific angular momentum of the binary.
The right panel of Figure 1 shows how observed groups relate to this FT. Since we do not know the true masses of groups, we assume, as a first order approximation that the optical luminosity of a group is proportional to its true mass. The true mass-to-light ratio is a free parameter and is fitted with the highest multiplicity groups, yielding (where ), while the median is 4 times smaller (because it is dominated by low multiplicity groups near turnaround).
Interestingly, most groups lie near the fundamental track. The large scatter for the low multiplicity groups is partly due to larger errors in estimating the plotted quantities given small numbers of galaxies, but the errors are not sufficient in explaining the large number of low-multiplicity groups well below the FT, unless these groups, either have lower (because of an intrinsic increase with group luminosity, or because the galaxies in these particular groups are undergoing bursts of star formation), or are caused by chance alignments of galaxies along the line-of-sight (for which the group radius is underestimated, while the velocity dispersion is not).

Figure 2 displays the positions of Hickson’s compact groups mamon:Hickson82 ; mamon:HMdOHP92 relative to the FT. The high velocity dispersion compact groups agree with the predicted FT for , while the low velocity dispersion compact groups do not. The strong offset of the low compact groups relative to the FT can be explained either by bursts of star formation (making a poor estimator of the true mass) or by chance alignments of galaxies along the line of sight within large collapsing groups mamon:Mamon93_Aussois_Dyn (for which the compact group radius is a severe underestimate of the parent group radius).
3 The evolution of galaxies in groups
3.1 The many physical processes at work
Dense environments are expected to alter the properties of galaxies. A variety of physical mechanisms are at work in groups and clusters: basically gravitational and hydrodynamical. We highlight below those processes that alter the morphologies, gas content (and briefly star formation efficiency) of galaxies in groups.
Major galaxy mergers drastically alter the galaxy morphologies, destroying the disks of spirals galaxies and producing a merger remnant that resembles an elliptical galaxy, not only in its surface brightness profile mamon:Barnes88 , but in the details of its internal kinematics mamon:Dekel+05 . Minor mergers are expected to build up the bulges of spirals at the expense of their disks mamon:BJC05 . But repeated minor mergers can have the effect of a single major merger mamon:BJC05 . Similarly, repeated minor encounters (merging or not) will “harass” a galaxy enough to substantially transform it mamon:Moore+96 . Rapid non-merging encounters also play an important role: the tidal force at closest approach (pericenter) produces a quadrupolar perturbation on the shape of the galaxy, and in extreme cases does the same on its giant molecular clouds. The latter tidal force thus accelerates star formation, while the former can help gas fall into the galaxy core, thus driving an episode of active galactic nucleus (AGN) mamon:BVVS86 . In addition to these collisional tides, the galaxy is affected by the mean tidal field of its cluster mamon:Merritt84 or dense group mamon:Mamon87 , where this global tide is more efficient at altering galaxies than the tides from galaxy encounters mamon:Mamon87 . The mean tidal field of the group or cluster does not simply limit the galaxy extent and mass, but by pumping energy into the reservoir of outer gas, it suppresses gas infall onto galaxy disks, thus severely reducing long-term star formation mamon:LTC80 , a process often called disk strangulation.
Gas can be removed from its parent galaxy through ram pressure (, where is the gas density of the environment). This idea was first applied to colliding spiral galaxies mamon:SB51 , and later it became clear that the hot intracluster gas provides an important ram pressure mamon:GG72 . After losing its gas, a spiral galaxy would see its disk fade and resemble a lenticular (S0) galaxy. It is not yet clear that S0s are indeed produced by ram pressure gas stripping, or are simply systems with large bulge to disk ratio. Ram pressure stripping produces the correct local and global trends in clusters mamon:SS92 , but cannot explain the presence of S0s in groups, where the lower velocities are unable to produce sufficiently high ram pressure mamon:Dressler86 ; mamon:HP03_mdr . On the other hand, if the large bulges of S0s are built up by minor mergers, the fraction of S0s is clusters are found to be lower in semi-analytical models of galaxy formation mamon:SWTK01 than observed. However, the inclusion of ram pressure stripping (in very simplistic schemes) does not increase enough the S0 fraction in semi-analytical models mamon:ON03 ; mamon:Lanzoni+05 .
The morphological segregation of galaxies in groups and clusters obviously leads to color segregation, where the redder galaxies lie in the dense central regions, but interestingly, the galaxy colors are redder for given morphological type in clusters than in the field mamon:Balogh+98 , which can be simply explained by the tidal dissipation of the gas reservoirs of spirals mamon:BNM00 .
Most of the processes listed here work best in dense environments. On the contrary, for very loose groups such as the Local Group, which are still in the collapse phase, major interactions have not yet altered the more massive galaxies. Only the low mass satellites of massive galaxies are affected by the presence of their more massive companion.
3.2 How frequently do group galaxies merge?
The merger rate per unit volume of equal mass galaxies in a group is obtained by integrating over a merger cross-section:
| (1) |
where is the relative-velocity dependent merger cross-section and is the distribution of relative velocities. For a linear mamon:RN79 , one finds mamon:Mamon92
| (2) |
where and are the half-mass radius and (1D) velocity dispersion of the galaxies, is the velocity dispersion of the environment, and with now old cross-sections scalings mamon:RN79 ; mamon:AF80 one has . With mamon:Spitzer69 , one then gets mamon:Mamon92
| (3) |
where . The merger rate has also been derived directly mamon:MH97 from fairly realistic -body simulations of the mergers of equal mass Hernquist mamon:Hernquist90 models, and this rate is essentially identical to my analytical prediction mamon:Mamon92 , as shown in a previous review of mine mamon:Mamon00_IAP , despite my neglect of gravitational focussing and my use of merger cross-sections based upon very primitive -body simulations mamon:RN79 ; mamon:AF80 .
In my previous review mamon:Mamon00_IAP , I’ve adapted equation (2) to estimate the merger rates for unequal mass galaxies, and integrating over the mass function of field galaxies I derived a merger rate as a function of galaxy mass:
| (4) |
where and are the break in the galaxy mass function and a fiducial number density, while is a dimensionless function of mass which, for major mergers, increases with mass, reaches a maximum near and decreases sharply for . The normalization is such that galaxies in typical groups should suffer a few major mergers per Hubble time mamon:Mamon00_IAP . I also estimated merger rates as a function of position in the group or cluster and found that the direct merger rate outside of the the central galaxy is maximum at mamon:Mamon00_IAP . An increasing number of observational constraints on the galaxy merger rate and its evolution are now arising (see Conselice in these proceedings and mamon:Conselice06 ) and need to be compared with the predictions given here.
3.3 Do we understand the morphology-density relation in groups and clusters?
The predictions above on the rates of direct mergers versus environment can be compared to the global morphological mix and its local variations (the morphology-density relation, hereafter MDR) observed in groups and clusters. While an early analysis mamon:PG84 concludes to a universal MDR as a function of local galaxy density, a closer look reveals various problems with groups of galaxies: Hickson’s mamon:Hickson82 compact groups, assumed as dense in 3D as they appear in 2D, have much higher spiral fractions than expected from the universal MDR mamon:Mamon86 . Conversely, these compact groups are spiral-poor relative to other systems of the same velocity dispersion mamon:HR88 , but with a very strong inverse correlation of spiral fraction and velocity dispersion mamon:HKH88 , also seen in general SDSS groups mamon:WvdBYM06 .
Recently, Helsdon & Ponman mamon:HP03_mdr compared the local morphological mix of their sample of X-ray emitting groups to that of clusters mamon:Dressler+97 . After statistical correction for projections, X-ray emitting groups appear to be spiral-poor relative to clusters of the same local 3D density, by an amount just as expected from the scaling of equations (2) and (3) mamon:HP03_mdr . In other words, the true groups, as selected by their X-ray emission, have less spirals than clusters because their lower velocity dispersions lead to slow enough encounters to lead to major mergers that transform spirals into ellipticals.
This simple understanding of the MDR of groups vs clusters has 3 caveats:
-
1.
Major mergers are probably more often the result of orbital decay by dynamical friction than of direct slow collisions. The orbital decay time scales as the dynamical friction (df) time mamon:Mamon95_Chalonge , which scales as
(5) Comparing equations (4) and (5), one finds that the rate of direct to frictional mergers scales as , where is the mass fraction of the group/cluster in galaxies. This small (logarithmic) dependence on the mass of the environment means that to first order, the ratio of frictional to direct mergers is independent of the environment, with direct mergers slightly more (less) important in groups (clusters).
-
2.
When two groups or clusters merge, violent relaxation might cause their galaxy populations to mix sufficiently to erase their MDRs. However, -body simulations indicate that when two systems merge, there is a strong correlation between initial and final binding energies mamon:Barnes92 , so that the most bound galaxies in the initial groups or clusters, mostly ellipticals, will end up as the most bound galaxies, thus preserving the MDR.
-
3.
Our analysis pertains to instantaneous merger rates. Since we live in a hierarchical Universe where the rich clusters today were built of smaller groups, we still need to check that the ratio of instantaneous merger rates in groups and clusters is equal to the ratio of the time-averaged merger rates in groups and clusters. But since the merger rates scales as , hence as one over the mass of the environment, the ratio at any time between the merger rates of the main progenitors of present-day groups and clusters will scale as . Since massive clusters are rare objects, they must form recently, because otherwise they would be even more extreme objects in the past. However, this effect is not too severe: from cosmological -body simulations and analytical predictions of the mass assembly history of cosmic systems mamon:vandenBosch02 , I infer that the elapsed time for the doubling in mass of (the main progenitors of) present-day groups () is only 1/3 greater than that of present day clusters (). Therefore, the average mass ratio of the group to cluster progenitors decreases only slightly with time, so that to first order the time averaged ratio of merger rates of group and cluster progenitors is close to the ratio of present-day merger rates.
Therefore, none of the caveats is serious, and it does appears that the increased rate of galaxy mergers indeed explains the larger local fractions of ellipticals in X-ray selected groups relative to clusters.
Since compact groups in general are spiral-rich mamon:Mamon86 , while X-ray selected groups are spiral-poor mamon:HP03_mdr , then the compact groups that are not in the GEMS sample must be nearly devoid of early-type galaxies, i.e. the spiral fractions of these groups should be as high or higher than in the average field. The non-X-ray emitting compact groups are typically low velocity dispersion groups, which as we saw, do not fit the FT, so it is tempting to conclude that low velocity dispersion compact groups are mostly caused by chance projections.
3.4 How far out should galaxies feel the group environment?
The decreased star formation rate for group/cluster galaxies of given morphological type is visible out to mamon:Balogh+98 , i.e. . Regardless of whether the mass assembly of groups and clusters is viewed in a monolithic spherical infall context or in a hierarchical merging one, the effects of the group/cluster on the galaxies should thus be seen out to the maximum rebound or backsplash radius. If this radius is assimilated to the radius of mixing in the spherical infall model, one finds mamon:MSSS04 . If one assumes values for the ratio of the (lagrangian) rebound to turnaround radius (e.g. ), and for the corresponding ratio of rebound to turnaround times (e.g. ), one can solve in the context of a flat Universe with a cosmological constant for the rebound radius, and we find with a maximum of 2.5 for the most favorable case (rebound radius equals turnaround radius and rebound time equals twice the turnaround time) mamon:MSSS04 . Deriving reasonable ratios from particle trajectories of an CDM simulation mamon:FM01 , we obtain ranging from 0.55 to 1.25 mamon:MSSS04 . Finally we considered the final output () of a GALICS galaxy formation simulation mamon:Hatton+03 built on top of a dark matter only CDM cosmological simulation, where galaxies penetrating groups and clusters are selected by empty halos (a feature of GALICS is that when halos merge, galaxies remain with the more massive halo). We then found that galaxies (empty halos) travel out to mamon:MSSS04 . These numbers were confirmed through an analysis of the particle trajectories in CDM halos, which shows that particles that penetrate deep into their halo travel out to mamon:GKG05 . These maximum rebound radii are thus somewhat larger (by 30%) than the observed maximum radius for decreased star formation, but consistent this value.
4 The internal kinematics of groups
Clusters of galaxies are beginning to reveal their mass profiles, through analyses of their internal kinematics, X-ray gas or lensing properties. Kinematical analyses are often based upon the Jeans equation of hydrostatic equilibrium, relating the divergence of the anisotropic dynamical pressure tensor with the tracer density times the gradient of the gravitational potential. In spherical symmetry this becomes
| (6) |
where , and are the radial profiles of tracer number density, total mass, and velocity anisotropy (where , and corresponds to radial, isotropic and circular orbits, respectively). Since the data are seen in projection, one has to couple the Jeans equation with the anisotropic projection equation mamon:BM82
| (7) |
where is the surface number density as a function of projected radius , and is the line of sight velocity dispersion profile (hereafter VDP).
For example, assuming isotropic to moderately radial orbits, the mass profile of clusters is consistent with being proportional to the galaxy number density profile mamon:CYE97 , which itself was consistent with the cuspy NFW mamon:NFW96 profile. Recently, the mass-anisotropy degeneracy, inherent in the Jeans equation, was recently (partially) lifted: the early type galaxies in clusters follow isotropic orbits mamon:LM03 ; mamon:KBM04 , galaxy velocities are isotropic in groups and somewhat radial in clusters mamon:MG04 .
Andrea Biviano and I are currently performing a similar analysis for groups of galaxies, as we wish to check if various types of groups (hot vs. cold, etc.) display similar mass profiles and concentrations. For this, we use the GEMS group sample mamon:OP04 , which considers all groups for which there have been X-ray pointings. In this review, we focus on the groups with diffuse X-ray emission distinct from diffuse emission around the central bright elliptical.
We selected group member galaxies with NED (which at the time included the SDSS-DR4 and the 6dFGS-DR2), searching out to twice (to be conservative) a 1st-order estimate of their virial radius, (where the mean density is 200 times the critical density of the Universe) using , as appropriate for pure NFW models with and (when , we used to be conservative) and out to . We then computed the velocity dispersion and iterated with a depth.
4.1 Which is the best estimator of virial radius?
Since groups have few galaxies, we need to stack them, normalizing the radii to their virial radius, (as first done by mamon:Carlberg+01_groups ), and similarly stack their velocities to , the circular velocity at . We have considered several estimators of the virial radius: 1) the velocity dispersion, assuming an isotropic pure NFW model with a CDM concentration parameter, -NFW; 2) the -band total galaxy luminosity, taken from the 2MASS survey, corrected for incompleteness, using an relation mamon:LMS03 ; 3) the X-ray emission-weighted temperature, using relations from several authors mamon:EMN96 ; mamon:Sanderson+03 ; mamon:APP05 . For each of our estimators, we performed the interloper removal, first group per group, then on the stacked pseudo-group. We also removed a few groups contaminated by nearby groups or clusters and thse with members. In the stacking, we have weighted the galaxies inversely proportional to the number of galaxies in the group out to the virial radius. This weighting gives equal weight to each group in the stacked pseudo-group.
Figure 3 compares the measured VDPs with the expectation from the isotropic Jeans equation mamon:PS97 :
| (8) |
We are also investigating other simple anisotropy profiles for which the term in the square root is replaced by other kernels given by mamon:ML05b , and alternatively, we are directly estimating the mass profile for given anisotropy profiles using the recently discovered mass inversion technique mamon:MB06 .
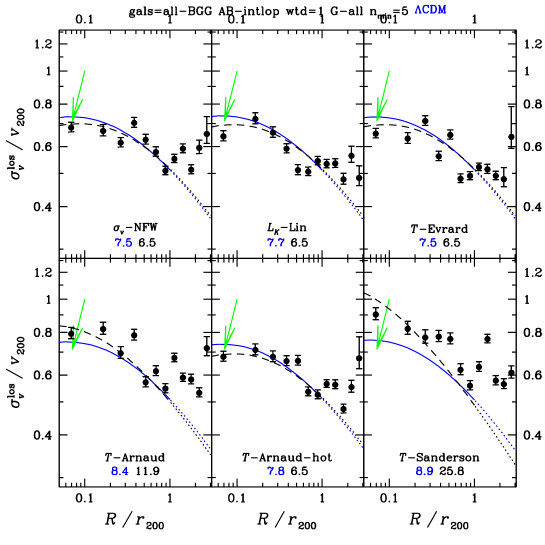
The Sanderson et al. mamon:Sanderson+03 relation, which predicts lower mass groups than when extrapolated from cluster relations, appears inconsistent with isotropic NFW models, as the virial radius and velocity dispersion appear to be overestimated by a factor 1.3, i.e. the mass is a factor of 2 higher than predicted from their relation. A maximum likelihood analysis at suggests that the Sanderson et al. relation can only be reconciled with a highly concentrated () and tangentially anisotropic () system. On the other hand, the virial radii built upon relations derived for hot clusters mamon:APP05 or cosmological simulations mamon:EMN96 produce velocity dispersion profiles that are consistent with isotropic NFW models. Therefore, the relation of groups of galaxies appears to lie in the extrapolation of that of clusters, with no break at .
4.2 Constraints on group mass profiles
We have subdivided the G groups into subclasses according to their velocity dispersion, , temperature, , ratio of galaxy orbital to gas thermal energies , X-ray luminosity, and -band luminosity, . Figure 4 shows plots analogous to those in Figure 3, but when the sample is subdivided into dynamically hot () and cold () groups.
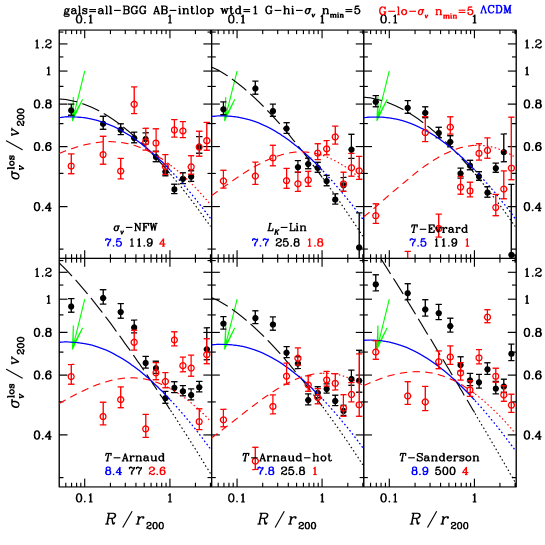
Regardless of the method used to estimate , the dynamically hot (cold) groups are always more (less) concentrated in total mass than the CDM prediction for isotropic orbits. While clusters of galaxies display mass concentrations that are consistent with the CDM predictions (mamon:APP05 using X-rays and mamon:BG03 ; mamon:LM03 ; mamon:KBM04 ; mamon:Lokas+06 using internal kinematics), the richer (high velocity dispersion) groups appear to be more concentrated than CDM predictions, while the poorer (low velocity dispersion) groups appear to be less concentrated than CDM predictions. The high concentrations of the hot groups are caused in part by fitting the total mass density profile, while the more concentrated baryonic (Sérsic) component gives the illusion of high total mass concentrations mamon:ML05a . Note that the galaxy distribution is even more concentrated, leading to rising mass over number ratio, consistent with what was derived on an optically selected sample mamon:Carlberg+01_groups . Alternatively, hot (cold) groups could have CDM mass profiles, with radial (tangential) galaxy orbits. Finally, the strong scatter in the VDPs of the dynamically cold groups suggests that dynamically cold groups are contaminated by unreal groups.
There are also strong differences between groups with high and low , and X-ray luminosity, but smaller differences when subdividing groups into classes of high and low X-ray temperature or -band luminosity.
4.3 The fundamental track of groups selected to the virial radius
Figure 5 shows the FT of GEMS groups, which were selected out to the virial radius, here defined with the luminosity.
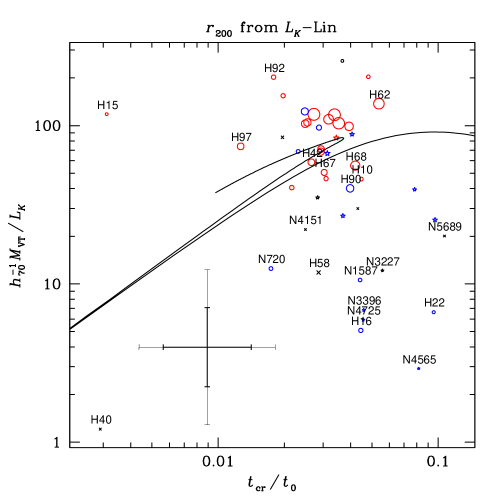
The rich groups cluster near the position expected for virialized systems (the kink of the FT at ). Interestingly, the groups that lie off the FT (at lower ) have typically low , but also longer crossing times. This suggests that these low velocity dispersion groups are not simply low mass-to-light ratio systems, but that there is an intrinsic property that takes them off the FT. The simplest explanation is that low velocity dispersion groups (compact or not) are chance alignments of galaxies along the line of sight, i.e. prolate groups in real space.
5 Concluding thoughts
Our understanding of the evolution of groups and of galaxies therein is making rapid progress thanks to the advent of 1) large galaxy surveys such as the 2dFGRS and SDSS, 2) multi-wavelength observations of groups, and 3) high resolution cosmological body simulations. Many of the results presented here need to be confirmed with these large data sets and simulation outputs.
I am grateful to my collaborator, Andrea Biviano, for allowing me to mention our work in progress. I also thank Ivo Saviane, Valentin Ivanov and Jordanka Borissova for organizing a very exciting and high-level meeting and for being extremely patient with the manuscript.
References
- (1) J.P.F. Osmond, T.J. Ponman: MNRAS 350, 1511 (2004)
- (2) R. Schaeffer, S. Maurogordato, A. Cappi, F. Bernardeau: MNRAS 263, L21 (1993)
- (3) B. Moore, C.S. Frenk, S.D.M. White: MNRAS 261, 827 (1993)
- (4) A. Diaferio, G. Kauffmann, J.M. Colberg, S.D.M. White: MNRAS 307, 537 (1999 )
- (5) D.N. Spergel, R. Bean, O. Doré, et al.: ApJ submitted, arXiv:astro-ph/0603449 (2006)
- (6) T. Kitayama, Y. Suto: ApJ 469, 480 (1996)
- (7) M.J. Geller, J.P. Huchra: ApJS 52, 61 (1983)
- (8) M. Ramella, M.J. Geller, J.P. Huchra: ApJ 344, 57 (1989)
- (9) M. Merchán, A. Zandivarez: MNRAS 335, 216 (2002)
- (10) M.E. Merchán, A. Zandivarez: ApJ 630, 759 (2005)
- (11) G.A. Mamon: Dynamical theory of groups and clusters of galaxies. In: Gravitational Dynamics and the N-Body Problem, ed by F. Combes, E. Athanassoula (Obs. de Paris, Paris 1993) pp 188–203, arXiv:astro-ph/9308032
- (12) G.A. Mamon: The galaxy group/cosmology connections. In: Moriond Astrophysics Mtg number 14, Clusters of Galaxies, ed by F. Durret, A. Mazure, S.D.M. White, J. Trânh Thanh Vân (Frontières, Gif-sur-Yvette 1994) pp 291–296, arXiv:astro-ph/9406043
- (13) G.A. Mamon: The dynamics of groups and clusters of galaxies and links to cosmology. In: 3rd Paris cosmology colloq, ed by H. de Vega, N. Sánchez (World Scientific, Singapore 1995) pp 95–119, arXiv:astro-ph/9511101
- (14) P. Fouqué, E. Gourgoulhon, P. Chamaraux, G. Paturel: A&AS 93, 211 (1992)
- (15) E. Gourgoulhon, P. Chamaraux, P. Fouqué: A&A 255, 69 (1992)
- (16) P. Hickson: ApJ 255, 382 (1982)
- (17) P. Hickson, C. Mendes de Oliveira, J.P. Huchra, G.G. Palumbo: ApJ 399, 353 (1992)
- (18) J.E. Barnes: ApJ 331, 699 (1988)
- (19) A. Dekel, F. Stoehr, G.A. Mamon, T.J. Cox, G.S. Novak, J.R. Primack: Nature 437, 707 (2005)
- (20) F. Bournaud, C.J. Jog, F. Combes: A&A 437, 69 (2005)
- (21) B. Moore, N. Katz, G. Lake, A. Dressler, A. Oemler, Jr.: Nature 379, 613 (1996)
- (22) G.G. Byrd, M.J. Valtonen, L. Valtaoja, B. Sundelius: A&A 166, 75 (1986)
- (23) D. Merritt: ApJ 276, 26 (1984)
- (24) G.A. Mamon: ApJ 321, 622 (1987)
- (25) R.B. Larson, B.M. Tinsley, C.N. Caldwell: ApJ 237, 692 (1980)
- (26) L.J. Spitzer, W. Baade: ApJ 113, 413 (1951)
- (27) J.E. Gunn, J.R. Gott: ApJ 176, 1 (1972)
- (28) J.M. Solanes, E. Salvador-Solé: ApJ 395, 91 (1992)
- (29) A. Dressler: ApJ 301, 35 (1986)
- (30) S.F. Helsdon, T.J. Ponman: MNRAS 339, L29 (2003)
- (31) V. Springel, S.D.M. White, G. Tormen, G. Kauffmann: MNRAS 328, 726 (2001)
- (32) T. Okamoto, M. Nagashima: ApJ 587, 500 (2003)
- (33) B. Lanzoni, B. Guiderdoni, G.A. Mamon, J. Devriendt, S. Hatton: MNRAS 361, 369 (2005)
- (34) M.L. Balogh, D. Schade, S.L. Morris, H.K.C. Yee, R.G. Carlberg, E. Ellingson: ApJL 504, L75 (1998)
- (35) M.L. Balogh, J.F. Navarro, S.L. Morris: ApJ 540, 113 (2000)
- (36) N. Roos, C.A. Norman: A&A 76, 75 (1979)
- (37) G.A. Mamon: ApJL 401, L3 (1992)
- (38) S.J. Aarseth, S.M. Fall: ApJ 236, 43 (1980)
- (39) L. Spitzer: ApJL 158, L139 (1969)
- (40) J. Makino, P. Hut: ApJ 481, 83 (1997)
- (41) L. Hernquist: ApJ 356, 359 (1990)
- (42) G.A. Mamon: Theory of galaxy dynamics in clusters and groups. In: 15th IAP Astrophys. Mtg., Dynamics of Galaxies: from the Early Universe to the Present, vol 197, ed by F. Combes, G.A. Mamon, V. Charmandaris (ASP, San Francisco 2000) pp 377–387, arXiv:astro-ph/9911333
- (43) C.J. Conselice: ApJ 638, 686 (2006)
- (44) M. Postman, M.J. Geller: ApJ 281, 95 (1984)
- (45) G.A. Mamon: ApJ 307, 426 (1986)
- (46) P. Hickson, H.J. Rood: ApJL 331, L69 (1988)
- (47) P. Hickson, E. Kindl, J.P. Huchra: ApJ 331, 64 (1988)
- (48) S.M. Weinmann, F.C. van den Bosch, X. Yang, H.J. Mo: MNRAS 366, 2 (2006)
- (49) A. Dressler, A.J. Oemler, W.J. Couch, et al.: ApJ 490, 577 (1997)
- (50) J.E. Barnes: ApJ 393, 484 (1992)
- (51) F.C. van den Bosch: MNRAS 331, 98 (2002)
- (52) G.A. Mamon, T. Sanchis, E. Salvador-Solé, J.M. Solanes: A&A 414, 445 (2004)
- (53) T. Fukushige, J. Makino: ApJ 557, 533 (2001)
- (54) S. Hatton, J. Devriendt, S. Ninin, F.R. Bouchet, B. Guiderdoni, D. Vibert: MNRAS 343, 75 (2003)
- (55) S.P.D. Gill, A. Knebe, B.K. Gibson: MNRAS 356, 1327 (2005)
- (56) J. Binney, G.A. Mamon: MNRAS 200, 361 (1982)
- (57) R.G. Carlberg, H.K.C. Yee, E. Ellingson: ApJ 478, 462 (1997)
- (58) J.F. Navarro, C.S. Frenk, S.D.M. White: ApJ 462, 563 (1996)
- (59) E.L. Łokas, G.A. Mamon: MNRAS 343, 401 (2003)
- (60) P. Katgert, A. Biviano, A. Mazure: ApJ 600, 657 (2004)
- (61) A. Mahdavi, M.J. Geller: ApJ 607, 202 (2004)
- (62) R.G. Carlberg, H.K.C. Yee, S.L. Morris, et al.: ApJ 552, 427 (2001)
- (63) Y.T. Lin, J.J. Mohr, S.A. Stanford: ApJ 591, 749 (2003)
- (64) A.E. Evrard, C.A. Metzler, J.F. Navarro: ApJ 469, 494 (1996)
- (65) A.J.R. Sanderson, T.J. Ponman, A. Finoguenov, E.J. Lloyd-Davies, M. Markevitch: MNRAS 340, 989 (2003)
- (66) M. Arnaud, E. Pointecouteau, G.W. Pratt: A&A 441, 893 (2005)
- (67) P. Prugniel, F. Simien: A&A 321, 111 (1997)
- (68) G.A. Mamon, E.L. Łokas: MNRAS 363, 705 (2005)
- (69) G.A. Mamon, G. Boué: MNRAS to be submitted (2006)
- (70) A. Biviano, M. Girardi: ApJ 585, 205 (2003)
- (71) E.L. Łokas, R. Wojtak, S. Gottlöber, G.A. Mamon, F. Prada: MNRAS 367, 1463 (2006)
- (72) G.A. Mamon, E.L. Łokas: MNRAS 362, 95 (2005)
- (73) D.H. Jones, B.A. Peterson, M. Colless, W. Saunders: MNRAS 369, 25 (2006)