Light Dark Matter Annihilations into Two Photons
Abstract
We compute the pair annihilation cross section of light (spin-0) dark matter particles into two photons and discuss the detectability of the monochromatic line associated with these annihilations.
I Introduction
The precise determination by INTEGRAL/SPI Jean et al. (2003a) of the characteristics of the 511 keV line emitted in our galaxy Dixon et al. (1997); Sreekumar et al. (2004); Churazov et al. (2005); Milne et al. (2002); Dermer and Skibo (1997); Pohl (1998); Dermer and Murphy (2001); Milne et al. (2001) has shed new light on the physics of the inner part of the Milky Way. This line has now been identified with a high level of confidence as originating from electron-positron annihilations. Although this recent detection probes unambiguously the existence of anti-matter inside our galaxy, its origin remains unknown.
The observation of a relatively high fraction of low energy positrons in the bulge and a low fraction in the disk certainly constitutes the most puzzling aspect of this emission.
Most of the astrophysical sources that have been proposed in the literature (e.g. Wolf-Rayet stars, Hypernovae, cosmic rays, pulsars, black holes) are associated with a low value of the bulge-to-disk (B/D) ratio or cannot explain why the 511 keV radiation seems to follow the stellar morphology of the galactic bulge.
The remaining plausible sources are old galactic populations, such as Low Mass X-ray Binaries (LMXB) and Type 1a Supernovae (SN1A) Knodlseder et al. (2005). However, to explain the observed flux and positron distribution, they both rely on strong hypothesis. LMXB require that the positrons emitted in the disk escape into the bulge while SN1A need a positron escape fraction and an explosion rate that are large enough to maintain a steady flux.
At least eight point sources could explain the diffuse emission as observed by SPI Knodlseder et al. (2005). However Ref. Weidenspointner et al. (2006) did not find any evidence for significant emission from point sources in the galactic centre as yet.
Another candidate could be light dark matter (LDM) particles Boehm et al. (2004); Boehm and Fayet (2004); Boehm et al. (2004) annihilating into electrons–positrons, neutrinos and photons. The positrons thus emitted lose their energy by ionization and eventually form para-positronium atoms with the thermal electrons present in the bulge of the galaxy Boehm et al. (2004). The 511 keV line emission is expected to be strongly correlated with the dark matter energy density distribution. The latter is maximal in the inner part of the galaxy so the positrons should mostly be produced in the centre of the Milky Way and should naturally stop on the electrons present in the bulge. Depending on the cuspyness of the profile, this would explain why the emission is well described by a sphere of only of diameter.
If dark matter is light enough, the amount of low energy gamma rays produced by the dark matter (DM) annihilations remains compatible with observations. Below the muon mass threshold ( MeV), the gamma ray production channels are: e.g. the DM pair annihilation into electron-positron plus a photon Boehm et al. (2004); Beacom et al. (2004); Bœhm (2006), positronium formation, inflight annihilations, initial and final state radiation associated with the electron-positron annihilations (although they have not been included as yet in previous studies).
All these processes generate a continuum. In addition, lines are produced at an energy corresponding to either the dark matter mass or at 511 keV. The former is the subject of the present paper. If the corresponding flux is large enough, this could be an unique tracer to answer the question of the low energy positrons.
After summarizing recent progress on this topic and their implication for the dark matter characteristics, we will estimate the annihilation cross section of light dark matter particles into two photons and discuss the observability of the line at . We base our analysis on the model proposed in Ref. Boehm et al. (2004); Boehm and Fayet (2004), which has been studied in detail in Ref. Boehm (2004a, b); Ascasibar et al. (2005); Boehm and Ascasibar (2004).
II Dark matter characteristics
II.1 Dark matter mass
The initial mass range proposed to fit SPI data was a few MeV to 100 MeV Boehm et al. (2004). However, recent analysis now provide more stringent constraints.
From the estimate of the () process, Ref. Beacom et al. (2004) found that the dark matter mass should be smaller than 20 MeV. However the formula that they used is incorrect within the framework that we consider in this paper. The correct expression, embedded into a more complete astrophysical analysis (in which INTEGRAL/SPI response function to the 511 keV source and a modelisation of the background were implemented), gives 30 MeV Bœhm (2006).
From the fraction of ortho and para–positronium, Ref. Jean et al. (2003b) found that the energy injection of the low energy positrons in our galaxy should be smaller than 10 MeV. Conservatively, this imposes MeV.
From the inflight annihilations, Ref. Beacom and Yuksel (2005) found an upper limit of 3 MeV. This result is based on two assumptions. Due to similar values of the flux below 1 MeV in the galactic disk at different longitudes, for and for , (, that is the galactic disk region), the authors assumed that the diffuse background had the same astrophysical origin in the inner and outer part of the galaxy. Also they assumed that one could extrapolate the power law description of the continuum at low energy to higher energy. With these assumptions, their estimate of the inflight annihilations at high energy is 1.2 to 1.3 larger than their modelisation of the continuum background. Such a bound is certainly very stringent. However, for the moment, we prefer to be cautious since they did not include all the processes that are responsible for the positron cooling and, perhaps even more importantly, the validity of their two main hypotheses needs to be demonstrated.
Finally, let us mention that an upper bound of 7 MeV has also been found in Ref. Boehm and Ascasibar (2004); Ascasibar et al. (2005) from the estimate of the electron .
Note also that in Ref. Serpico and Raffelt (2004); Fayet et al. (2006), is constrained to be larger than 2 and 10 MeV from nucleosynthesis and core collapse supernovae respectively. Ref. Serpico and Raffelt (2004) conclusions were obtained by assuming that DM was in thermal equilibrium at nucleosynthesis. However, for the cross section we consider, the neutrino thermal decoupling temperature is larger than 1 MeV. Also Ref. Fayet et al. (2006) concludes that MeV if the main annihilation channel is into neutrino pairs in the primordial universe. However, in our case, dark matter annihilates predominantly into electron-positron Boehm (2004a).
All these bounds are based on assumptions. To understand how the line flux scales with the dark matter mass, we will consider values of the dark matter mass ranging from the electron mass to 100 MeV. The reader is nevertheless invited to keep in mind that large values of the dark matter mass are disfavoured.
II.2 Dark matter density profile
Due to its coded mask, SPI observation cannot be related to a unique source. In particular, it is not possible to discriminate between low energy positrons originating from either dark matter annihilations or a set of astrophysical sources.
The hypothesis of a dark matter source (and the response to it by SPI) has been studied in detail in Ref. Ascasibar et al. (2005). The only dark matter scenario which can explain SPI observation requires a Navarro-Frenk-White profile (NFW) and a velocity-independent cross section. More precisely, using the conventional parametrization of the profile, the parameter (which fixes the slope of the profile in the inner part of the galaxy) was found to be equal to , assuming kpc and GeV/cm3 222These parameters correspond to the requirement of a local dark matter energy density of 0.3 GeV/cm3 in the solar neighborhood, a virial radius kpc and a mass ..
The authors tested different profiles, ranging from flat to cuspy (the cuspiest corresponds to that in Ref. Moore et al. (1999), hereafter denoted M99). They tested decaying dark matter particles (as proposed in e.g. Ref. Hooper and Wang (2004); Picciotto and Pospelov (2005); Kawasaki and Yanagida (2005)) as well as annihilating particles with a pure velocity-dependent and/or independent annihilation cross section Boehm and Fayet (2004).
The Maximum Likelihood Ratio (MLR) was obtained for a NFW model together with a velocity-independent cross section, excluding all other types of light dark matter scenarios. This conclusion might be alleviated if one considers extremely cuspy profiles. Indeed the MLR for scenarios based on velocity-dependent cross section or decaying particles increases with the cuspyness of the profile. Nevertheless, even for M99, the fit associated with a velocity-dependent cross section remains very bad. The fit is even worse for decaying particles. Hence, for conventional profiles as displayed in the literature, velocity-dependent cross section and decaying particles scenarios are excluded as a possible explanation for the 511 keV line.
To revive a pure velocity-dependent cross section, the profile would have to satisfy:
| (1) |
where and with growing as ( for M99 while, for NFW, in the inner kpc). Here cm3/s corresponds to the value of the annihilation cross section that satisfies the relic density condition (the precise value depends on the scenario) while cm3/s is the value required to fit INTEGRAL/SPI data (see next subsection). The condition expressed in Eq. 1 thus imposes the relationship between the density and velocity dispersion profiles and also requires . This suggests that, for “reasonable” values of , the density and velocity dispersion profiles must for example behave as and respectively. Whether these behaviours can be reproduced by using numerical simulations and can agree with observations is another matter.
Eventually, the very precise determination of the Milky Way dark matter halo profile could confirm or infirm the LDM hypothesis. At present, the profile is not known in the inner kpc where the signal comes from.
Simulations of galactic dark halos favour cuspy profiles (i.e. with a radial dependence given by where ) but they still lack of resolution at the scale of interest. Besides, generally, these simulations only give an information of the shape of the profile (often assuming sphericity) at the epoch of formation and do not take into account astrophysical processes that could perhaps affect the shape and the radial dependence.
Observations are therefore expected to be more powerful but they are more controversial. From the value of the optical depth () of our galaxy, as given by MACHO in 2001 Alcock et al. (2000), Ref. Binney and Evans (2001) concluded that the profile should behave as . However recent measurements Ansari (2004); Popowski et al. (2005) now favour cuspy profiles. In fact, Ref. Battaglia et al. (2005) even concluded that a NFW profile with a concentration parameter reproduces – as a whole– the trends in the data better than a truncated flat model (with in the inner part) although the latter cannot be excluded (it provides a better fit at larger radii where the profile behaves as ).
These results disagree with some of the observed profiles of dwarf galaxies which are shallower than predicted Gentile et al. (2004). However observations and predictions can perhaps be reconciled if one takes into account e.g. triaxial effects, astrophysical processes, the fact that some dwarfs are being disrupted and/or the presence of a bar Hayashi et al. (2004); Rhee et al. (2004).
II.3 Tree-level annihilation cross section to fit the 511 keV line
According to Ref. Ascasibar et al. (2005), the LDM scenario reproduces the observed flux when
| (2) | |||||
II.4 Nature of light dark matter
As explained above, only scenarios, for which the pair annihilation cross section into is velocity-independent, provide a good fit to INTEGRAL/SPI observations. This selects either spin-0 dark matter particles exchanging a heavy fermion , spin-1/2 particles exchanging a heavy scalar or spin-1/2 dark matter candidates coupled to a new gauge boson with axial couplings to electrons and positrons.
The second possibility is excluded because it requires too small values of the mass of the scalar for perturbative values of the couplings. The third scenario is also very constrained (if dark matter is axially coupled to the gauge boson) because the ratio , for MeV, scales as with . This ratio is therefore too small in the inner kpc to fit SPI data; it should be about
Eq.2 therefore favours spin-0 dark matter candidates coupled to a heavy fermion .
Our model nevertheless contains an additional ingredient. To achieve the correct relic density, one needs to introduce a new gauge boson. The associated pair annihilation cross section being velocity dependent, it can also evade low energy gamma ray constraints. On the other hand, it will not contribute significantly to the monochromatic line emission.
For these reasons, we shall consider only scalar dark matter particles annihilating through the exchange of heavy fermions. Possibilities to revive the fermionic case will be discussed elsewhere. Note that the order of magnitude of is comparable to that expected in a supersymmetric scenario. However our model is somewhat simpler.
III Dark matter annihilation cross section into two photons
In what follows, we consider the Lagrangian
where are the chiral projectors . The relevant diagrams are box-diagrams containing 1, 2 or 3 heavy fermions . Assuming that (which fixes the circulation of arrows), there are 6 diagrams, taking into account permutation of the photon external legs.
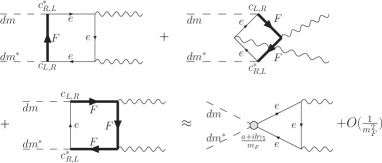
From naive power counting, each box is logarithmically divergent. However, gauge invariance dictates a result proportional to rather than . This requires 2 powers of external momenta, so that the integrand must in fact converge like for large loop momenta . In the limit (relevant due to LEP and other collider/accelerator constraints), the contribution of momenta larger than is . The leading term can thus be safely obtained by expanding the integrand in powers of and keeping only the first term. This corresponds to “pinching” the box with one into a triangle involving only electrons and an effective dm-dm-e-e coupling given by
with the real couplings given by .
For this set-up, computing the cross-section is a loop-textbook exercise for which we find:
| (3) | |||||
is a function of and given by the Passarino-Veltman scalar integral:
with the external photons four-momenta. For , this function develops an imaginary part corresponding to the formation of a real pair subsequently annihilating into 2 photons, and giving the largest contribution for masses above 1 MeV.
For , behaves as , so that both terms of the cross section behave as . This limit is relevant to estimate the effect of heavier particles than the electron in the loop. For example, the contribution of the lepton could be significant if the corresponding couplings are larger than (with ), i.e. if they scale at least like usual Yukawa couplings. Since an independent detailed analysis is required to check whether or not such couplings can pass particle physics constraints, we prefer giving a conservative estimate based on the electron contribution only. The latter cannot be turned off without losing the 511 keV line signal. It therefore constitutes a safe lower bound on the detectability of the line at .
Within the pinch approximation, the cross-section relevant for the origin of the 511 keV emission is:
with , which indeed for reduces to the expression used e.g. in Ref. Ascasibar et al. (2005) for large . After careful comparison with SPI data, the last reference found
The annihilation cross-section is then also determined by this measurement in terms of the ratio of annihilation branching ratios:
| (4) | |||
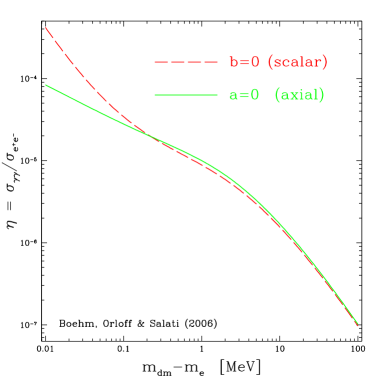
As announced, this ratio plotted in fig.2 cannot vanish, whatever the value of , so that a minimum flux is guaranteed. As approaches from above, the ratio increases like for a pure scalar coupling () and like for an axial one (). Playing with this enhancement is however unnatural. It can spoil nucleosynthesis during the LDM primordial annihilations, and can furthermore be shadowed by the tail of the 511 line. In the table below, we give typical values of the ratio for the most conservative case (i.e. , ). The annihilation cross section into two photons decreases almost linearly with the dark mater mass for MeV:
Finally, let us notice that the above computation applies equally well to late decaying (instead of pair-annihilating) dark matter models, such as the intriguing unification of dark matter and dark energy in a single modulus field proposed in Ref. Kawasaki and Yanagida (2005); Takahashi and Yanagida (2006). The discussion in the next section will therefore concern both annihilating and decaying dark matter.
In the case of decaying particles, the angular distribution of 511 keV radiation traces the dark matter density (instead of ). The latter needs to increase at least twice as fast as the annihilating DM halo profile towards the galactic center, e.g. instead of , to provide a good fit to SPI data. Although probably too aggressive, such an increase may not be totally excluded. As pointed out in Ref. Kasuya and Kawasaki (2006), it would then be interesting to look for the monochromatic ’s produced by the same decaying dark matter as that which would produce the positrons inducing the 511 keV line. The simple guess used in Ref. Kasuya and Kawasaki (2006)
however increases instead of decreasing with . For a typical mass of 10 MeV, this guess overestimates the monochromatic flux by a factor 635 with respect to our result (Eq.4). As we will see in the next section, such a factor is crucial to the line observability.
IV Detectability of the monochromatic line
A few experiments have already scanned the energy range above the electron mass. The instruments on board of INTEGRAL for example have been designed to survey point-like objects as well as extended sources over an energy range between 15 keV-10 MeV. The instrument INTEGRAL/SPI itself is a spectrometer designed to monitor the 20 keV-8 MeV range with excellent energy resolution. Therefore a legitimate question is whether or not the line could have been (or could be) detected by the same instrument that has unveiled the 511 keV signal. This essentially depends on the ratio as given in Fig. 2, and on the background.
The 511 keV emission has been measured with a 10% precision Strong et al. (2005) to be
inside a region that extends over in longitude and in latitude. If this emission originates from a NFW distribution of LDM species around the galactic center with a characteristic halo radius of 16.7 kpc, the signal from the inner is found Ascasibar et al. (2005) to be
once the SPI response function is taken into account and the instrumental background is properly modeled. If the positron propagation is negligible, then the map of the 511 keV emission should correspond to that of the LDM annihilations.
Within this approximation, we expect the spatial distributions of both the 511 keV and the two-gamma ray lines to be identical and their intensities to be related by the ratio :
This expression is approximately valid as long as the angular radii and of the regions monitored by the gamma-ray spectrometer are small333A useful approximation of the intensity for an NFW profile with kpc is given by: This expression is accurate to 5 for and shows that deviations from only appear for .. In what follows, the fraction of positrons forming positronium has been taken equal to as in Ref. Ascasibar et al. (2005). This is in perfect agreement with the positronium fraction derived in Ref. Weidenspointner et al. (2006), i.e. . The monochromatic line flux
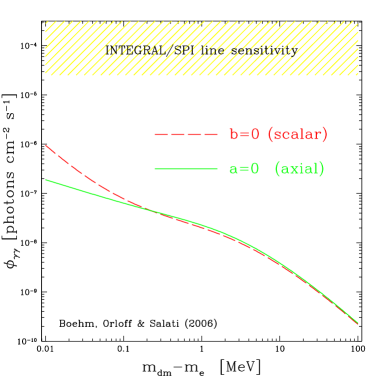
has been plotted in Fig. 3 in the case of the LDM model with exchange and assuming a NFW profile. The angular radius corresponds to the field of view of the satellite. For typical LDM masses in the MeV range, the expected flux is about three orders of magnitude below the claimed INTEGRAL/SPI line sensitivity Roques et al. (2003) (which is about ph cm-2 s-1 after seconds). An unrealistic exposure of 30,000 years would thus be required in order to detect the line. When the LDM species is degenerate in mass with the electron, the flux is only a factor of 25 below the SPI detection limit (assuming a pure scalar coupling b=0). As long as the mass difference does not exceed 0.1 MeV, it is roughly comparable with the expected 478 keV line signal emitted by Novae Teegarden and Watanabe (2006), that is about ph cm-2 s-1.
SPI sensitivity is limited by the instrumental background that arises mostly from cosmic rays impinging on the apparatus and activating the BGO scintillator. On the contrary, the absolute sensitivity of an ideal instrument is purely limited by the gamma-ray continuum background. This emission has been recently estimated by Ref. Strong et al. (2005) who found
inside the central region that extends over in longitude and in latitude. The energy is expressed in units of MeV.
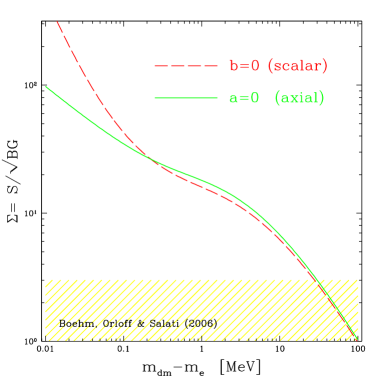
We thus estimate the significance for the LDM line to emerge above this background (assuming it is isotropic) to be
with the surface of the detector, the exposure time, the above-mentionned continuum background intensity and the energy resolution. The significance (displayed as a function of the dark particle mass in Fig. 4 for a surface of 1 m2, an exposure duration of year and an energy resolution of ) indicates that those values would theoretically allow to extract the minimal guaranteed signal computed at 3 standard deviations above background for all relevant LDM masses below 30 MeV.
There is nothing to be gained by narrowing the angular aperture because, for the assumed NFW profile, the signal increases linearly with this angular radius, as does the square root of an isotropic background.
In contrast, note that the monochromatic line should be extremely narrow: its width is expected to be about a few eV which experimentally is very challenging if one compares it with the present SPI sensitivity that is about at MeV energies. At lower energies, there are nevertheless instruments, e.g. X-ray CCD, bolometers, Bragg spectrometers which are able to resolve eV widths. A significant improvement on the resolution at higher energies would probably be necessary in order to reach a large enough significance and ensure detection. Indeed, an effective surface of 1m2 might be hard to attain in space.
V conclusion
In this paper, we computed the pair annihilation of LDM particles into two photons and determined the flux associated with the monochromatic line . To obtain a conservative estimate, we considered only interactions and ignored all other possible interactions. With this simplistic assumption we could relate our estimate of to the 511 keV flux that has been measured by INTEGRAL/SPI. We made the reasonable assumption that the particle was much heavier than the dark matter and the electron. We also assumed that the couplings were small enough () so that the contribution associated with the electron mass in the cross section could be neglected.
We found that was ranging from to for dark matter masses from to 100 MeV. These values are well below the present SPI sensitivity.
Next generation instruments such as AGILE/(super AGILE) or GLAST, which in principle could be more promising, will probably be limited by the energy range that they are able to investigate. Future instruments might nevertheless be able to see this line if their energy resolution and sensitivity are improved by a large factor with respect to SPI present characteristics.
Maybe a better chance to detect this line is to do observations at a high latitude and a longitude slightly off the galactic centre. In this case, indeed, the background should drop significantly (the density of dark clouds has been measured recently Grenier et al. (2005)) but the line flux may decrease by a smaller factor.
In dwarf galaxies, where the dark matter content dominates over baryons, the gamma ray background is also expected to be quite suppressed. The line might be easier to detect.
Among the closest dwarfs to us, Sagittarius Dwarf Galaxy (located at a distance of 24 kpc from us and with a size of about Ibata et al. (1995)), is particularly interesting. The amount of intrastellar gas is very low and the dwarf contains a large amount of popII stars. The problem is that it is somehow hidden by the galactic centre although it is a bit off.
In principle, dwarf spheroidals are a powerful tool for testing the LDM hypothesis. E.g. the detection of a bright 511 keV line within INTEGRAL’s sensitivity would provide a strong confirmation of this scenario Hooper et al. (2004). However, its detectability relies on the hypothesis that there are enough electrons to thermalize and to stop the positrons. No gas has ever been detected in any of the local group dwarf galaxies so it is hard to make reliable estimates. Also one needs to know the spatial distribution of the gas to make accurate predictions and determine whether the 511 keV emission will be extended or not.
SDG is being disrupted by the tidal forces of our galaxy so the approximation of a spherical DM halo profile probably leads to incorrect predictions.
At last, depending on the fraction of gas, inflight annihilations may happen before the positrons have time to thermalize. In this case, there should be a broad line at an energy 444Note that, for the Milky Way, the detection of both the 511 keV line and the continuum indicates that the interstellar medium is in a warm partially ionized phase. However the temperature of the gas in the dwarf may be larger. Even if the positrons can annihilate after being thermalized, this would imply a suppression of the positronium formation rate and would favour inflight annihilations. instead of a 511 keV line.
The study of the channel has therefore two advantages compared to the 511 keV emission: it does not rely on the estimate of the electron number density nor the gas fraction inside the dwarf. It is also independent of the gas spatial distribution and can probe directly the DM halo profile. It has one major drawback: it is a higher order process and it is therefore suppressed compared to the the production. Since Ref. Cordier et al. (2004) looked for the 511 keV line in SDG and did not find it, the chance to detect the monochromatic line is probably very small although Ref. Cordier et al. (2004) was unable to probe the upper limit of the predicted range and the number density of electrons inside the dwarfs may have been overestimated.
Acknowledgement
We are grateful to Y. Ascasibar, M. Casse, ISDC members, E. Pilon and A.W. Strong, for helpful comments. The authors thank the PNC (french Programme National de Cosmologie) for financial support to this work.
References
- Jean et al. (2003a) P. Jean et al., Astron. Astrophys. 407, L55 (2003a), eprint astro-ph/0309484.
- Dixon et al. (1997) D. D. Dixon et al. (1997), eprint astro-ph/9703042.
- Sreekumar et al. (2004) P. Sreekumar, F. W. Stecker, and S. C. Kappadath, AIP Conf. Proc. 510, 459 (2004), eprint astro-ph/9709258.
- Churazov et al. (2005) E. Churazov, R. Sunyaev, S. Sazonov, M. Revnivtsev, and D. Varshalovich, Mon. Not. R. Astron. Soc. 357, 1377 (2005).
- Milne et al. (2002) P. A. Milne, J. D. Kurfess, R. L. Kinzer, and M. D. Leising, New Astron. Rev. 46, 553 (2002), eprint astro-ph/0110442.
- Dermer and Skibo (1997) C. D. Dermer and J. G. Skibo (1997), eprint astro-ph/9705070.
- Pohl (1998) M. Pohl (1998), eprint astro-ph/9807268.
- Dermer and Murphy (2001) C. D. Dermer and R. J. Murphy (2001), eprint astro-ph/0107216.
- Milne et al. (2001) P. A. Milne et al. (2001), eprint astro-ph/0106157.
- Knodlseder et al. (2005) J. Knodlseder, P. Jean, V. Lonjou, et al., accpted in A&A (2005), eprint astro-ph/0506026.
- Weidenspointner et al. (2006) G. Weidenspointner et al. (2006), eprint astro-ph/0601673.
- Boehm et al. (2004) C. Boehm, T. A. Ensslin, and J. Silk, J. Phys. G30, 279 (2004), eprint astro-ph/0208458.
- Boehm and Fayet (2004) C. Boehm and P. Fayet, Nucl. Phys. B683, 219 (2004), eprint hep-ph/0305261.
- Boehm et al. (2004) C. Boehm, D. Hooper, J. Silk, M. Casse, and J. Paul, Phys. Rev. Lett. 92, 101301 (2004).
- Beacom et al. (2004) J. F. Beacom, N. F. Bell, and G. Bertone (2004), eprint astro-ph/0409403.
- Bœhm (2006) U. P. Bœhm, C. (2006).
- Boehm (2004a) C. Boehm, Phys. Rev. D70, 055007 (2004a), eprint hep-ph/0405240.
- Boehm (2004b) C. Boehm, Int. J. Mod. Phys. A19, 4355 (2004b).
- Ascasibar et al. (2005) Y. Ascasibar, P. Jean, C. Boehm, and J. Knoedlseder (2005), eprint astro-ph/0507142.
- Boehm and Ascasibar (2004) C. Boehm and Y. Ascasibar, Phys. Rev. D70, 115013 (2004), eprint hep-ph/0408213.
- Jean et al. (2003b) P. Jean et al., Astron. Astrophys. 407, L55 (2003b).
- Beacom and Yuksel (2005) J. F. Beacom and H. Yuksel (2005), eprint astro-ph/0512411.
- Serpico and Raffelt (2004) P. D. Serpico and G. G. Raffelt, Phys. Rev. D70, 043526 (2004), eprint astro-ph/0403417.
- Fayet et al. (2006) P. Fayet, D. Hooper, and G. Sigl, Phys. Rev. Lett. 96, 211302 (2006), eprint hep-ph/0602169.
- Moore et al. (1999) B. Moore et al., Astrophys. J. 524, L19 (1999).
- Hooper and Wang (2004) D. Hooper and L.-T. Wang, Phys. Rev. D70, 063506 (2004), eprint hep-ph/0402220.
- Picciotto and Pospelov (2005) C. Picciotto and M. Pospelov, Phys. Lett. B605, 15 (2005), eprint hep-ph/0402178.
- Kawasaki and Yanagida (2005) M. Kawasaki and T. Yanagida, Phys. Lett. B624, 162 (2005), eprint hep-ph/0505167.
- Alcock et al. (2000) C. Alcock et al., Astrophys. J. 541, 734 (2000).
- Binney and Evans (2001) J. J. Binney and N. W. Evans, Mon. Not. R. Astron. Soc. 327, L27 (2001).
- Ansari (2004) R. Ansari (2004), eprint astro-ph/0407583.
- Popowski et al. (2005) P. Popowski et al. (MACHO), Astrophys. J. 631, 879 (2005), eprint astro-ph/0410319.
- Battaglia et al. (2005) G. Battaglia et al., Mon. Not. Roy. Astron. Soc. 364, 433 (2005), eprint astro-ph/0506102.
- Gentile et al. (2004) G. Gentile, P. Salucci, U. Klein, D. Vergani, and P. Kalberla, Mon. Not. R. Astron. Soc. 351, 903 (2004), eprint astro-ph/0403154.
- Hayashi et al. (2004) E. Hayashi et al. (2004), eprint astro-ph/0408132.
- Rhee et al. (2004) G. Rhee, O. Valenzuela, A. Klypin, J. Holtzman, and B. Moorthy, The Astrophysical Journal 617, 1059 (2004).
- Takahashi and Yanagida (2006) F. Takahashi and T. T. Yanagida, Phys. Lett. B635, 57 (2006), eprint hep-ph/0512296.
- Kasuya and Kawasaki (2006) S. Kasuya and M. Kawasaki, Phys. Rev. D73, 063007 (2006), eprint astro-ph/0602296.
- Strong et al. (2005) A. W. Strong et al., Astron. Astrophys. 444, 495 (2005), eprint astro-ph/0509290.
- Roques et al. (2003) J. P. Roques et al. (2003), eprint astro-ph/0310793.
- Teegarden and Watanabe (2006) B. J. Teegarden and K. Watanabe (2006), eprint astro-ph/0604277.
- Grenier et al. (2005) I. A. Grenier, J.-M. Casandjian, and R. Terrier, Science 307, 1292 (2005).
- Ibata et al. (1995) R. A. Ibata, G. F. Gilmore, and M. J. Irwin, Mon. Not. Roy. Astron. Soc. 277, 781 (1995), eprint astro-ph/9506071.
- Hooper et al. (2004) D. Hooper, F. Ferrer, C. Boehm, J. Silk, J. Paul, N. W. Evans, and M. Casse, Physical Review Letters 93, 161302 (2004).
- Cordier et al. (2004) B. Cordier et al. (2004), eprint astro-ph/0404499.