XMM-LSS discovery of a galaxy cluster
Abstract
We present details of the discovery of XLSSJ022303.0-043622, a cluster of galaxies. This cluster was identified from its X-ray properties and selected as a candidate from its optical/near-IR characteristics in the XMM Large-Scale Structure Survey (XMM-LSS). It is the most distant system discovered in the survey to date. We present ground-based optical and near IR observations of the system carried out as part of the XMM-LSS survey. The cluster has a bolometric X-ray luminosity of erg s-1, fainter than most other known X-ray selected clusters. In the optical it has a remarkably compact core, with at least a dozen galaxies inside a 125 kpc radius circle centred on the X-ray position. Most of the galaxies within the core, and those spectroscopically confirmed to be cluster members, have stellar masses similar to those of massive cluster galaxies at low redshift. They have colours comparable to those of galaxies in other clusters, consistent with showing little sign of strong ongoing star formation. The bulk of the star formation within the galaxies appears to have ceased at least 1.5 Gyr before the observed epoch. Our results are consistent with massive cluster galaxies forming at and passively evolving thereafter. We also show that the system is straightforwardly identified in Spitzer/IRAC and data obtained by the SWIRE survey emphasising the power and utility of joint XMM and Spitzer searches for the most distant clusters.
keywords:
galaxies – clusters; large-scale structure1 Introduction
Determining the properties of clusters and their constituent galaxies at is central to understanding how such systems evolve with cosmic time. Distant clusters are identifiable using multiple techniques across a number of wavebands, from optical and near IR imaging surveys that identify emission from their galaxies to X-ray surveys that identify emission from the gaseous Intra Cluster Medium (ICM). As the X-ray identification of a cluster is straightforwardly related to important physical parameters such as the mass of a system, X-ray selected samples have been the most heavily studied to date. Although X-ray work had been carried out beforehand (notably with the EMSS, Gioia et al. 1990), it was work using the ROSAT satellite which allowed the routine discovery and study of clusters out to , (e.g. Böhringer et al. 2004; Rosati, Borgani, & Norman 2002; Vikhlinin et al. 1998; Mullis et al. 2003). Confirmed clusters remain rare beasts despite well over a decade of searches, with only a handful known from the ROSAT era (e.g. Vikhlinin et al. 1998; Rosati et al. 1999; Stanford et al. 2002; Blakeslee et al. 2003). The potential of XMM-Newton to detect clusters out to was demonstrated as early as a year and a half before XMM launched (Valtchanov et al., 2000). Recently Mullis et al. (2005) and Stanford et al. (2006) have shown that clusters out to are serendipitously detectable in moderately deep XMM exposures.
Work to date on X-ray selected clusters has shown that there is little evidence for evolution in their comoving space density (except for the most luminous systems) or relation out to (Rosati, Borgani, & Norman, 2002). Similarly, there is little evidence for anything other than passive evolution in the stellar populations of the massive galaxies in the cores of these clusters (e.g. Blakeslee et al. 2003) over the currently observed redshift range. Strong evolution of the ICM and galaxy populations in clusters seems to have occurred only at . Increasing the number of known and well-studied clusters is therefore key to identifying this epoch and understanding the physical processes that drove the evolution of clusters of galaxies.
We are carrying out the XMM Large-Scale Structure Survey (XMM-LSS, Pierre et al. 2004) in order to study the large-scale distribution of matter in the Universe as traced through X-ray emission from clusters of galaxies and active galactic nuclei (AGN). One of the survey goals is to search for clusters of galaxies out to to luminosities erg s-1(i.e. a flux limit of erg cm-2s-1). Here we present details of the discovery of a cluster with the highest spectroscopically-confimed redshift, , so far found in the XMM-LSS. Some initial photometric data on this cluster was presented in Andreon et al. (2005).
This source was discovered in a survey of a relatively large contiguous area of sky ( deg2), specifically designed to detect clusters to . This has the advantage that existing multi-wavelength datasets covering the same area can be used in combination to identify clusters from among the faint, extended X-ray sources in the XMM data, whereas for sources serendipitously detected in archived non-contiguous X-ray data, the multi-wavelength data have to be obtained after the identification of X-ray candidates. The disadvantage of the survey approach is that the X-ray exposure times are necessarily limited in order to cover sufficient area of sky (in the case of the XMM-LSS to typically 10-20 ksec), whereas the serendipitous approach can make use of far deeper exposures.
In the following we present the X-ray, optical and near-IR data for XLSSJ022303.0-043622, including Spitzer/IRAC 3.6µm and 4.5µm band imaging from the SWIRE survey. We discuss the cluster properties, briefly comparing them to those of other known clusters and demonstrate that a combined XMM and Spitzer survey is an efficient way of identifying further high redshift clusters. The cluster is also catalogued as XLSSC 046111See http://vizier.u-strasbg.fr/cgi-bin/Dic-Simbad?XLSSC. We use CDM cosmology ( km s-1 Mpc-1).
2 Observations
2.1 X-ray
The XMM X-ray data for the field of this cluster (XMM exposure ID 0109520601) were obtained as part of the first set of XMM-LSS pointings during GTO and AO-1 time. The resulting event list for the field was filtered for high background periods following Pratt & Arnaud (2002) with a resulting exposure time of 51.6 ks across the three XMM detectors (MOS1: 22.5 ks; MOS2: 22.7 ks; pn: 16.4 ks). Less than 1% of the MOS and % of the pn exposure was affected by periods of high background. The “cleaned” event list was then used to create images in different energy bands for the pn and MOS detectors. Using the procedure in Valtchanov et al. (2001), potential candidate clusters were selected as extended X-ray sources in the [0.5-2] keV band, taking into account the effect of vignetting.
The cluster was detected as an extended X-ray source at an off-axis angle of using an early version of the XMM-LSS analysis pipeline. At this angle an incoming X-ray photon sees 60 per cent of the telescope area due to vignetting. Placing a radius aperture over the source, and correcting for background counts gave 40 counts for the object in the [0.3-10] keV band of the MOS detectors and 45 in the PN detector. In the intervening time between the detection of the X-ray source and now, we have evolved our X-ray analysis based on the experience gained from the early XMM-LSS data. In section 3 we discuss the X-ray luminosity and temperature of the cluster as derived from our latest analysis methods (discussed in detail in Willis et al. 2005 and Pierre et al. 2006). Here we note that the source is detected and classified by the latest version of the XMM-LSS pipeline as a “C2” source (see Pacaud et al. 2006 for details).
2.2 Optical and Near-IR data
On their own, the observed X-ray properties of the source are compatible with it being a nearby galaxy, a moderate redshift group or a high redshift cluster. Additional multi-wavelength data is required to determine its nature. The initial XMM-LSS sky area was imaged in several optical bands with the CFH12k camera on CFHT (Le Fèvre et al., 2004; McCracken et al., 2003). The lack of a clear identification for XLSSC 046 in this relatively shallow optical data made the object a strong distant cluster candidate. In particular, there was no clear overdensity of galaxies (or an individual low redshift galaxy) at the X-ray position down to , indicating that the X-ray source was a potential cluster. Subsequently, the field of the cluster was observed during the Canada-France-Hawaii Telescope Legacy Survey (CFHTLS) using Megacam on CFHT (Boulade et al., 2003). The and photometry used in this paper is derived from the CFHTLS data.
As a result of the lack of a clear optical ID in the CFH12K data, the source was targetted as part of an ESO NTT/SOFI observing run to follow up potential distant clusters (programme ID 70.A-0733A) on 2002 November 19 and 20. The cluster was observed for 40 minutes in each of and in photometric conditions at an airmass below 1.5, with observations divided into multiple, dithered exposures. These data were calibrated by observations of photometric standards sj9105 and sj9106 (Persson et al., 1998). Five 2MASS-catalogued objects were detected in the frames, the photometry for each had a typical uncertainty of 0.1 magnitude in the 2MASS catalogue; our calibration matches that of 2MASS within these uncertainties. All and magnitudes presented in this paper have been converted to AB magnitudes assuming and for consistency with the CFHTLS and IRAC magnitudes, which are measured in this system.
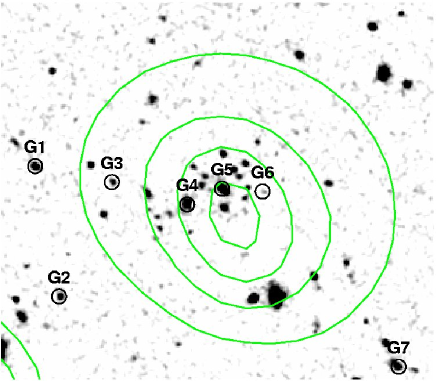
A high surface density of faint galaxies (, or in Vega) – fifteen in a diameter circle (a projected scale of 250 kpc at ) – was identified in both near-IR bands at the position of the X-ray detection (see figures 1 and 2). A circle of twice that diameter includes only a further eight objects in the same magnitude range, indicating the compactness of the galaxy distribution. All of this is compatible with a compact cluster of galaxies at .
Spectroscopic observations of the cluster were obtained using the ESO/VLT FORS2 spectrograph on 2004 December 14 and 15. Multi-slit spectroscopic data were obtained using the 600z23 grism and OG59032 order-sorting filter. The slit width on each MXU mask was typically and resulted in a spectral resolution of 8Å over the wavelength interval 7400 to 10000Å. The cluster was observed with two slit masks oriented at 90 degrees to each other in order to maximise the sampling of candidate cluster members. Each mask was observed for minute exposures at an airmass below 1.5 and typical atmospheric seeing of . Any given object was observed through one slit mask giving total exposure times of two hours per galaxy. Spectral data were processed employing standard reduction techniques within IRAF. Zero level, flat–field and cosmic ray corrections were applied to all data prior to the identification, sky subtraction and extraction of individual spectra employing the apextract package. The dispersion solution for each extracted spectrum was determined employing HeNeAr lamp exposures with a typical residual scatter of Å and the final spectra were resampled to a linear wavelength scale. A spectrophotometric standard star from the atlas of Hamuy et al. (1992) was observed during each night and was employed to correct for the relative instrumental efficiency as a function of wavelength.
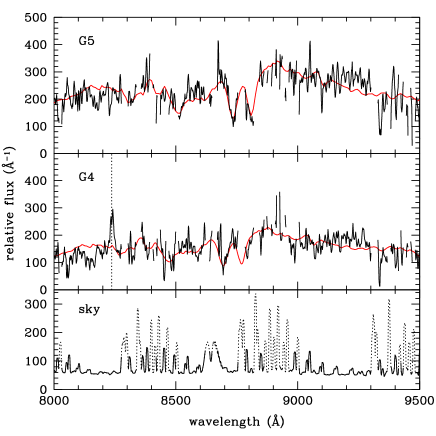
Reliable redshift values consistent with a cluster redshift of were estimated for seven galaxy spectra (see table 1). Initial redshift estimates obtained from a visual inspection of prominent absorption and emission features in individual spectra were refined via cross–correlation with a representative early–type galaxy template (Kinney et al., 1996) employing the IRAF routine xcsao (Tonry & Davis, 1979). Examples of extracted spectra are displayed in figure 3. The location of all galaxies confirmed at the cluster redshift are displayed in figure 1.
2.3 SWIRE Spitzer observations
The field of the cluster was imaged by the IRAC camera on the Spitzer satellite as part of the SWIRE (Lonsdale et al., 2003) survey of the XMM-LSS sky area. Images of the field at 3.6 and – reduced using the standard SWIRE processing (Lonsdale et al., 2004) – clearly show the cluster (the 3.6 µm image is used as the red channel in figure 2). The high surface density of the galaxies at the very centre of the cluster, coupled with the relatively poor spatial resolution of IRAC at 3.6 and leads to high crowding at the cluster centre and so to difficult photometry in this region. The rest of the field is uncrowded making for straightforward photometry. The field was also imaged at 24 µm by the MIPS camera. No cluster members were detected to a limit of 0.15mJy (fainter than 18.6 in AB). Unfortunately this limit hardly constrains the star formation activity in the galaxies. At the cluster redshift it translates to a luminosity of less than L⊙, so no cluster galaxies host obscured ULIRG-like starbursts.
2.4 Photometry
In order to carry out photometry on our ground-based optical and near-IR data sets, we used Sextractor (Bertin & Arnouts, 1996) to identify individual objects and determine their magnitudes. Results for the six spectroscopically-confirmed cluster galaxies brighter than are given in table 1. We selected the catalogue in the band, using the SOFI image as the finding image for other bands.
| ID | Redshift | RA(2000) | Dec(2000) | ||||||
|---|---|---|---|---|---|---|---|---|---|
| G1 | 1.219 | 35.7739 | -4.6030 | ||||||
| G2 | 1.215 | 35.7725 | -4.6102 | ||||||
| G3 | 1.215 | 35.7696 | -4.6039 | ||||||
| G4 | 1.210 | 35.7655 | -4.6051 | ||||||
| G5 | 1.221 | 35.7635 | -4.6043 | ||||||
| G7 | 1.210 | 35.7539 | -4.6140 |
SEXTRACTOR was used in dual mode using the image to identify objects and to define the apertures that were then applied to the other optical and near-IR images. The band detected number counts peaked between and 21.65 and dropped to 50 per cent of the peak between and 22.4. We carried out the photometry in two ways: firstly by using 2 arcsec diameter fixed apertures with appropriate aperture corrections in each band and secondly by using the corrected isophotal “AUTO” magnitude (after Kron 1980) having previously smoothed all the data to 0.8 arcsec FWHM, matching the worst seeing image (the band). Both methods gave comparable results, in the following we report the 2 arcsec aperture magnitudes as the smoothing process complicates the determination of uncertainties for the corrected isophotal magnitudes.
Using the frame as the finding image was straightforward for the band photometry because the data shared the same plate scale and astrometric solution. For the Megacam data, we resampled the image to the Megacam plate scale to act as the finding image. The same objects and apertures were re-identified in the resampled image as in the original frame and applied to the and data. The resampling meant that the SEXTRACTOR coordinates (and therefore the aperture centre) for each object changed slightly, but by no more than 0.15 arcsec (and usually arcsec, less than half a pixel) in the case of the cluster members listed in table 1. As a check on the effect of resampling on the determination of magnitudes, we compared the results of photometry on the original and resampled image. For the galaxies of comparable magnitudes to those in listed in table 1, this introduced a scatter of no more than 0.05 magnitudes. Additionally we shifted the resampled image by 0.5 pixels in both RA and DEC to see what effect that had on the determination of the and band magnitudes. For galaxies of similar magnitudes to those in table 1, a typical scatter of 0.025 magnitudes was induced by this process. To account for these the uncertainties quoted in table 1 for and include the statistical uncertainties from SEXTRACTOR and a 0.05 magnitude systematic uncertainty added in quadrature.
For the IRAC photometry, we used the catalogue made by the SWIRE collaboration from the SWIRE data release 2 (described in Surace et al. 2005) as this provides aperture photometry with appropriate aperture corrections. Following the recommendations in Surace etal we used apertures of diameter 3.8 arcsec (twice the instrumental FWHM) which provide the most accurate photometry and have had aperture corrections for unresolved sources (like the cluster galaxies) already applied. The IRAC aperture centroids matched those in the K-band to within 0.2 arcsec for all objects in table 1 except for G3 which matched within 0.4 arcsec. For galaxies G4,5 and 7, the 3.8 arcsec apertures included emission from fainter close companion galaxies. To correct for this, we determined the difference in -band flux between 2 and 3.8 arcsec apertures centred on these objects, assumed that the companions had similar colours to the brighter galaxies and adjusted this colour for each of the objects accordingly (a correction of between 0.3 and 0.37 magnitudes in each case). The assumption of similar colours for the companion objects is reasonable as they are likely cluster members, nevertheless this is a source of uncertainty. Assuming a potential colour differential of between the main galaxy and a companion contributing 30 per cent of the flux in an aperture, this would give an uncertainty of just les than 0.1 magnitudes in the colur determined in this way. This is reflected in the uncertainties quoted for the colours of these objects in table 1. The absolute accuracy quoted by the SPITZER Science Centre for IRAC is 10% in flux density. The and uncertainties listed in table 1 include this and the statistical uncertainties combined in quadrature.
3 Discussion
3.1 X-ray luminosity of the cluster
With the redshift of the cluster known, the X-ray properties of the cluster can be estimated, although with of order 85 detected photons, uncertainties are large. The temperature of the X-ray emitting gas was estimated using XSPEC. Photons from all detectors were extracted from a 34 arcsec radius circle centred on the X-ray centroid. Following Willis et al. (2005), a spectral fit was performed with XSPEC, using an APEC model (Smith et al., 2001), abundances from Grevesse & Sauval (1999) and a Galactic neutral hydrogen column of cm-2 (Dickey & Lockman, 1990). This resulted in a best fit temperature of 3.8keV, with a 1 lower limit of 1.9keV and an effectively unconstrained upper limit.
In order to determine a count-rate and hence a luminosity for the cluster, an aperture over which the rate is to be measured must be defined. The low number of counts from the object limits the useful size of the aperture to be around 50-60″, comparable to those used in previous X-ray studies of distant clusters. To support this choice we estimated r500, the radius at which the cluster density is 500 times the critical density at its redshift. Using the best-fit temperature and following the method in Willis et al. (2005), we estimated this to be 55″(albeit with considerable uncertainty due to the uncertainty on the temperature). We used this radius for the subsequent analysis. The background-subtracted count rate in the [0.5-2]keV band within this radius was cts/s, corresponding to a flux of erg s-1 cm-2. Using this to normalise the spectral fit gives an unabsorbed bolometric luminosity of erg s-1with a statistical error of approximately 20 per cent. Ideally we would apply an aperture correction for flux beyond 55 ″, but given the limited signal-to-noise this would be highly uncertain for this object, so we only quote the luminosity within this aperture. From simulations and experience with other low count-rate groups and clusters in the XMM-LSS, we found that statistical errors are usually under-estimates of the true errors on the luminosities in such cases (e.g. see Pierre et al. 2006), with more realistic errors twice that of the raw statistical values. Consequently, we quote an unabsorbed bolometric luminosity of erg s-1 and, for comparison to other high redshift clusters, a rest-frame [0.1-2.4]keV luminosity of erg s-1 for XLSSC 046.
Given that only seven cluster galaxies have confirmed redshifts, the velocity dispersion of the galaxies add little to this, all we can say here is that the dispersion in these redshifts is consistent with the derived X-ray luminosity. The above luminosity is low in comparison to those of other known clusters. RX J0848+4453 at has the lowest luminosity of the previously known systems. Using the values in Stanford et al. (2001) converted to the cosmology used here gives a [0.1-2.4]keV luminosity of erg s-1 measured in a 35 ″radius aperture. Using an aperture of the same size for XLSSC 046 results in a luminosity of erg s-1. Thus XLSSC 046 is about as a luminous as RX J0848+4453 (and possibly slightly less luminous), given the quoted uncertainties.

3.2 Galaxy properties
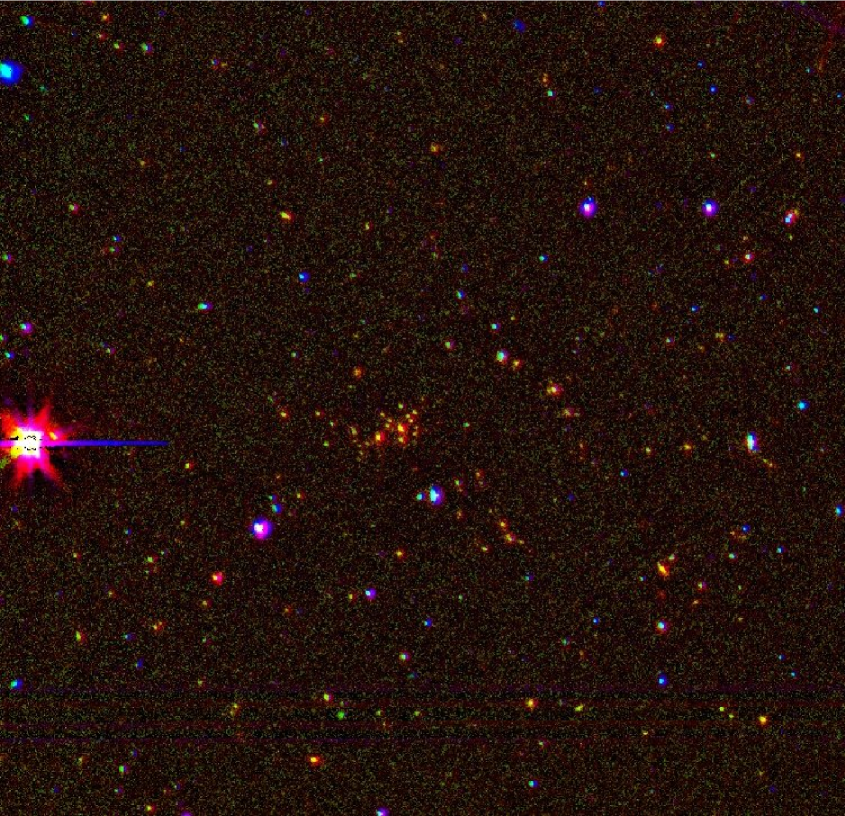
Figure 1 shows the band image of the cluster, overlayed with the X-ray contours from the XMM data, with the spectroscopically-confirmed cluster members labelled G1 to G7. Figure 2 shows a wider-field pseudo true-colour image of the cluster made from band VLT/FORS2 data, band NTT/SOFI data and the 3.6µm Spitzer/IRAC image. The cluster is easily identified in this image as an obvious overdensity of relatively red sources at the centre. As noted above, there are fifteen objects identified in a 250 kpc () diameter circle centred close to the X-ray peak. Simple visual inspection of figure 2 demonstrates that this is an order of magnitude or more overdensity of such sources in comparison to the surrounding field.
Figure 2 also indicates that many of the galaxies in the central 250 kpc region have similar colours, redder than the average faint source between and . Figure 4 shows the colour-magnitude diagram of the objects in the SOFI data. The symbols with error bars denote the data for objects in the central 250 kpc and those listed in table 1. Overlayed is the colour-magnitude relation found for RDCS1252.9-2927, another z=1.22 cluster, by Lidman et al. (2004). The colours of most of these galaxies are consistent with this relation, and following the arguments in Lidman et al. (2004) indicate that the galaxies have colours consistent with passive evolution, having formed the bulk of their stellar populations at higher redshift.
Figure 5 shows a similar colour-magnitude diagram for . This shows a tight relation between colour and magnitude for the confirmed cluster members and those in the central 250 kpc. Overplotted is the colour-magnitude relation from Lidman et al. (2004), shifted by 2.2 magnitudes (a reasonable shift for a z=1.22 elliptical). Most of the cluster members fall on this relation within their uncertainties. The tightness of the relation and the very red colours again indicates that the majority of these galaxies appear to have predominantly passively evolving stellar populations dominated by old stars with little significant ongoing star formation. For example, in figure 6 we plot the rest-frame spectral energy distribution of G5, the brightest galaxy in the central which has colours typical of other galaxies in the central region of the cluster. We overplot the best-fit instantaneous single burst, solar metallicity simple stellar population (SSP) synthesis model from Bruzual & Charlot (2003). This has an age of 3 Gyr, implying a redshift of formation of . However, metallicity and reddening can effect the inferred age of the best-fit to broad-band SEDs ( e.g. Lidman et al. 2004 and Bremer, Baker, & Lehnert 2002). We attempted to fit younger models reddened by a power law normalised to =0.1. Models as young as 1.5 Gyr gave reasonable fits given the uncertainties in the photometry. As found by other authors, e.g. Lidman et al. 2004, models with more extended, but exponentially-declining star formation episodes give comparable ages for the bulk of stars in the galaxies. As noted in section 2.2 and in figure 3, the absorption line spectra of the cluster members is well–matched by a Kinney et al. (1996) elliptical spectrum, again consistent with a substantial old population of stars. Clearly there is some star formation (or AGN) activity in at least one of the galaxies, given the presence of the [OII] 3727 line in the spectrum of G4. This may be due to emission from the galaxy itself, or contamination from another cluster member in the spectroscopic slit, possibly the object that is included in the IRAC aperture.
Where the colours of the galaxies indicate that they have relatively old stellar populations, their IRAC and band magnitudes indicate that these galaxies are already massive at . If they evolved passively to they would be approximately 1-1.3 magnitudes fainter in the rest-frame band (depending on the age of the galaxies at ). At , the 4.5µm band maps almost directly to the rest-frame . If the system was placed at the distance and look-back time of Coma, taking into account passive evolution, galaxy G5 would have (8.7 in Vega), within a few tenths of a magnitude of the value for NGC 4889 in Coma. Similarly, the tenth brightest galaxy in figure 4 is less than two magnitudes fainter than this, again comparable to the tenth brightest member in Coma (de Propris et al., 1998). In common with other recent studies (e.g. de Propris et al. 1999; Toft et al. 2004; Andreon et al. 2004), these results are consistent with a scenario where the more massive cluster galaxies are largely in place within a cluster at , subsequently evolving passively with no significant new star formation or substantial growth by mergers.
How do the properties of these cluster galaxies compare to those in other known clusters at similar redshifts? Lidman et al. (2004) and (Blakeslee et al., 2003) have carried out ground-based near IR and HST-based optical studies respectively of another z=1.2 cluster, RDCS J1252.9-2927. We have already shown that figure 4 is consistent with figure 2 in Lidman et al. (2004) – a similar colour-magnitude diagram based on SOFI data for that cluster. If we assume that the three brightest galaxies in the colour-magnitude sequence of RDCS J1252.9-2927 are the same as the three brightest in the sequence (Blakeslee et al., 2003), we infer similar colours for galaxies in that cluster as for the galaxies in XLSSC 046. Stanford et al. (1997) and Stanford et al. (2002) found similar colours for galaxies in the cluster RX J0848+4453 and the cluster around 3C210. All of these authors conclude that such colours are consistent with a high formation redshift for the stellar populations of the bulk of the identified bright/massive cluster galaxies and passive evolution thereafter.

Taking all of the above into account, our current data is consistent with most of the identified cluster galaxies at the centre of the system having dominant stellar populations at least 1.5 Gyr old, and possibly as old as 3 Gyr, having evolved passively after an initial burst or a short period of star formation. Their stellar masses are comparable to those of bright cluster ellipticals at low redshift, appearing to rule out significant growth by merger for these galaxies at lower redshifts. That is not to say that that other less massive galaxies within this cluster are not undergoing significant merger and star formation activity and can continue to do so, our band selection naturally selects the most massive galaxies at the observed epoch.
The spatial distribution of these galaxies appears more compact than in clusters of a similar redshift such as RX J0848+4453 (Stanford et al. 1997; Rosati et al. 1999) and RDCS J1252.9-2927 (Lidman et al., 2004). The surface density of sources brighter than in the central 30 ″of XLSSC 046 is per arcmin2, this compares to and per arcmin2 in the central 70 and 40 arcseconds of these two clusters, estimated from the colour magnitude diagrams in Rosati et al. (1999) and Lidman et al. (2004). The published images of these clusters do not show as sharp a drop in surface density of sources beyond 15 ″radius. However, it is unclear whether the cluster and its mass distribution is truely compact, or whether our current data only trace the distribution of the most massive galaxies within it. Deeper optical, near-IR and X-ray imaging is clearly required to determine the spatial distribution of matter within the cluster, as is further optical spectroscopy in order to probe its mass.
3.3 Detectability of high redshift clusters with combined XMM-LSS and SWIRE data
The availability of deep CFHTLS optical imaging data over much of the initial deg2 of the XMM-LSS area means that it is straightforward to identify groups and clusters of galaxies out to as extended X-ray sources associated with overdensities of faint galaxies with similar optical colours (e.g. Valtchanov et al. 2004; Willis et al. 2005). The same data can be used to identify clusters as galaxy overdensities at higher redshifts, but this becomes increasingly difficult at and potentially impossible at . So long as XMM sources can be reliably identified as extended, one can have confidence that the absense of an identification in deep optical data indicates that the source is likely to be a high redshift cluster. However, given typical clusters with luminosities around erg s-1will produce only a few tens of counts in typical XMM-LSS exposures, confirming that these sources are extended is challenging. Given the red colours of galaxies in cluster cores, a sufficiently deep ground-based near-IR or spaced-based Spitzer/IRAC survey which covers the same area of sky as XMM-LSS can potentially play the same role at the highest redshifts as the CFHTLS data does at . The clear detection of XLSSJ022303.0-043622 in the SWIRE data is therefore significant, as this survey covers much of the initial XMM-LSS area. A similar cluster at even higher redshift would have been detectable as an excess of galaxies in data as deep as that as SWIRE (e.g. the cluster detected by Stanford et al. (2005) would be detectable in IRAC data of comparable depth to that of SWIRE). Clusters out to discovered by X-ray emission in the XMM-LSS can therefore be photometrically confirmed by a combination of existing SWIRE/IRAC and CFHTLS data. A search for such clusters is now underway (Bremer et al., in prep.)

4 Conclusions
We have reported details of the discovery of the cluster XLSSJ022303.0-043622, presenting multiband imaging and initial spectroscopy of the system. We spectroscopically confirm seven galaxies with redshifts of within an arcminute of the X-ray position. The cluster appears to have a centrally-condensed galaxy distribution, with fifteen galaxies with within of the centre and only a further eight in an annulus between and from the centre. The spectroscopically-confirmed cluster members have the colours of passively evolving ellipticals indicating the bulk of their star formation occurred at least 1.5 Gyr before (i.e. at ). Based on their and IRAC magnitudes, they have stellar masses comparable with those of massive galaxies in clusters at low redshift, indicating that massive cluster galaxies may be in place at and passively evolve at lower redshift with little significant star formation or growth through mergers. The straightforward detectability of this cluster in Spitzer/IRAC data demonstrates that the combination of SWIRE and XMM-LSS datasets allow for efficient searches for the most distant clusters.
Acknowledgments
XMM is an ESA science mission with instruments and contributions directly funded by ESA Member States and NASA. This work was based on observations made with ESO Telescopes at the La Silla and Paranal Observatories under programme IDs 70.A-0733 and 074.A-0360 and with MegaPrime/MegaCam, a joint project of CFHT and CEA/DAPNIA, at the Canada-France-Hawaii Telescope (CFHT) which is operated by the National Research Council (NRC) of Canada, the Institut National des Science de l’Univers of the Centre National de la Recherche Scientifique (CNRS) of France, and the University of Hawaii. This work is based in part on data products produced at TERAPIX and the Canadian Astronomy Data Centre as part of the Canada-France-Hawaii Telescope Legacy Survey, a collaborative project of NRC and CNRS. Support for SWIRE, part of the Spitzer Space Telescope Legacy Science Program, was provided by NASA through an award issued by the Jet Propulsion Laboratory, California Institute of Technology under NASA contract 1407. This work was also supported by the European Community RTN Network POE (grant nr. HPRN-CT-2000-00138). MNB acknowledges Leverhulme Trust funding for the early part of this work. SA acknowledges financial contribution from contract ASI-INAF I/023/05/0. We thank Roberto de Propris for useful discussions.
References
- Andreon et al. (2005) Andreon S., Valtchanov I., Jones L. R., Altieri B., Bremer M., Willis J., Pierre M., Quintana H., 2005, MNRAS, 359, 1250
- Andreon et al. (2004) Andreon S., Willis J., Quintana H., Valtchanov I., Pierre M., Pacaud F., 2004, MNRAS, 353, 353
- Bertin & Arnouts (1996) Bertin E., Arnouts S., 1996, A&AS, 117, 393
- Blakeslee et al. (2003) Blakeslee J. P., et al., 2003, ApJ, 596, L143
- Böhringer et al. (2004) Böhringer H., et al., 2004, A&A, 425, 367
- Boulade et al. (2003) Boulade O., et al., 2003, SPIE, 4841, 72
- Bremer, Baker, & Lehnert (2002) Bremer M. N., Baker J. C., Lehnert M. D., 2002, MNRAS, 337, 470
- Bruzual & Charlot (2003) Bruzual G., Charlot S., 2003, MNRAS, 344, 1000
- de Propris et al. (1998) de Propris R., Eisenhardt P. R., Stanford S. A., Dickinson M., 1998, ApJ, 503, L45
- de Propris et al. (1999) de Propris R., Stanford S. A., Eisenhardt P. R., Dickinson M., Elston R., 1999, AJ, 118, 719
- Dickey & Lockman (1990) Dickey J.M., Lockman F.J., 1990, ARA&A, 28, 215
- Gioia et al. (1990) Gioia I. M., Henry J. P., Maccacaro T., Morris S. L., Stocke J. T., Wolter A., 1990, ApJ, 356, L35
- Grevesse & Sauval (1999) Grevesse N., Sauval A. J., 1999, A&A, 347, 348
- Kron (1980) Kron R. G., 1980, ApJS, 43, 305
- Le Fèvre et al. (2004) Le Fèvre O., Mellier Y., McCracken H.J., et al., 2004, A&A, 417, 839
- Hamuy et al. (1992) Hamuy M., Walker A. R., Suntzeff N. B., Gigoux P., Heathcote S. R., Phillips M. M., 1992, PASP, 104, 533
- Kinney et al. (1996) Kinney A. L., Calzetti D., Bohlin R. C., McQuade K., Storchi-Bergmann T., Schmitt H. R., 1996, ApJ, 467, 38
- Lidman et al. (2004) Lidman C., Rosati P., Demarco R., Nonino M., Mainieri V., Stanford S. A., Toft S., 2004, A&A, 416, 829
- Lonsdale et al. (2003) Lonsdale C., Smith G.H., Rowan-Robinson M., et al., 2003, PASP,115, 897
- Lonsdale et al. (2004) Lonsdale C., et al., 2004, ApJS, 154, 54
- McCracken et al. (2003) McCracken H.J., Radovich M., Bertin E., et al., 2003, A&A, 410, 17
- Mullis et al. (2003) Mullis C. R., et al., 2003, ApJ, 594, 154
- Mullis et al. (2005) Mullis C., Rosati P., Lamer G., et al., 2005, ApJ, 623, L85
- Pacaud et al. (2006) Pacaud et al., MNRAS submitted.
- Persson et al. (1998) Persson S. E., Murphy D. C., Krzeminski W., Roth M., Rieke M. J., 1998, AJ, 116, 2475
- Pierre et al. (2006) Pierre M. et al, MNRAS, submitted.
- Pierre et al. (2004) Pierre M., Valtchanov I., Altieri B., et al., 2004, JCAP, 9, 11
- Pratt & Arnaud (2002) Pratt G.W., Arnaud M., 2002, A&A, 394, 375
- Rosati, Borgani, & Norman (2002) Rosati P., Borgani S., Norman C., 2002, ARA&A, 40, 539
- Rosati et al. (1999) Rosati P., Stanford S. A., Eisenhardt P. R., Elston R., Spinrad H., Stern D., Dey A., 1999, AJ, 118, 76
- Schlegel, Finkbeiner, & Davis (1998) Schlegel D. J., Finkbeiner D. P., Davis M., 1998, ApJ, 500, 525
- Smith et al. (2001) Smith R. K., Brickhouse N. S., Liedahl D. A., Raymond J. C., 2001, ApJ, 556, L91
- Stanford et al. (1997) Stanford S. A., Elston R., Eisenhardt P. R., Spinrad H., Stern D., Dey A., 1997, AJ, 114, 2232
- Stanford et al. (2001) Stanford S. A., Holden B., Rosati P., Tozzi P., Borgani S., Eisenhardt P. R., Spinrad H., 2001, ApJ, 552, 504
- Stanford et al. (2002) Stanford S. A., Eisenhardt P. R., Dickinson M., Holden B. P., De Propris R., 2002, ApJS, 142, 153
- Stanford et al. (2005) Stanford S. A., et al., 2005, ApJ, 634, L129
- Stanford et al. (2006) Stanford S. A.et al., 2006, astro-ph/0606075
- Surace et al. (2005) Surace J. A., Shupe D. L., Fang F., Lonsdale C. J., Gonzalez-Solares E., et al., 2005, “The SWIRE Data Release 2: Image Atlases and Source Catalogs for ELAIS-N1, ELAIS-N2, XMM-LSS, and the Lockman Hole” Spitzer Science Center, California Institute of Technology
- Toft et al. (2004) Toft S., Mainieri V., Rosati P., Lidman C., Demarco R., Nonino M., Stanford S. A., 2004, A&A, 422, 29
- Tonry & Davis (1979) Tonry J., Davis M., 1979, AJ, 84, 1511
- Valtchanov et al. (2000) Valtchanov I., Gastaud R., Pierre M., Starck J.-L., 2000, In Clustering at High Redshift, ASP Conference Series, Vol. 200. Eds A. Mazure, O. Le Févre, and V. Le Brun
- Valtchanov et al. (2001) Valtchanov I., Pierre M., Gastaud R., 2001, A&A,
- Valtchanov et al. (2004) Valtchanov I., et al., 2004, A&A, 423, 75
- Vikhlinin et al. (1998) Vikhlinin A., McNamara B. R., Forman W., Jones C., Quintana H., Hornstrup A., 1998, ApJ, 502, 558
- Willis et al. (2005) Willis J., et al., 2005, MNRAS, 363, 675