Galaxies in front of Quasars:
Mrk 1456 and SDSS J114719.90+522923.2
Abstract
The chance projection of the disk of Mrk 1456 onto a background QSO is similar to the case of SBS 1543+593/HS 1543+5921. Mrk 1456 is a luminous, late-type spiral at . Though the QSO, SDSS J114719.90+522923.2 at , has not yet been observed with ultraviolet spectroscopy, it shows strong Ca II absorption at the redshift of Mrk 1456 which gives evidence that it is a possible Damped Lyman Alpha absorber. Spectroscopy of the star-forming nucleus of Mrk 1456 allows us to apply emission-line diagnostics to infer the chemical abundances at the center of the galaxy, and to make a prediction of the expected metallicity on the sightline to the QSO.
1 Introduction
The processes by which gas cools and collects into dark matter halos, to form stars and luminous galaxies, are topics of great interest in galaxy evolution studies. High column density gas clouds, traced through the Damped Lyman Alpha (DLA) absorption lines seen in the spectra of QSOs (see Wolfe et al., 2005), appear to be the main reservoir of cool, neutral gas in the Universe. They are also believed to evolve and form into typical, present-day, disk galaxies (Wolfe et al., 1986; Storrie-Lombardi et al., 1996; Kauffmann, 1996; Mo et al., 1998; Storrie-Lombardi & Wolfe, 2000; Cen et al., 2003).
DLAs have enabled us to follow the evolution of the bulk of the neutral gas in the Universe regardless of whether it emits light or not. For redshifts greater than about 1.6, the Lyman alpha line shifts into the optical, where, together with a range of diagnostic metal absorption lines, it can be observed with ground-based telescopes. DLAs have afforded us with information on the line-of-sight kinematic properties of the gas (Briggs et al., 1985; Prochaska & Wolfe, 1997), its element abundances, (Lu et al., 1996; Pettini et al., 1997; Prochaska et al., 2003), and star-formation rates (Wolfe et al., 2003). The derived gas properties are, in some respects, similar to those found in giant spirals in the local Universe, while in others, they resemble more closely those of local dwarfs. Unfortunately, we know almost nothing about the galaxies in which this gas resides. The column density of atoms cm-2, that defines a DLA system (Wolfe et al., 1986), has physical significance because it is typical of the threshold column density for the onset of star formation (Kennicutt, 1998). Accordingly, DLAs should be associated with visible galaxies, the so-called DLA galaxies. Yet the detection of DLA galaxies has proven difficult at all redshifts, and the host-galaxy nature of the DLAs and their evolution with redshift remains an open question (Haehnelt et al., 1998; Cen et al., 2003; Nagamine et al., 2004a, b).
At high redshifts, the detection of a DLA galaxy is difficult because of the brightness of the QSO and the small angular separation between the QSO and the galaxy (c.f. Wolfe et al., 2005). While over 600 DLAs with are available for follow-up observation (Wolfe et al., 2005), only eight DLA galaxies have been detected in emission (Pettini et al., 1995; Møller et al., 2002; Weatherley et al., 2005). The DLA galaxies exhibit a range of regular and irregular morphologies, which is perhaps not a surprise considering that the galaxies’ images are in the rest-frame ultraviolet (Møller et al., 2002). Similar morphologies are seen among the Lyman Break Galaxies (LBG) (Møller et al., 2002), a class of high-redshift galaxies selected by their emission properties (Steidel & Hamiltion, 1992). At present, the relationship between the absorption-selected DLA galaxies and the emission-selected LBGs remains to be determined (Colbert & Malkan, 2002; Møller et al., 2002).
While DLA galaxies should be more easily detected at low redshifts, follow-up searches for the visible counterparts of DLAs have not been entirely successful either. There are many fewer DLAs available to study at lower redshifts, because the interception probability per unit redshift at low-z is reduced, and because the Lyman alpha line can only be observed using the scarce resource of space telescopes (Wolfe et al., 2005). Of the 24 DLA systems known at redshifts below 1.6, only about half have had the corresponding DLA galaxy identified. Less than half of those turn out to be luminous spiral galaxies with the remaining detections (as well as the non-detections) being interpreted as low surface brightness galaxies or dwarf galaxies (Le Brun et al., 1997; Chen & Lanzetta, 2003; Rao et al., 2003). It should be noted that a potential bias against finding luminous spiral galaxies among low-z DLAs may have arisen from the very fact that DLAs have traditionally been selected by targeting bright QSOs (Wolfe et al., 2005), which, historically, have been identified based on their stellar-like appearance on sky survey plates (e.g., Schmidt & Green, 1983; Hazard, 1991; Hewitt & Burbidge, 1993; Véron-Cetty & Véron, 2003).
An obvious approach to uncover the connection between the DLAs and the galaxies in which they reside, is to search for DLA lines that known low redshift galaxies cause in the spectra of more distant QSOs. This is not a new idea (see e.g., Burbidge et al., 1971; Bowen et al., 1991), but an idea that we revived given the vast numbers of low-redshift galaxies and of QSOs found in the Sloan Digital Sky Survey (SDSS, York et al., 2000). This methodology to search for DLAs based on a visible galaxy clearly has its own biases. Specifically, since the SDSS main galaxy sample is magnitude limited (Strauss et al., 2002), our selection favors the detection of giant over dwarf DLA galaxies and in that respect, may be considered complementary to the traditional selection method. To this end, we correlated the SDSS DR4 QSO catalog (Schneider et al., 2005) with the DR4 main galaxy catalog (Strauss et al., 2002) and inspected the resulting galaxy-QSO matches. We reduced this list by considering only those galaxy-QSO pairs for which (a) the impact parameters are smaller than the galaxy’s Petrosian radius, (b) SDSS spectra are available for both the galaxy and the QSO, (c) (QSO)(galaxy), (d) the QSO’s spectrum exhibits a strong CaII doublet at the redshift of the foreground galaxy (Cherinka et al., 2007). Thus we identified the luminous spiral galaxy Mrk 1456 and its background QSO.
Mrk 1456 (=SBS1144+527A=SDSS J114720.20+522918.6, ) is located in front of the QSO SDSS J114719.90+522923.2 (). The QSO sightline intercepts the galaxy within its stellar disk. This chance projection of a background QSO with a galaxy at low redshift is reminiscent of the galaxy-QSO pair SBS 1543+593/HS 1543+5921 discovered by Reimers & Hagen (1998). SBS 1543+593 is the only DLA galaxy which has been studied in detail in emission as well as in absorption (Bowen et al., 2005; Schulte-Ladbeck et al., 2004, 2005). Before Reimers & Hagen (1998) pronounced the object a galaxy-QSO pair, SBS 1543+593 was thought to be a Seyfert galaxy with the QSO constituting its active nucleus. In an interesting parallel, Takase & Miyauchi-Isobe (1984) list Mrk 1456 as an ultraviolet-excess galaxy with a “double nucleus”. SBS 1543+593 turned out to be a DLA when Hubble Space Telescope (HST) was trained on HS 1543+5921 for follow-up ultraviolet spectroscopy (Bowen et al., 2001).
Here, we present an analysis of photometry and spectroscopy of Mrk 1456, and show that it is a giant spiral with an oxygen abundance that is typical of its luminosity. We also examine the QSO’s spectrum for absorption lines from the foreground galaxy, and, based on the strength of the CaII K line, find that Mrk 1456 is a candidate DLA system. We discuss our findings in the context of chemical abundances for star-forming galaxies (SFG) and DLAs, and make suggestions for future observations.
2 The Data
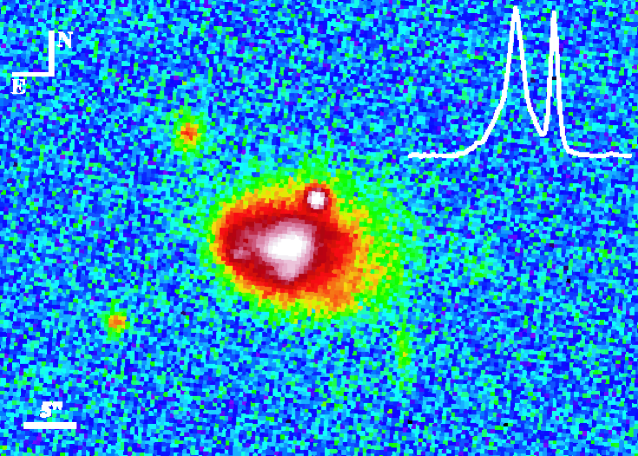
For both, the QSO and the galaxy, we use the pipeline reduced and flux-calibrated data from the SDSS. Photometric and spectroscopic data are available for both objects. The fibers were placed on the center of the galaxy and on the QSO (see also Fig. 1). The QSO sightline intercepts the disk of the galaxy at a separation of 5.3 arcsec from its center or at a physical distance of 4.9 kpc (, , and ). The QSO is in the background at a redshift of while the redshift of Mrk 1456 is . The spectra, shown in Fig. 2, cover the wavelength range from 3815 Å to 9205 Å, i.e. the rest-wavelength range of the spectrum of Mrk 1456 is 3640 Å to 8785 Å and for the QSO 1276 Å to 3079 Å.
The measurements of the emission line fluxes were performed by fitting Gaussians to the lines. The errors in the fluxes due to photon noise were estimated using the error spectrum provided by SDSS and assuming Poisson statistics. The error in the continuum placement was taken to be one third of the mean noise of the continuum in the spectral region around the measured lines. The total error for each line measurement was determined by error propagation. For H, H, and H, the line fitting included the underlying stellar absorption. For the H line, the absorption was swamped by emission, therefore we adopted the correction method recommended by Hopkins et al. (2003), for SDSS spectra, to calculate the line flux. The upper limits for undetected lines were calculated from the SDSS error spectrum.
We note that all spectroscopically derived parameters of the galaxy pertain to the area surrounding its nucleus enclosed by the 3 arcsec diameter fiber, which, at the distance of Mrk 1456, encompasses an area of .
Figure 3 shows the calcium absorption lines caused by the galaxy in the spectrum of the QSO. The equivalent widths (EW) and width errors were measured by smoothing the spectrum with a boxcar of 3 pixels prior to the application of the line-fitting procedure outlined above.
3 Galaxy morphology, luminosity and size
Mrk 1456 has an angular r-band Petrosian radius of 7.70.2 arcsec (or a physical radius of 7.00.2 kpc). We used the code of Blanton et al. (2003) to k-correct the ugriz observations. They were subsequently corrected for foreground and internal absorption. Foreground reddening, mag, and absorption, mag, were determined from the maps of Schlegel et al. (1998). For the internal absorption correction, we assumed the absorption derived for the nuclear region using the Balmer lines (see next section) applies to the entire galaxy. Using the color transformations of Smith et al. (2002), we find . This makes Mrk 1456 a giant, rather than a dwarf (M) galaxy (Binggeli et al., 1985). We derive when using (Marinoni et al., 1999).
Upon visual inspection of the images and spectrum of Mrk 1456, we find that it resembles a spiral galaxy. By employing the criteria established in Kewley et al. (2001) to our measurements of the diagnostic line ratios of [OIII]/H, [NII]/H, [SII]/H, and [OI]/H, we conclude that Mrk 1456 is a SFG, rather than an AGN. The comparison of the spectrum with the templates from Kennicutt (1992) suggests that it is a spiral of Sc subtype. The inverse concentration index in the r band (0.45), together with the extinction-corrected Petrosian ugriz colors, place Mrk 1456 among the Sc galaxies (Strateva et al., 2001; Shimasaku et al., 2001). Mrk 1456 was observed in the Two Micron All Sky Survey (2MASS). Following Girardi et al. (2003), its B-K color is consistent with the Sc subtype.
The following data allow us to address the inclination of the disk of Mrk 1456. The minor-to-major axis ratio in the r band resulting from an exponential fit to the profile is 0.7240.007. In the K band, this axis ratio is 0.720. Both, r and K, measure the light from the underlying older stellar population in the disk of Mrk 1456. Assuming an axis ratio of 0.72 and following Tully & Fisher (1977), we derive an inclination of 45o for Mrk 1456.
4 Reddening and starformation rate
The reddening of QSO spectra caused by intervening galaxies was investigated by Östman et al. (2006). They noted that Mrk 1456 and its QSO as one of two very low- cases in their sample. They determine that is close to the average Milky Way value of .
The flux ratio (see Tab. 1) is larger than the case B recombination value of 2.86 for the “standard” cm-3 and K HII region density and temperature (Osterbrock, 1989). From this Balmer-line ratio and using the reddening law of Cardelli et al. (1989) we derive mag, mag, and mag assuming .
Using Kennicutt (1998), we calculate a nuclear star-formation rate (SFR) of M⊙/yr from the H luminosity (corrected for stellar absorption and foreground and internal dust absorption).
Following Hopkins et al. (2003) we find the global SFR from the Petrosian u-band magnitude, .
4.1 Oxygen abundance from spectral line indices
We use the index proposed by Pettini & Pagel (2004), , together with their empirical calibration to the observed data (their Eq. 3), to calculate the oxygen abundance. We derive an oxygen abundance of (where the first error denotes our measurement error and the second error is the systematic error of the calibration).
Using the solar abundance of Holweger (2001), , we derive a solar-relative abundance of 111We will use the following notation: , denotes abundance in the neutral gas phase and denotes the abundance in the ionized gas phase. for the nucleus of Mrk 1456.
This value is confirmed by using the index together with Eq. 2 of Pettini & Pagel (2004). We derive or .
For further comparison, the R23 method (McGaugh, 1991; Kobulnicky et al., 1999a), which is calibrated on photoionization models, yields or a solar oxygen abundance.
In summary, all three methods indicate a solar metallicity for the nucleus of Mrk 1456. This is in agreement with the observation of Shi et al. (2005) that the mean offsets between these three calibrators are of the same order as their systematic errors.
4.2 Electron Density and Temperature
We use the IRAF/STSDAS package nebular (Shaw & Dufour, 1995) with the task temden to calculate the electron density () and temperature () for the emission line spectrum. Some lines are so weak that we can only measure an upper limit for the flux (see Tab. 1). As a consequence, we can only determine the lower limit of the electron density and the upper limit of the electron temperature. First we assume an effective temperature of 10000 K and calculate using the line ratio. Using that , we derive an upper limit for the temperature using the and ratios. After two iterations we derive a lower limit for cm-2 and an upper limit for the K.
We can also apply a reverse approach by assuming that the oxygen abundance derived by the strong line indices is the true oxygen abundance. Adding Eq. 3 and Eq. 5 of Izotov et al. (2006) for the abundances of the two ionization states O+ and O2+ and assuming , we derived a temperature of K, when using and an electron density of cm-2. This is consistent with the upper limit derived above. In the following we will use this electron density and temperature.
4.3 Sulfur and Nitrogen Abundances
Following Izotov et al. (2006), we calculate the abundances of , , and and the corresponding ionization correction factors (ICFs) from the emission line measurements given in Tab. 1. For sulfur we derive and . The . This leads to or using the solar sulfur abundance of (Grevesse & Sauval, 1998).
For nitrogen we calculate and an . The total nitrogen abundance . With a solar abundance of (Holweger, 2001) we derive . The nitrogen over oxygen abundance is .
5 Abundances on the line of sight to the QSO
The QSO SDSS J114719.90+522923.2 intercepts the disk of Mrk 1456 at a distance that is smaller than its optical radius. We searched for absorption lines of Ca H&K and Na ID in the spectrum (3 Å resolution) and detected the Ca H&K lines (see Fig. 3). The redshifts for Ca II K and for Ca II H are for each line. This compares well with the emission-line derived redshift of for Mrk 1456 from the SDSS database.
The measured rest equivalent widths are Å and Å, respectively. Using the curve of growth method and the oscillator strength of Morton (2003) we derive using both lines.
6 Discussion
The characteristics of Mrk 1456 are interesting as it is both a star-forming galaxy and a quasar absorption-line system. Here, we discuss these characteristics and compare them to SBS 1543+593, the only other DLA for which detailed studies of its emission and absorption properties have been carried out.
6.1 Mrk 1456 as a star-forming galaxy
Mrk 1456 is a SFG with the morphology of a late spiral. The SFR in the nucleus of Mrk 1456 is M⊙ yr-1 kpc-2, while its global SFR is M⊙ yr-1 kpc-2. The young stellar populations clearly dominate in the nucleus of Mrk 1456. Indeed, according to the definition of Balzano (1983), we may consider Mrk 1456 a starburst nuclear galaxy. Mrk 1456 has also been classed a starburst nucleus by Stepanian (2005).
Starburst nuclear galaxies show ionized gas in their inner regions which is characterized by low excitation, Contini et al. (2002), and a resulting high metallicity, Coziol et al. (1999). A comparison with the data of Contini et al. (2002) (shifted to our cosmology) shows that the nuclear O/H and N/O ratios of Mrk 1456 are typical of a starburst galaxy nucleus of its luminosity. Its N/O ratio is typical of its O/H ratio (Shi et al., 2005). Since Mrk 1456 is an SDSS galaxy, it is expected to lie on the Tremonti et al. (2004) metallicity-luminosity relation. Figure 4 of Tremonti et al. illustrates the metallicity-luminosity distribution of SDSS galaxies and the differences in metallicity-luminosity calibrations that originate from choosing other galaxy samples. Mrk 1456 has a low metallicity for its luminosity, but lies, of course, within the SDSS galaxy distribution. Mrk 1456 appears to lie closer to the Contini et al. (2002) metallicity-luminosity relation for UV-selected and HII galaxies rather than on the SDSS relation. A possible interpretation is that Mrk 1456 is shifted to a brighter magnitude for its metallicity compared to normal spirals owing to the low M/L ratio of its newly formed stellar populations (Contini et al., 2002).
Our abundance measurements reflect the nuclear abundances only; we do not have data in hand that would allow us to infer global abundances. Because spiral galaxies are known to exhibit radial abundance gradients with a negative slope that is particularly steep in late subtypes, Vila-Costas & Edmunds (1992), our values are expected to overestimate the global abundances of Mrk 1456, Kewley et al. (2005). The exact gradient applicable to the case of Mrk 1456 can only be determined with future, long-slit spectroscopy.
6.2 Mrk 1456 as a QSO absorber and candidate DLA
Studies of sightlines to QSOs enable us to probe the ISM of intervening galaxies. This technique has been exploited to help us better understand the ISM within our Galaxy (e.g., Lauroesch et al., 1996; Savage et al., 2000).
We detected CaII absorption in the spectrum of the QSO SDSS J114719.90+522923.2 at the wavelengths at which we expect them for Mrk 1456. This establishes Mrk 1456 as a CaII absorber.
Two properties strongly suggest that Mrk 1456 is also a DLA galaxy, namely, its strong CaII K line and the small distance of the QSO from the center of the galaxy.
Wild et al. (2006) have investigated calcium absorption line systems on the sightline of QSOs. They conclude that systems with Å are a subset of the DLA population. For Mrk 1456, we measure a Ca K line of Å. Thus, Mrk 1456 is highly likely to be DLA galaxy on accounts of the strength of the Ca absorption. Wild et al. surmise that the regions giving rise to strong CaII absorption lines in galaxies are small, 7-8 h-1 kpc. The impact parameter of SDSS J114719.90+522923.2 is 4.9 kpc, consistent with this inference.
In their recent review, Wolfe et al. (2005) summarized the HI properties of spiral galaxies. The column densities decrease from cm-2 in the center to cm-2 at about where is the Holmberg radius defined as the semi-major axis of the isophote in the B-band. We used the SDSS measured values for the semi-major axis of the isophote and the gradient along the major axis in the g-band in order to estimate the Holmberg radius for Mrk 1546. We find that the Holmberg radius is approximately 7.3 arcsec. Since the sightline to the QSO is only 5.3 arcsec from the center of the galaxy, the column density should exceed the defining DLA column density, and we may expect that Mrk 1456 is a DLA galaxy.
We also used the SFR calculated from the H luminosity to estimate the nuclear HI column density of Mrk 1456 using Eq. 6 from Lanzetta et al. (2002) (which is the Schmidt law from Kennicutt 1998 but without the dust correction). Accordingly, the central column density is estimated to be cm-2.
It is interesting to note that Rao et al. (2003) studied 14 DLA galaxies with redshifts between 0.05 and 1, and found that low-luminosity galaxies at small impact parameters dominate their sample. Being an galaxy, Mrk 1456 adds a possible data point at the high-luminosity end of the luminosity distribution of DLA galaxies. Rao et al. also draw attention to the fact that the highest column densities are observed in the galaxies with the lowest luminosities, which they attribute to a possible selection bias, such that bright galaxies with high column densities at small impact parameters are missing from the sample. They suggest that this could happen because the background QSO is dimmed too much by reddening when seen through the disk of a luminous galaxy.
An alternate explanation for the existence of a bias against luminous DLA galaxies may instead come about due to the fact that sightlines to QSOs that pass through disks of nearby and thus, extended foreground galaxies, have historically been missed because a standard cut that has been applied in the assemblage of pre-SDSS quasar catalogs has been that the object must appear stellar.
Our predication that Mrk 1456 is a DLA galaxy can be tested with ultraviolet spectroscopy of the QSO at the wavelength of the Lyman line, or with 21-cm emission mapping of the galaxy.
6.3 Comparison of Mrk 1456 and SBS 1543+593
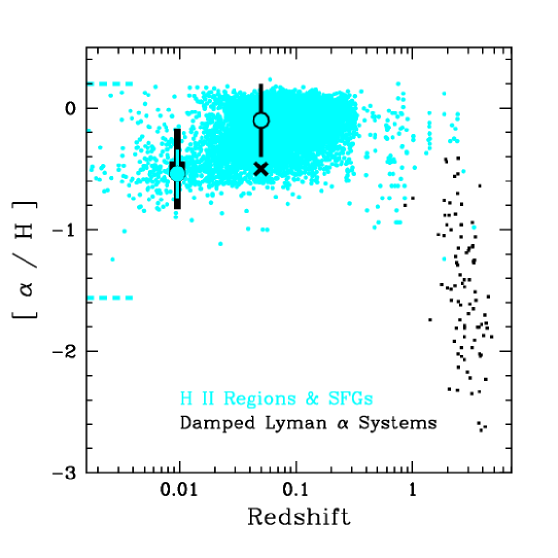
The chemical enrichment of the ISM of galaxies is a critical indicator of galaxy evolution. In Fig. 4 we show with black squares, the [O/H]I, [S/H]I, and [Si/H]I ratios from the compilation of DLA metallicities by Prochaska et al. (2003), which represent our knowledge of /H ratios in the neutral gas at high redshift.
In order to connect the metallicities of DLAs with those of luminous galaxies, we show with bright dots, [O/H]II ratios for high-redshift emission-line galaxies. The data are from Hoyos et al. (2005), Shapley et al. (2004), Steidel et al. (2004), Koo et al. (1994), Kobulnicky & Zaritsky (1999b), Lemoine-Busserolle et al. (2003), Rigopoulou et al. (2000), Maier et al. (2004), Maier et al. (2005), Contini et al. (2002), Cardiel et al. (2003), Teplitz et al. (2000), and Villar-Martín et al. (2004), and cover the redshift range from about 0.3 to 3. If these authors used the method or the Pettini & Pagel (2004) method to calculate O/H ratios, we used their values. Otherwise, to be consistent, we recalculated the O/H ratios from the original data using the Pettini & Pagel (2004) method, because different metallicity calibrations may yield different abundances (e.g., Shi et al., 2005).
In order to extend the O/H ratios to low redshifts, we use the metallicities for SDSS HII-regions and SFGs galaxies from Schulte-Ladbeck et al. (2005), also calculated using the Pettini & Pagel method. In the local Universe, oxygen abundances have been determined using the direct or method. I Zw 18 is the local galaxy with the lowest oxygen abundance on record, (Izotov & Tuan, 1999). The local H II region with the highest known oxygen abundance, , resides in NGC 1232 (Castellanos, Díaz & Terlevich, 2002). These boundaries on the metallicities are indicated by dashed lines.
Overplotted with a large square at a redshift of about 0.01, is the absorption-derived [S/H]I abundance of SBS 1543+593 (Schulte-Ladbeck et al., 2005). On top of that is found the emission-derived [O/H]II abundance calculated using Pettini & Pagel (2004), indicated by a bright circle. The two measurements agree.
The emission-line derived nuclear [O/H]II ratio of Mrk 1456 is shown as the large dot at a redshift of about 0.05. Because Mrk 1456 is much more luminous than SBS 1543+593, its oxygen abundance is higher than that of SBS 1543+594, and similar to that of other luminous SDSS galaxies at redshift 0.05. We do not know the absorption-derived abundance of Mrk 1456 because it has not been measured with ultraviolet spectroscopy. However, we can make some inferences based on its emission-line derived abundance.
We have interpreted SBS 1543+593 as the “proof of concept”, showing that emission- and absorption-derived measurements in principle do yield consistent abundances of elements in the ISM of external galaxies (Schulte-Ladbeck et al., 2005). Based on this result, we predict that the element abundances for Mrk 1456 measured from absorption-line spectroscopy, will give the same result as its emission-line derived one.
In what follows, we consider that the value may actually turn out to be lower, because the emission-line derived O/H ratios of spiral galaxies decrease with radius and because the QSO sightline intercepts the galaxy at 70% of its radius.
Local dwarf galaxies, in which multiple HII region abundances as a function of radius have been measured, appear to exhibit flat abundance gradients (Kobulnicky & Skillman, 1997). SBS 1435+593 is a dwarf galaxy. The sightline to the QSO intercepts the disk of SBS 1543+593 about 2.4 arcsec (or kpc) to the N of the center of the galaxy. The HII region which was used to gauge the ionized gas-phase abundance, on the other hand, is located 14.7 arcsec (or 2.9 kpc) to the S of the galaxy’s center. Despite their different galacticentric distances, the two abundances agree, as expected based on our current knowledge of abundance gradients in dwarfs.
In contrast, local giant galaxies, in which multiple HII region abundances as a function of radius have been measured, appear to exhibit negative abundance gradients (e.g. Vila-Costas & Edmunds, 1992; Ferguson et al., 1998; Kewley et al., 2005, and references therein). In the case of Mrk 1456, the impact parameter of the QSO is 4.9 kpc. If we extrapolate the nuclear oxygen abundance of Mrk 1546 using the metallicity gradient of Ferguson et al. (1998), dex/kpc, we predict an oxygen abundance of on the sightline of the QSO. This abundance is indicated by an x on Fig. 4. Doing the same for nitrogen over oxygen (average abundance gradient of dex/kpc) we estimate on the QSO sightline.
Interestingly, the O/H ratio for the neutral ISM of the giant spiral Mrk 1456, estimated under the assumption of a steep radial abundance gradient, is very similar to the one we observe in the dwarf spiral SBS 1543+594. This would seem to support the conclusions reached by Chen et al. (2005) that low-redshift DLA galaxies are drawn from the typical field population and not from a separate population of low-surface-brightness dwarfs, and that their low metallicities may arise naturally as a combination of gas cross section selection, which favors large radii, and metallicity gradients.
We note that neither the abundance gradients of dwarf galaxies, nor those of spiral galaxies, have yet been probed with absorption-line spectroscopy. Only future ultraviolet spectroscopy can tell us the true absorption-line derived element abundance on the sightline to SDSS J114719.90+522923.2.
7 Conclusion
Mrk 1456 is an spiral galaxy with a starburst nucleus. The emission-line spectrum of the nucleus yields a SFR of about 0.7 M⊙/yr. The oxygen abundance in the warm ISM of Mrk 1456 is about solar, consistent with its luminosity. We predict that the oxygen (or sulfur) abundance in the ISM on the sightline to SDSS J114719.90+522923.2 is either approximately solar, based on our observations of the SBS 1543+593-HS 1543+5921 galaxy-QSO pair, or it may be only about solar if the galaxy exhibits a radial abundance gradient similar to that of local spirals. Future ultraviolet spectroscopy is needed to test these predictions.
The sightline to the background QSO SDSS J114719.90+522923.2 intercepts the disk of Mrk 1456 within its Holmberg radius. Detection of the CaII H&K lines in the QSO’s spectrum designates the galaxy a CaII absorber. The small impact parameter of the QSO’s sightline, 4.9 kpc, as well as the strength of the CaII K absorption establish Mrk 1456 as an extremely likely candidate for a DLA galaxy. This prediction can be tested with future ultraviolet spectroscopy or with 21-cm mapping. Once proven to be a DLA galaxy, Mrk 1456 will make an interesting, high-luminosity addition to the very small sample of low-redshift DLA galaxies (Chen et al., 2005; Rao et al., 2003).
We thank Alex Fiedler, Andrew Hopkins, Simon Krughoff, Ryan Scranton and Ramin Scribba for the helpful discussions. Funding for the Sloan Digital Sky Survey (SDSS) has been provided by the Alfred P. Sloan Foundation, the Participating Institutions, the National Aeronautics and Space Administration, the National Science Foundation, the U.S. Department of Energy, the Japanese Monbukagakusho, and the Max Planck Society. The SDSS Web site is http://www.sdss.org/. The SDSS is managed by the Astrophysical Research Consortium (ARC) for the Participating Institutions. The Participating Institutions are The University of Chicago, Fermilab, the Institute for Advanced Study, the Japan Participation Group, The Johns Hopkins University, the Korean Scientist Group, Los Alamos National Laboratory, the Max-Planck-Institute for Astronomy (MPIA), the Max-Planck-Institute for Astrophysics (MPA), New Mexico State University, University of Pittsburgh, University of Portsmouth, Princeton University, the United States Naval Observatory, and the University of Washington. This research has made use of the NASA/IPAC Extragalactic Database (NED) which is operated by the Jet Propulsion Laboratory, California Institute of Technology, under contract with the National Aeronautics and Space Administration. This publication makes use of data products from the Two Micron All Sky Survey (2MASS), which is a joint project of the University of Massachusetts and the Infrared Processing and Analysis Center/California Institute of Technology, funded by the National Aeronautics and Space Administration and the National Science Foundation.
References
- Balzano (1983) Balzano, V. A. 1983, ApJ, 268, 602
- Binggeli et al. (1985) Binggeli, B., Sandage, A., & Tammann, G. A. 1985, AJ, 90, 1681
- Blanton et al. (2003) Blanton, M. R., et al. 2003, AJ, 125, 2348
- Bowen et al. (1991) Bowen, D. V., Pettini, M., Penston, M. V., & Blades, C. 1991, MNRAS, 249, 145
- Bowen et al. (2001) Bowen, D. V., Tripp, T. M., & Jenkins, E. B. 2001, AJ, 121, 1456
- Bowen et al. (2005) Bowen, D. V., Jenkins, E. B., Pettini, M., & Tripp, T. M. 2005, ApJ, 635, 880
- Briggs et al. (1985) Briggs, F. H., Wolfe, A. M., Turnshek, D. A., & Schaeffer, J. 1985, ApJ, 293, 387
- Burbidge et al. (1971) Burbidge, E. M., Burbidge, G. R., Solomon, P. M., & Strittmatter, P. A. 1971, ApJ, 170, 233
- Calzetti et al. (2000) Calzetti, D., Armus, L., Bohlin, R. C., Kinney, A. L., Koornneef, J., & Storchi-Bergmann, T. 2000, ApJ, 533, 682
- Cardelli et al. (1989) Cardelli, J. A., Clayton, G. C., & Mathis, J. S. 1989, ApJ, 345, 245
- Cardiel et al. (2003) Cardiel, N., Elbaz, D., Schiavon, R. P., Willmer, C. N. A., Koo, D. C., Phillips, A. C., Gallego, J. 2003, ApJ, 584, 76
- Castellanos, Díaz & Terlevich (2002) Castellanos, M., Díaz, A. I., & Terlevich, E. 2002, MNRAS, 329, 315
- Cen et al. (2003) Cen, R., Ostriker, J. P., Prochaska, J. X., & Wolfe, A. M. 2003, ApJ, 598, 741
- Chen & Lanzetta (2003) Chen, H.-W., & Lanzetta, K. M. 2003, ApJ, 597, 706
- Chen et al. (2005) Chen, H.-W., Kennicutt, R. C., & Rauch, M. 2005, ApJ, 620, 703
- Cherinka et al. (2007) Cherinka, B., et al. 2007, in prep.
- Colbert & Malkan (2002) Colbert, J. W., & Malkan, M. A. 2002, ApJ, 566, 51
- Contini et al. (2002) Contini, T., Treyer, M. A., Sullivan, M., Ellis, R. S. 2002, MNRAS, 330, 75
- Coziol et al. (1999) Coziol, R., Reyes, R. E. Carlos, Consid’ere, S., Davoust, E., Contini, T., A&A, 345, 733
- Denicoló et al. (2002) Denicoló, G., Terlevich, R., & Terlevich, E. 2002, MNRAS, 330, 69
- Ferguson et al. (1998) Ferguson, A. M. N., Gallagher, J. S., & Wyse, R. F. G. 1998, AJ, 116, 673
- Girardi et al. (2003) Girardi, M., Mardirossian, F., Marinoni, C., Mezetti, M., & Rigoni, E., A&A, 410, 461
- Grevesse & Sauval (1998) Grevesse, N., & Sauval, A. J. 1998, Space Science Reviews, 85, 161
- Haehnelt et al. (1998) Haehnelt, M. G., Steinmetz, M., & Rauch, M. 1998, ApJ, 495, 647
- Hazard (1991) Hazard, C. 1991, ASP Conf. Ser. 21: The Space Distribution of Quasars, 21, 170
- Hewitt & Burbidge (1993) Hewitt, A., & Burbidge, G. 1993, ApJS, 87, 451
- Holweger (2001) Holweger, H. 2001, AIP Conf. Proc. 598: Joint SOHO/ACE workshop ”Solar and Galactic Composition”, 598, 23
- Hopkins et al. (2003) Hopkins, A. M., et al. 2003, ApJ, 599, 971
- Hoyos et al. (2005) Hoyos, C., Koo, D. C., Phillips, A. C., Willmer, C. N. A., & Guhathakurta, P. 2005, ApJ, 635, L21
- Izotov & Tuan (1999) Izotov, Y. I., & Thuan, T. X. 1999, ApJ, 511, 639
- Izotov et al. (2006) Izotov, Y. I., Stasińska, G., Meynet, G., Guseva, N. G., & Thuan, T. X. 2006, A&A, 448, 955
- Kauffmann (1996) Kauffmann, G. 1996, MNRAS, 281, 475
- Kennicutt (1992) Kennicutt, R. C., Jr. 1992, ApJS, 79, 255
- Kennicutt (1998) Kennicutt, R. C. 1998, ARA&A, 36, 189
- Kewley et al. (2001) Kewley, L. J., Heisler, C. A., Dopita, M. A., & Lumsden, S. 2001, ApJS, 132, 37
- Kewley et al. (2005) Kewley, L. J., Jansen, R. A., & Geller, M. J. 2005, PASP, 117, 227
- Kobulnicky & Skillman (1997) Kobulnicky, H. A., & Skillman, E. D. 1997, ApJ, 489, 636
- Kobulnicky et al. (1999a) Kobulnicky, H. A., Kennicutt, R. C., Jr., & Pizagno, J. L. 1999a, ApJ, 514, 544
- Kobulnicky & Zaritsky (1999b) Kobulnicky, H. A., & Zaritsky, D. 1999b, ApJ, 511, 118
- Koo et al. (1994) Koo, D. C., Bershady, M. A., Wirth, G. D., Stanford, S. A., Majewski, S. R. 1994, ApJL, 427, L9
- Lanzetta et al. (2002) Lanzetta, K. M., Yahata, N., Pascarelle, S., Chen, H.-W., & Fernández-Soto, A. 2002, ApJ, 570, 492
- Lauroesch et al. (1996) Lauroesch, J. T., Truran, J. W., Welty, D. E., & York, D. G. 1996, PASP, 108, 641
- Lebouteiller et al. (2004) Lebouteiller, V., Kunth, D., Lequeux, J., Lecavelier des Etangs, A., Désert, J.-M., Hébrard, G., Vidal-Madjar, A. 2004, A & A, 415, 55
- Le Brun et al. (1997) Le Brun, V., Bergeron, J., Boisse, P., & Deharveng, J. M. 1997, A&A, 321, 733
- Lemoine-Busserolle et al. (2003) Lemoine-Busserolle, M., Contini, T., Pelló, R., Le Borgne, J.-F., Kneib, J.-P., Lidman, C. 2003, A&A, 397, 839
- Lu et al. (1996) Lu, L., Sargent, W. L. W., Barlow, T. A., Churchill, C. W., & Vogt, S. S. 1996, ApJS, 107, 475
- Maier et al. (2004) Maier, C., Meisenheimer, K., & Hippelein, H. 2004, A&A, 418, 475
- Maier et al. (2005) Maier, C., Lilly, S. J., Carollo, C. M., Stockton, A., & Brodwin, M. 2005, ApJ, 634, 849
- Marinoni et al. (1999) Marinoni, C., Monaco, P., Giuricin, G., & Costantini, B. 1999, ApJ, 521, 50
- McGaugh (1991) McGaugh, S. S. 1991, ApJ, 380, 140
- Miller et al. (1999) Miller, E.D., Knezek, P.A., Bregman, J.N. 1999, ApJ, 510, 95
- Mo et al. (1998) Mo, H. J., Mao, S., & White, S. D. M. 1998, MNRAS, 295, 319
- Møller et al. (2002) Møller, P., Warren, S. J., Fall, S. M., Fynbo, J. U., & Jakobsen, P. 2002, ApJ, 574, 51
- Morton (2003) Morton, D. C. 2003, ApJS, 149, 205
- Nagamine et al. (2004a) Nagamine, K., Springel, V., & Hernquist, L. 2004a, MNRAS, 348, 435
- Nagamine et al. (2004b) Nagamine, K., Springel, V., & Hernquist, L. 2004b, MNRAS, 348, 421
- Osterbrock (1989) Osterbrock, D. E. 1989, Research supported by the University of California, John Simon Guggenheim Memorial Foundation, University of Minnesota, et al. Mill Valley, CA, University Science Books, 1989, 422 p.
- Östman et al. (2006) Östman,L., & Goodbar, A., Mörtsell, E., 2006, astroph/0509904
- Pagel et al. (1979) Pagel, B. E. J., Edmunds, M. G., Blackwell, D. E., Chun, M. S., & Smith, G. 1979, MNRAS, 189, 95
- Pettini et al. (1995) Pettini, M., Hunstead, R. W., King, D. L., & Smith, L. J. 1995, QSO Absorption Lines, Proceedings of the ESO Workshop Held at Garching, Germany, 21 - 24 November 1994, edited by Georges Meylan. Springer-Verlag Berlin Heidelberg New York. Also ESO Astrophysics Symposia, 1995., p.55, 55
- Pettini et al. (1997) Pettini, M., Smith, L. J., King, D. L., & Hunstead, R. W. 1997, ApJ, 486, 665
- Pettini & Pagel (2004) Pettini, M., & Pagel, B. E. J. 2004, MNRAS, 348, L59
- Pettini et al. (2002) Pettini, M., Ellison, S. L., Bergeron, J., & Petitjean, P. 2002, A&A, 391, 21
- Pettini & Pagel (2004) Pettini, M., & Pagel, B. E. J. 2004, MNRAS, 348, L59
- Prochaska & Wolfe (1997) Prochaska, J. X., & Wolfe, A. M. 1997, ApJ, 487, 73
- Prochaska et al. (2003) Prochaska, J. X., Gawiser, E., Wolfe, A. M., Castro, S., Djorgovski, S. G. 2003, ApJL, 595, L9
- Rao et al. (2003) Rao, S. M., Nestor, D. B., Turnshek, D. A., Lane, W. M., Monier, E. M., & Bergeron, J. 2003, ApJ, 595, 94
- Rao (2005) Rao, S. M. 2005, IAU Colloq. 199: Probing Galaxies through Quasar Absorption Lines, 125
- Reimers & Hagen (1998) Reimers, D., & Hagen, H.-J. 1998, A&A, 329, L25
- Rigopoulou et al. (2000) Rigopoulou, D., et al. 2000, ApJL, 537, L85
- Savage et al. (2000) Savage, B. D., et al. 2000, ApJS, 129, 563
- Schlegel et al. (1998) Schlegel, D. J., Finkbeiner, D. P., & Davis, M. 1998, ApJ, 500, 525
- Schmidt & Green (1983) Schmidt, M., & Green, R. F. 1983, ApJ, 269, 352
- Schneider et al. (2005) Schneider, D. P., et al. 2005, AJ, 130, 367
- Schulte-Ladbeck et al. (2005) Schulte-Ladbeck, R. E., König, B., Miller, C. J., Hopkins, A. M., Drozdovsky, I. O., Turnshek, D. A., & Hopp, U. 2005, ApJ, 625, L79
- Schulte-Ladbeck et al. (2004) Schulte-Ladbeck, R. E., Rao, S. M., Drozdovsky, I. O., Turnshek, D. A., Nestor, D. B., & Pettini, M. 2004, ApJ, 600, 613
- Shapley et al. (2004) Shapley, A. E., Erb, D. K., Pettini, M., Steidel, C. C., Adelberger, K. L. 2004, ApJ, 612, 108
- Shaw & Dufour (1995) Shaw, R. A., & Dufour, R. J. 1995, PASP, 107, 896
- Shi et al. (2005) Shi, F., Kong, X., Li, C., & Cheng, F. Z. 2005, A&A, 437, 849
- Shimasaku et al. (2001) Shimasaku, K., et al. 2001, AJ, 122, 1238
- Smith et al. (2002) Smith, J. A., et al. 2002, AJ, 123, 2121
- Stasińska (2002) Stasińska, G. 2002, astro-ph/0207500
- Steidel & Hamiltion (1992) Steidel, C. C., & Hamilton, D. 1992, AJ, 104, 941
- Steidel et al. (2004) Steidel, C. C., Shapley, A. E., Pettini, M., Adelberger, K. L., Erb, D. K., Reddy, N. A., Hunt, M. P. 2004, ApJ, 604, 534
- Stepanian (2005) Stepanian, J. A. 2005, Revista Mexicana de Astronomia y Astrofisica, 41, 155
- Storrie-Lombardi et al. (1996) Storrie-Lombardi, L. J., McMahon, R. G., & Irwin, M. J. 1996, MNRAS, 283, L79
- Storrie-Lombardi & Wolfe (2000) Storrie-Lombardi, L. J., & Wolfe, A. M. 2000, ApJ, 543, 552
- Strateva et al. (2001) Strateva, I., et al. 2001, AJ, 122, 1861
- Strauss et al. (2002) Strauss, M. A., et al. 2002, AJ, 124, 1810
- Takase & Miyauchi-Isobe (1984) Takase, B., & Miyauchi-Isobe, N. 1984, Annals of the Tokyo Astronomical Observatory, 19, 595
- Teplitz et al. (2000) Teplitz, H. I., et al. 2000, ApJL, 533, L65
- Tremonti et al. (2004) Tremonti, C. A., et al. 2004, ApJ, 613, 898
- Tully & Fisher (1977) Tully, R. B., & Fisher, J. R. 1977, A&A, 54, 661
- Véron-Cetty & Véron (2003) Véron-Cetty, M.-P., & Véron, P. 2003, A&A, 412, 399
- Vila-Costas & Edmunds (1992) Vila-Costas, M. B., Edmunds, M. G. 1992, MNRAS, 251, 121
- Villar-Martín et al. (2004) Villar-Martín, M., Cerviño, M., & González Delgado, R. M. 2004, MNRAS, 355, 1132
- Weatherley et al. (2005) Weatherley, S. J., Warren, S. J., Møller, P., Fall, S. M., Fynbo, J. U., & Croom, S. M. 2005, MNRAS, 358, 985
- Wild et al. (2006) Wild, V., Hewett, P. C., & Pettini, M. 2006, MNRAS, 164
- Wolfe et al. (1986) Wolfe, A. M., Turnshek, D. A., Smith, H. E., & Cohen, R. D. 1986, ApJS, 61, 249
- Wolfe et al. (1995) Wolfe, A. M., Lanzetta, K. M., Foltz, C. B., & Chaffee, F. H. 1995, ApJ, 454, 698
- Wolfe et al. (2003) Wolfe, A. M., Prochaska, J. X., & Gawiser, E. 2003, ApJ, 593, 215
- Wolfe et al. (2005) Wolfe, A. M., Gawiser, E., & Prochaska, J. X. 2005, ARA&A, 43, 861
- York et al. (2000) York, D. G., et al. 2000, AJ, 120, 1579


| Species | measured | dereddened | Remark | |
|---|---|---|---|---|
| Flux | Luminosity | |||
| [Å] | ||||
| 3728 | ||||
| 4068 | ||||
| 4076 | ||||
| H | 4101 | [1] | ||
| H | 4341 | [1] | ||
| 4363 | ||||
| H | 4862 | [1] | ||
| 4959 | ||||
| 5007 | ||||
| HeI | 5877 | [2] | ||
| 6300 | ||||
| 6312 | ||||
| 6548 | [3] | |||
| H | 6563 | [4] | ||
| 6584 | ||||
| 6718 | [5] | |||
| 6732 | [5] | |||
| 7320 | ||||
| 7330 |
[1] abs.+em. deblended with 2 Gaussians, [2] near abs. line, [3] 3
em. lines deblended,
[4] and H abs. corrected, [5] deblended with a Gaussian