The secondary star and distance of the polar V1309 Ori††thanks: Based on observations obtained under run ID 01BK6 at the Canada-France-Hawaii Telescope (CFHT) which is operated by the National Research Council of Canada, the Institut National des Sciences de l’Univers of the Centre National de la Recherche Scientifique of France, and the University of Hawaii.
Abstract
Context. The first phase-resolved JHK light curves of the eclipsing polar (AM Herculis binary) V1309 Ori are presented and interpreted.
Aims. We separate the contributions from the secondary star and from other sources with the aim of determining a photometric distance.
Methods. Simple model calculations show that the accretion stream and the cyclotron source on the accreting white dwarf are minor contributors to the infrared light, allowing an accurate determination of spectral type and absolute flux of the secondary star.
Results. The unilluminated backside of the secondary star as seen in eclipse has spectral type dM0 to dM0+. Its dereddened magnitude is at orbital phase (eclipse). Using the calibrated surface brightness of M-stars and the published mass of the secondary, , we obtain a distance pc which scales as . The radius of the Roche-lobe filling secondary exceeds the main-sequence radius of an M0 star by %.
Conclusions. The debated origin of the infrared light of V1309 Ori has been settled in favor of the secondary star as the main contributor and an accurate distance has been derived that will place estimates of the luminosity and synchronization time scale on a more secure basis.
Key Words.:
Stars: binaries: eclipsing – Stars: cataclysmic variables – Stars: distances – Stars: late-type – Stars: magnetic fields – Stars: individual (V1309 Ori)1 Introduction
The soft X-ray source RX J0515.6+0105 was discovered in the ROSAT All-Sky-Survey (Beuermann & Thomas 1993), quickly identified as an eclipsing polar (or AM Herculis binary) (Garnavich et al. 1994; Shafter et al. 1995; Walter et al. 1995), and named V1309 Ori. It turned out to be a key object for studies of the synchronization of polars because of its long orbital period of 7.98 h, twice as long as that of any other polar, and the implied larger separation of the components. At the same time, the magnetic field strength of about 60 MG (Garnavich et al. 1994; Shafter et al. 1995) and the accretion rate of (Beuermann & Burwitz 1995; Harrop-Allin et al. 1997; Schwarz et al. 2005) are within the ranges typical of long-period polars. Luminosity-based estimates of the accretion rate depend sensitively on the bolometric correction, the mass of the primary, and on the assumed distance. Published distances of V1309 Ori differ considerably, ranging from about 500 pc (Garnavich et al. 1994; Staude et al. 2001) to greater than 1500 pc (Harrop-Allin et al. 1997). The synchronization of a polar requires that the magnetostatic torque between the assumed magnetic dipole moments of the two stars in the system overcomes the accretion torque on the white dwarf (King et al. 1994; Wu et al. 1994), with the latter depending directly on the accretion rate. The parameters derived so far place V1309 Ori near the limit of being synchronized and measuring its luminosity and mass transfer rate is important for understanding the physics of polars in general.
In this paper, we derive an accurate distance from the brightness of the secondary in V1309 Ori. This result is based on our previous calibration of the surface brightness of M-dwarfs in standard and non-standard photometric bands (Beuermann 2000) and will place estimates of the luminosity, accretion rate, and synchronization time scale on a more secure basis.
2 Observations and Data Analysis
V1309 Ori was observed with the CFHT-IR camera at the CFHT 3.6-m telescope on Mauna Kea, Hawaii, for 6.7 hours on 26/27 October 2001. During the observations, the star was in its normal bright state. The filters employed were J, H, K’, and K. Almost complete phase coverage was obtained with a gap only near orbital phase , where indicates the center of the eclipse for the ephemeris of Staude et al. (2001). Five 15 sec exposures taken in dithering mode in a single filter were averaged to yield an individual data point. Exposures in J, H, and K were obtained consecutively and the sequence repeated in turn, leading to a time resolution of 13 min. Variability on shorter time scales is lost and only in this sense are the observations in the three bands quasi-simultaneous and not truly simultaneous. UKIRT faint standards FS 150, 152, 153, and SA 92-342 were observed as standard stars and the results reduced into the standard Mauna Kea infrared system (Tokunaga & Vacca 2005). We interprete these data in combination with our earlier BVRI photometry and low resolution optical spectrophotometry (Shafter et al. 1995) and the photometry of Katajainen et al. (2003).
3 Light curves
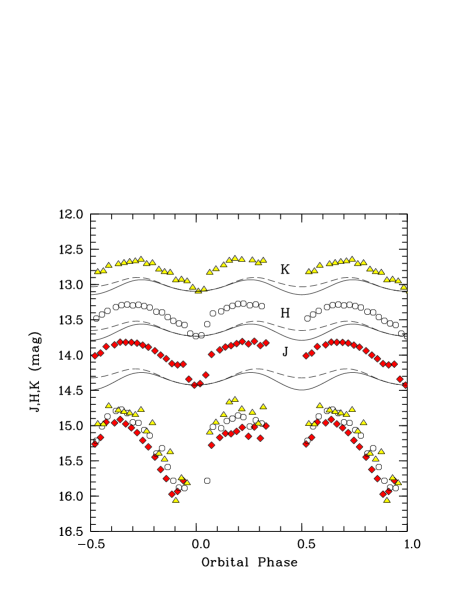
Figure 1 shows the light curves of V1309 Ori in the bands J, H, and K folded over the orbital period of 7.98 h using the ephemeris of Staude et al. (2001). They display a quasi-sinusoidal modulation with the eclipse superimposed. The depth of the eclipse is 0.31 mag, 0.20 mag, and 0.15 mag in J, H, and K, respectively, much less than in the optical where it reaches 2.1 mag in B and nearly 4 mag in U (Shafter et al. 1995; Katajainen et al. 2003). The light outside eclipse arises from the accretion stream and and the cyclotron source in the accretion spot on the white dwarf. This combined source evidently still contributes in the infrared, although much less than in the optical. Given our low time resolution, we can not measure ingress and egress times of the eclipsed source. Our data, however, are consistent with the eclipse being total for a time interval similar to that observed in the optical ( min).
At first glance, the double-humped structure of the light curve seems to suggest that we see the ellipsoidal light modulation of the secondary star. However, that is refuted by the phasing of the primary eclipse and the finite eclipse depth. Many polars (and non-magnetic CVs) contain light sources which mimic the ellipsoidal modulation. In the case of polars, this can be the accretion stream which contributes maximum flux when seen sideways and reaches a minimum when the plane of the accreting field line crosses the line of sight. In V1309 Ori, this is the case at . A double-humped light source can also originate from cyclotron beaming and the varying flux level as the angle between the accreting field line at the white dwarf and the line of sight varies. We find that the maxima at and are of nearly equal height in the infrared, while the maximum is the dominant one in the optical. The available results combined suggest that the light curves are shaped by the varying geometrical aspect, mutual occultation of the stream by itself or the stream and the secondary star, and wavelength-dependent illumination by the soft X-ray and cyclotron sources on the white dwarf. We refrain from modeling the light curves in detail.
We wish to derive the spectral energy distributions (SED) inside and outside eclipse and, for this purpose, we have to model the ellipsoidal light modulation of the secondary star. We assume that the eclipse is total (Schmidt & Stockman 2001; Staude et al. 2001) and that the flux observed at eclipse center arises from the backside hemisphere of the secondary, i.e. the one opposite to the L1 point. We calculate the ellipsoidal light curves using Nightfall111http://www.hs.uni-hamburg.de/DE/Ins/Per/Wichmann/Nightfall.html. This program uses the Roche geometry, the limb darkening coefficients of Claret (1998), and the gravity darkening coefficients of Claret (2000) that describe the transition from high-temperature radiative stars to low-temperature convective stars. It allows the use of Hauschildt’s model atmospheres for non-irradiated stars, but for a simple application including irradiation one fares better with the blackbody approximation. We have adjusted the resulting ellipsoidal light curves at and show them both, for the case of vanishing irradiation (solid curves) and for irradiation by a source at the location of the white dwarf with a luminosity of erg cm-2s-1 (dashed curves). This luminosity corresponds to the rather high accretion rate of . The influence of irradiation is seen to be moderate in the infrared, while the minimum at nearly vanishes in the optical for the parameters chosen here. We obtain the SEDs at and at by combining our infrared photometry with the our earlier BVRI photometry, our 3600-9140Å spectrophotometry (Shafter et al. 1995), and the photometry of Katajainen et al. (2003).
| Band | V1309 Ori | M0 | M1 |
|---|---|---|---|
| 17.22 | 17.17 | 17.40 | |
| 15.42 | 15.43 | 15.48 | |
| 14.39 | 14.37 | 14.28 | |
| 13.71 | 13.76 | 13.67 | |
| 13.58 | 13.61 | 13.49 |
4 Spectral energy distributions
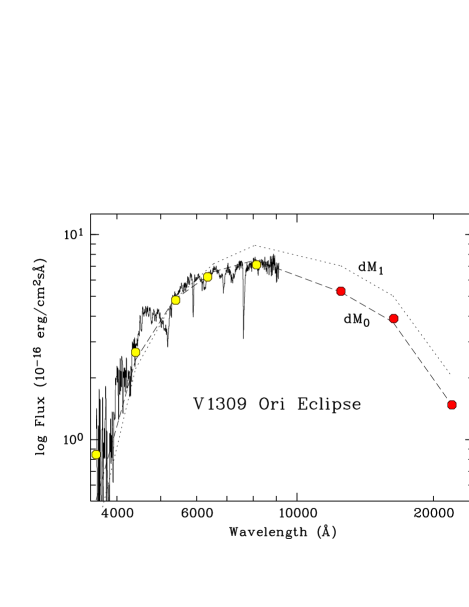
Figure 2 shows the SED at , dereddened with (Schmidt & Stockman 2001). The Shafter et al. spectrophotometry in eclipse is slightly adjusted by a quadratic function in wavelength to fit the BVRI photometry from the same reference. The data point for the U-band is from Katajainen et al. (2003). The SED is characterized by a color (see Tab. 1). This value closely resembles that of a dwarf of spectral type M0 to M0+. The M0 SED is shown as a dashed line in Fig. 2 that is adjusted to the observed VIJHK data points and is seen to fit extremely well. The SED of an M1 dwarf (dotted line) is clearly too red. In the U-band, an excess of the photometry over the M0 SED may exist and possibly also a slight excess in B. A possible cause is an atmospheric structure of the secondary star in V1309 Ori which differs slightly from that of a field star, even on the non-irradiated hemisphere. Alternatively, a 2% leak from the bright phase spectrum would also explain the UB excess, but the weak emission lines expected in that case are not visible in eclipse. Furthermore, the Hubble Space Telescope phase-resolved ultraviolet spectroscopy (Schmidt & Stockman 2001; Staude et al. 2001) and the model calculations of Katajainen et al. (2003) suggest that the eclipse of the accretion stream is total. No deviation from the SED of an M0 to M0+ star beyond the mag scatter is seen for all bands from V to K. The excellent agreement confirms that the infrared flux observed in eclipse represents the secondary star.
The SED for , with the contribution from the secondary star (dashed line labeled ‘Sec’) subtracted, is shown in Fig. 3. The dereddened Shafter et al. spectrophotometry is shown but not adjusted to the photometry in this case. Although the optical and infrared observations are not simultaneous, an internally consistent distribution emerges which falls off with wavelength approximately as . The secondary star is obviously the dominant source in the infrared, while the other sources dominate in UBVR and both contribute equally in the I band. The secondary contributes 3/4 of the observed flux in K which clearly contradicts the claim by Harrop-Allin et al. (1997) of a contribution of only 20%. These authors based their statement on the lack of detectable spectroscopic M-star features in their infrared spectrum. Although we have no spectral resolution in the infrared, we consider our conclusion on the SED of the secondary star firm and suggest instead that the Harrop-Allin et al. infrared spectrum, which was taken around , is affected by irradiation of the secondary star and may differ from that of a field star.
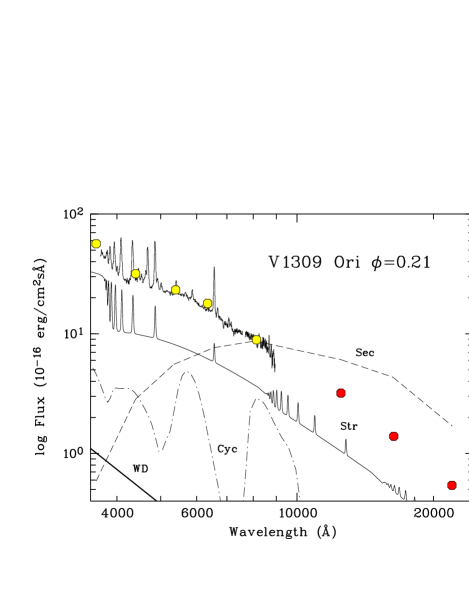
Although we do not embark on a complete modeling of the SED, we comment semi-quantitatively on the two main contributing light sources. The Shafter et al. spectrophotometry at this phase shows the Balmer and the Paschen jumps in emission along with the appropriate emission lines suggesting a temperature around 10000–20000 K. Our heuristic model consists of two main contributions to the observed SED. As solid curve labeled ‘Str’, we show the emission from an isothermal hydrogen plasma at a temperature of 15000 K with two subcomponents of different density and geometrical extent: the first subcomponent has a particle density of cm-3, a depth of cm-2, unity relative projected area, and represents the outer accretion stream; the second subcomponent has a particle density of cm-3, a depth of cm-2, a relative projected area of 0.35, and represents the inner accretion stream a factor of two in radius closer to the white dwarf. Stark broadening is included and the resolution of the resulting spectrum adjusted to the 35Å FWHM resolution of the spectrophotometry. Only the sum of the two subcomponents is shown with an arbitrary normalization. This spectrum fits the shape of the observed optical spectrum reasonably well and is seen to fall off in the infrared with a similar slope as the observed SED. As the dot-dashed curve labeled ‘Cyc’, we show the cyclotron emission from an isothermal plasma with a temperature of 5 keV in a magnetic field of 63 MG for a combination of two depth parameters, log which yields a largely optically thick spectrum, and log which accounts for the optically thin emission lines. The latter fits the two faint and broad bumps at about 5800Å and 8500Å reported by Shafter et al. (1995) that represent the second and third cyclotron harmonics in a field of 63 MG. Our model spectrum demonstrates that the fourth harmonic near 4300Å is already weak in the log spectrum, while the first harmonic at 1.7m is largely optically thick (and off the scale). Hence, we do not expect to observe more than the two detected cyclotron harmonics. The high density of the accretion stream at the white dwarf deposits much of the accretion energy at sub-photospheric levels (Walter et al. 1995; Schwarz et al. 2005) and explains why cyclotron line emission and polarization are weak (Garnavich et al. 1994; Shafter et al. 1995; Buckley & Shafter 1995). The observed overall SED is quite well reproduced by a linear combination . The white dwarf represents a minor contribution as shown by the thick line labeled ‘WD’ which is based on the upper limit to the white dwarf contribution as derived by Staude et al. (2001). A quantitative model could be constructed along these lines, but the optical-depth effects are substantial and one may expect a sizeable fraction of the stream emission to fall in the EUV (Lyman jump in emission), where no observations exist. It is doubtful, therefore, whether convincing results for the bolometric luminosity and the accretion rate can be obtained this way; we do not attempt it here.
5 Distance of V1309 Ori
We determine the distance to V1309 Ori by the surface brightness method (Barnes & Evans 1976; Bailey 1981; Ramseyer 1994; Beuermann et al. 1999; Beuermann 2000) which connects the distance , the stellar radius , the surface brightness at wavelength , and the dereddened observed flux by the inverse square law
| (1) |
This relation is often quoted with the surface brightness and the flux expressed in magnitudes ( and ) as
| (2) |
Using a sample of main sequence stars with appropriate metalicity, the or for different photometric bands have been calibrated as functions of color or spectral type (Beuermann et al. 1999; Beuermann 2000, 2006). The distance is found to be proportional to the stellar radius of the secondary star which is given by Roche geometry.
Staude et al. (2001) quote the mass range of the secondary in V1309 Ori as 0.4–0.6 , with a most probable value of . The radius of the Roche-lobe filling secondary scales as and is nearly independent of the white dwarf mass. The appropriate projected area is that of the Roche lobe as seen at at an inclination of (Staude et al. 2001). The corresponding effective mean radius is . We use Eq. (2) with and for (Beuermann 2000) to obtain pc. If there is some blue excess in the SED of the secondary it might be more appropriate to use larger by 0.10 and and which yields pc. The statistical and systematic errors in the measurement of and the calibration of of about 0.05 each lead to a 4% error in . We settle on pc, where the second error refers to the full range of from Staude et al. (2001). Instead of and , we might have used any other photometric band from to . The results would be similar because the secondary corresponds so closely to the SED of an M0 to M0+ field star. The error, however, is smallest in because has the largest lever arm and the shallowest slope of all surface brightness vs. color relations. As an additional example, we quote the result for the narrow-band surface brightness at 7500Å which was also calibrated by Beuermann (2000). From the SED in Fig. 2 one finds a dereddened flux erg cm-2s-1Å-1. With erg cm-2s-1Å-1 (Beuermann 2000) for a star of spectral type M0 to M0+, Eq. (1) yields pc with a slightly larger error than above222The distance of 745 pc quoted by Beuermann (2000) did not include dereddening and was based on an a slightly different calibration of ..
Our result is in excellent agreement with the distance obtained from the comparison of the brightness of the secondary star in V1309 Ori with that of the mean component of the binary YY Gem which yields 625 pc (Staude et al. 2001, corrected to the Hipparcos distance of YY Gem by Schwarz et al. 2005). The much larger distance suggested by Harrop-Allin et al. (1997), pc, based on the assignment of 80% of the -band flux to the accretion stream, can be excluded.
The distance modulus to V1309 Ori is and with a average magnitude of the unheated secondary of , its absolute -band magnitude would be , where the errors refer to the full range of secondary masses of 0.4 to 0.6 , with 0.46 the nominal mass. A dM0+ main sequence star of near-solar metalicity has and a radius given by log(/) = –0.22 (Beuermann et al. 1998, 1999), while the volume radius of the Roche-lobe filling secondary in V1309 Ori is cm with log(/) = . Hence, we find that the Roche-lobe filling secondary is expanded over a main sequence star of the same spectral type by %, as noted first by (Garnavich et al. 1994). This oversize may indicate moderate nuclear evolution. On the other hand, the secondary in V471 Tau which does not fill its Roche lobe has a radius 18% larger than a main sequence K-star, probably because a substantial fraction of its surface is covered by star spots (O’Brien et al. 2001). Activity may, therefore, be an alternative cause for the observed inflation of the secondary in V1309 Ori. A measurement of the metal abundances supplemented by evolutionary modeling may possibly distinguish between the two possibilities.
6 Conclusions
We have presented the first phase-resolved infrared photometry of V1309 Ori and deduced the spectral energy distributions (SED) of the secondary star and of the additional light sources outside eclipse for the 3600–22000 Å range. The secondary is of spectral type M0 to M0+ and contributes 75% of the light in the -band. We derive a distance of 600 pc from its -band magnitude. The SED at orbital phase can be plausibly explained as the superposition of emission from the accretion stream and the cyclotron source on the white dwarf.
Acknowledgements.
This research was supported by the Korea Astronomy Observatory and Space Science Institute Research Fund 2002 and by the Deutsches Zentrum für Luft- und Raumfahrt e.V. (DLR) under grant 50 OR 99 03 6. We are deeply indebted to Y.-B. Jeon for generous support of our observing proposal within the KAO-CFHT collaboration. We thank Boris T. Gänsicke for providing his program to calculate the emission from a hydrogen plasma and Frederic V. Hessman for comments on the manuscript.References
- Bailey (1981) Bailey, J. 1981, MNRAS, 197, 31
- Barnes & Evans (1976) Barnes T.G., Evans D.S. 1976, MNRAS, 174, 489
- Beuermann (2000) Beuermann, K. 2000, New Astr. Rev., 44, 93
- Beuermann (2006) Beuermann, K. 2006, A&A, submitted
- Beuermann et al. (1998) Beuermann K., Baraffe I., Kolb, U., Weichhold, M. 1998, A&A, 339, 518
- Beuermann et al. (1999) Beuermann K., Baraffe I., Hauschildt, P. 1999, A&A, 348, 524
- Beuermann & Burwitz (1995) Beuermann, K., & Burwitz, V. 1995, ASP Conf. Ser., 85, 99
- Beuermann & Thomas (1993) Beuermann, K., & Thomas, H. C. 1993, Adv. Space Res. 13(12), 115
- Buckley & Shafter (1995) Buckley, D. A. H., & Shafter, A. W. 1995, MNRAS, 275, L61
- O’Brien et al. (2001) O’Brien, M. S., Bond, H. E., & Sion, E. M. 2001, ApJ, 563, 971
- Claret (1998) Claret, A. 1998, A&AS, 131, 395
- Claret (2000) Claret, A. 2000, A&A, 359, 289
- Garnavich et al. (1994) Garnavich, P. M., Szkody, P., Robb, R. M., Zurek, D. R., & Hoard, D. W. 1994, ApJ, 435, L141
- Harrop-Allin et al. (1997) Harrop-Allin, M. K., Cropper, M., Potter, S. B., Dhillon, V. S., & Howell, S. B. 1997, MNRAS, 288, 1033
- Katajainen et al. (2003) Katajainen, S., Piirola, V., Ramsay, G., et al. 2003, MNRAS, 340, 1
- King et al. (1994) King, A. R., Kolb, U., de Kool, M., & Ritter, H. 1994, MNRAS, 269, 907
- Ramseyer (1994) Ramseyer, T. F. 1994, ApJ, 425, 243
- Schmidt & Stockman (2001) Schmidt, G. D., & Stockman, H. S. 2001, ApJ, 548, 410
- Schwarz et al. (2005) Schwarz, R., Reinsch, K., Beuermann, K., & Burwitz, V. 2005, A&A, 442, 271
- Shafter et al. (1995) Shafter, A. W., Reinsch, K., Beuermann, K. et al. 1995, ApJ, 443, 319
- Staude et al. (2001) Staude, A., Schwope, A. D., & Schwarz, R. 2005, A&A, 374, 588
- Tokunaga & Vacca (2005) Tokunaga, A. T., & Vacca, W. D. 2005, PASP, 117, 421
- Walter et al. (1995) Walter, F. M., Wolk, S. J., & Adams, N. R. 1995, ApJ, 440, 834
- Wu et al. (1994) Wu, K., Wickramasinghe, D. T., Bailey, J., Tennant, A. F. 1994, PASA, 11, 198