Interferometric Mapping of Magnetic Fields: G30.79 FIR 10
Abstract
We present polarization maps of G30.79 FIR 10 (in W43) from thermal dust emission at 1.3 mm and from CO J= line emission. The observations were obtained using the Berkeley-Illinois-Maryland Association array in the period 2002-2004. The G30.79 FIR 10 region shows an ordered polarization pattern in dust emission, which suggests an hourglass shape for the magnetic field. Only marginal detections for line polarization were made from this region. Application of the Chandrashkar-Fermi method yielded mG and a statistically corrected mass to magnetic flux ratio , or essentially critical.
1 Introduction
The star formation process involves a number of physical parameters, of which the magnetic field is the least observed. Magnetic field observations are divided into measurements of the Zeeman effect (in order to obtain the magnetic field strength in the line of sight), and linear polarization observations of dust and spectral-line emission. Polarization of dust emission is believed to be perpendicular to the magnetic field under most conditions (Lazarian, 2003); hence, polarization of dust emission has been used as a major probe for the magnetic field geometry. In order to efficiently map the polarization of dust emission and infer information about the magnetic field morphology, high resolution observations are required. The BIMA millimeter interferometer has been used previously to obtain high-resolution polarization maps in several star forming cores (Rao et al., 1998; Girart et al., 1999; Lai, 1999; Lai et al., 2002, 2003). These results show fairly uniform polarization morphologies over the main continuum sources, suggesting that magnetic fields are strong, and therefore cannot be ignored by star formation theory. However, the number of star formation regions with maps of magnetic fields remains small, and every new result is significant.
Spectral line linear polarization has been suggested to arise from molecular clouds under anisotropy conditions (Goldreich & Kylafis, 1981). The prediction suggests that a few percent of linearly polarized radiation should be detected from molecular clouds and circumstellar envelopes in the presence of a magnetic field. It is also predicted that the molecular line polarization will be either parallel or perpendicular to the magnetic field, depending on the angles between the line of sight, the magnetic field, and the anisotropic excitation direction (Goldreich & Kylafis, 1982). This process is known as the Goldreich - Kylafis effect.
In order to use these techniques, we mapped the massive star forming region G30.79 FIR 10 with the BIMA array. We measured continuum polarization at 1.3 mm and CO line polarization obtaining high resolution interferometric maps for both measurements.
The remainder of this paper is divided in five major sections. Section 2 reviews information about the source, section 3 describes the observation procedure. Section 4 presents the results, section 5 gives the discussion, and section 6 the conclusions and summary.
2 Source Description
G30.79 is a large dust continuum source located within the W 43 region, which is an H II region-molecular cloud complex near . We observed G30.79 FIR 10, which is a massive and dense component in the G30.79 complex. Liszt (1995) observed G30.79 in HCO+ and 13CO, concluding that the presence of several rings and shells in the dense molecular gas was a disturbance product of star formation. Vallée & Bastien (2000) observed the dust continuum emission in this source at 760 m with the JCMT telescope. They found linear polarization of about 1.9% with a position angle (P.A.) of 160∘ at FIR 10. Mooney et al. (1995) also observed this source at 1.3 mm using the IRAM 30-meter antenna, detecting a total flux of 13.6 Jy; their wide field map shows FIR 10 and the extended H II region in the G30.79 complex. H2O masers have also been observed toward this region (Cesaroni et al., 1988) that are within a half arcsecond of the peak in the Mooney et al. (1995) map and might be a signature of massive star formation. No centimeter radio-continuum emission seems to be associated with FIR 10, which suggests that the source is in an early stage of evolution. Motte et al. (2003) mapped the W43 main complex in dust continuum emission at 1.3 mm and 350 with the IRAM 30-m telescope and the CSO, respectively. They also mapped the HCO+ line and measured H13CO+ towards prominent dust maxima. One of the maxima, W43-MM1, is the compact fragment we mapped with BIMA. Motte et al. (2003) found v km s-1, km s-1 (from H13CO+), T K, M M☉, and cm-3. They estimated the virial mass to be M M☉, suggesting that this compact fragment should be in a state of gravitational collapse unless there are other sources of support than kinetic energy. The W43 region, is therefore, an excellent region for the study of the earliest stages of massive star formation.
3 Observation Procedure
We observed G30.79 FIR 10 between October 2002 to May 2004, mapping the continuum emission at 1.3 mm and the CO molecular line (at 230 GHz); four tracks with the BIMA array in C configuration were obtained. We set the digital correlator in mode 8 to observe both the continuum and the CO line simultaneously. The 750 MHz lower side band was combined with 700 MHz from the upper side band to map the continuum emission, leaving a 50 MHz window for the CO line observation (at a resolution of 1.02 km s-1). Each BIMA telescope has a single receiver, and thus the two polarizations were observed sequentially. A quarter wave plate to select either right (R) or left (L) circular polarization was alternately switched into the signal path ahead of the receiver. Switching between polarizations was sufficiently rapid (every 11.5 seconds) to give essentially identical uv-coverage. Cross-correlating the R and L circularly polarized signals from the sky gave RR, LL, LR, and RL for each interferometer baseline, from which maps in the four Stokes parameters were produced. The source 1743-038 was used as phase calibrator for G30.79 FIR 10. The instrumental polarization was calibrated by observing 3C279, and the “leakages” solutions were calculated from this observation. We used the same calibration procedure described by Lai (1999).
The Stokes images I, U, Q and V were obtained by Fourier transforming the visibility data using natural weighting. The MIRIAD (Sault et al., 1995) package was used for data reduction. G30.79 FIR 10 is close to the equator; therefore, we expect strong sidelobes in the beam pattern. We followed Chernin & Welch (1995), who observed NGC2071IR (also a source close to the equator) with the BIMA array, and imaged only out to 20′′ radius, due to the strong sidelobes.
4 Observational Results
4.1 1.3 mm Continuum
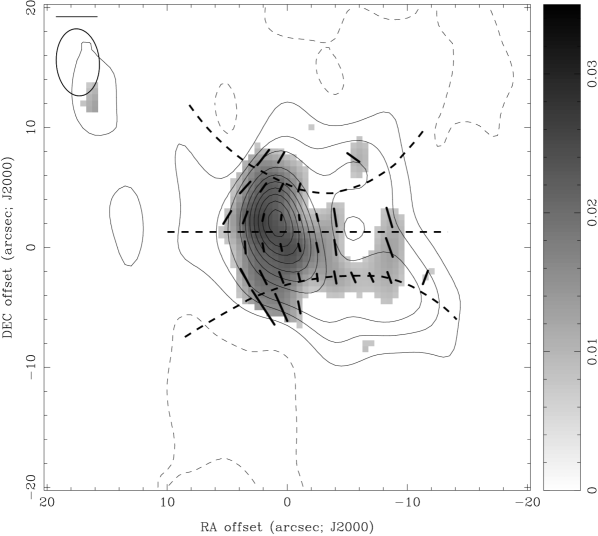
Polarized dust emission was detected and mapped toward G30.79 FIR 10 (Figure 1) with a beam size of and a beam P.A. of . The Stokes I map shows a peak emission of 1.6 Jy beam-1; this peak is consistent with Mooney et al. (1995) observations at the same wavelength. Most of the emission in Figure 1 comes from a compact core in radius.
The polarized emission shown in Figure 1 has a level of significance, a peak polarized intensity of 0.03 Jy beam-1, and a mean position angle of 4.6. The polarization direction is different in the northern and southern regions; the mean P.A. in the north is -33.2, and in the south is 23.9. The polarization is fairly uniform in fractional polarization and smooth in its direction change from north to south, (see Table 1). Vallée & Bastien (2000) observed G30.79 FIR 10 using the JCMT telescope at m. They detected continuum polarization at two points in FIR 10. Only one of them is in the general area of our map; however, this point is south of the center of our polarization pattern. Hence, these results cannot be compared directly with ours.
4.2 CO
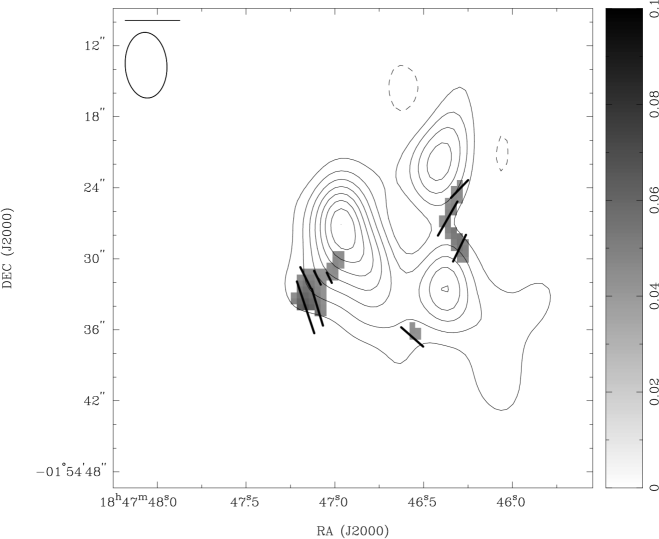
Polarized emission from the CO was detected (Figure 2). The Stokes I map shows three CO peaks which cover a similar area as the continuum emission. Our peak emission is 1.4 Jy beam-1 with a beam size of and a beam P.A. of . We only detected a level of polarized emission of at least at three independant positions in the core. These three points show two distinctive directions which appear to be orthogonal to each other. The polarization in the southern part of the map shows a mean P.A. of , while the north-western part of the core shows a mean P.A. of . Line polarized emission appears to be parallel to dust polarized emission over the same area in the south; the average P.A. difference is which suggests that the magnetic field is perpendicular to the polarization. However, in the north-western region the average difference in P.A. is . It is posible that our interferometric observations are resolving out the CO emission, which will make the fractional polarization measurements unreliable.
5 Discussion
We mapped polarized dust emission at 1.3 mm from G30.79 FIR 10, and Vallée & Bastien (2000) detected polarized dust emission at 760 m. The emission at both wavelengths seem to be dominated by dust, which is reinforced by the lack of centimeter radio continuum emission from this source. A fully developed H II region is present in the G30.79 region, but its ionization front has not yet reached FIR 10; the H II region appears to be pc away from the FIR 10 source (Mooney et al., 1995). Water masers have also been observed, which is a signpost for high mass star formation. Based on this evidence, we believe that G30.79 FIR 10 is in an early stage of evolution.
We inferred the source parameters from our data using an area , which corresponds to the area over which we mapped the polarized flux of the core. The dust absorption cross section per H-atom is approximated by a power law (Mezger et al., 1990)
| (1) |
where is the wavelength, is the total hydrogen column density, the relative metalicity, and is a parameter which reflects the variation of dust absorption cross sections (Mezger et al., 1990). Two values are used for ; reproduces estimates of cm2(H-atom)-1, which represents molecular gas of moderate density cm-3, and relates to dust around deeply embedded IR sources at higher densities. Apparently a value of was used by Mooney et al. (1995) in their estimates on G30.79 FIR 10. We used the expressions for the cloud mass and the column density given by Mooney et al. (1995):
| (2) |
| (3) |
where is the averaged flux from the source, is the angular source size, is the factor for the Planck function, and is the distance to the source in kpc. We obtained by averaging the continuum emission over an area of 20 20′′, which gives 4.7 Jy. From their 1.3 mm single dish observations, Mooney et al. (1995) obtained 13.6 Jy for a source of . Their larger result is due both to the larger area over which they averaged and to loss of flux in the interferometer data due to missing short uv-spacings. We used K, the same dust temperature used by Mooney et al. (1995), who noted the uncertainty of the value, which is based on dust models. Motte et al. (2003) also observed G30.79 FIR 10 (which they called W43-MM1); they fitted a gray body model obtaining a dust temperature of 19 K. A distance of 5.5 kpc to G30.79 FIR 10 was used (Motte et al., 2003). From our date, we find cm-2 and . The mass is in agreement with Motte et al. (2003) who estimated . However, this value is lower than the values calculated by Vallée & Bastien (2000), who estimated a mass , and Mooney et al. (1995), who calculated . This difference can be explained due to the larger distance assumed by the later investigators.
Assuming magnetic alignment, our polarized dust emission map suggests a poloidal morphology for the magnetic field. This is seen by rotating the line segments in Figure 1 by 90∘. This poloidal morphology hints at an hourglass shape for the magnetic field in this core. The proposed field morphology is shown by thick dashed lines Figure 1.
Using the Chandrasekhar-Fermi effect (Chandrasekhar & Fermi, 1953), we can estimate the magnetic field strength from the analysis of the small scale randomness of magnetic field lines. We used the expression in Crutcher et al. (2004) to estimate the magnetic field strength:
| (4) |
where is the magnetic field strength in G, is in cm-3, is the FWHM velocity width in km s-1, and is the P.A. dispersion in degrees.
We used km s-1 from the apparently optically thin H13CO+ measured with a 29′′ beam (Motte et al., 2003). Our cm-2 implies (H2)=6.5 cm-2, which gives cm-3 for a core diameter of 16′′ (0.43 pc). The weighted-mean P.A. dispersion 21.9∘ (after correction for 4.7∘ contribution from measurement uncertainties) was calculated from our polarized dust observations. These values yield mG. Although, this value may seem extraordinarily high, it is similar to field strengths estimated from maser Zeeman splitting at similar gas densities in other clouds.
Using our estimate above for the column density, we can calculate the mass to magnetic flux ratio in term of the critical value (Crutcher, 2004):
| (5) |
where is in cm-2 and B in . We obtained a value of , which is slightly supercritical. Applying the statistical geometrical correction factor of 1/3 (Crutcher, 2004), , which is essentially critical.
Our CO line polarization detections are too scarce to yield any significant information about the magnetic field. However, comparing the CO polarized emission to the dust polarized emission may help in getting information about the sources of anisotropy in this region. Figure 2 shows that at the south-eastern side of the map the CO polarization is parallel to the polarized dust emission, and in the north-western part of the map they may be roughly orthogonal. Previous polarization observations in sources like DR21(OH) showed CO polarization perpendicular to the polarization of dust emission over the main sources (Lai et al., 2003). A theoretical study by Cortes et al. (2005) suggested that line polarization traces the magnetic field at lower densities than the dust, and the orientation of the line polarization will depend on the degree of anisotropy in the region. Cortes et al. (2005) concluded that the presence of hot continuum sources will preferentially produce CO polarization that will be perpendicular to the dust polarization. In the case of G30.79 FIR10 it is difficult to draw any conclusion without CO polarization data and a detailed modeling of the source.
6 Summary and conclusions
We observed G30.79 FIR 10 and successfully mapped CO line and 1.3 mm dust continuum polarized emission with a resolution of .
G30.79 FIR 10 is not a well studied region; however, there is evidence that points toward an early stage of development of high-mass star formation. We found a remarkably uniform pattern in our polarized dust emission map, which suggests an hourglass magnetic field morphology. Using the Chandrasekhar-Fermi method, we inferred a plane-of-the-sky magnetic field strength 1.7 mG, which yielded a geometry-corrected mass to magnetic flux ratio of 0.9 to respect to critical. This result is similar to those found in many other regions of low-mass and high-mass star formation.
Polarized line emission was also detected in this region; these results pose questions about the sources of anisotropy, which will require more detailed modeling.
This research was partially funded by NSF grants AST 02-05810 and 02-28953.
References
- Cesaroni et al. (1988) Cesaroni, R., Palagi, F., Felli, M., Catarzi, M., Comoretto, G., di Francos, Giovanardi, C., & Palla, F. 1988, A&AS, 76, 445
- Chandrasekhar & Fermi (1953) Chandrasekhar, S., & Fermi, E. 1953, ApJ, 118, 113
- Chernin & Welch (1995) Chernin, L. M., & Welch, W. J. 1995, ApJ, 440, L21
- Cortes et al. (2005) Cortes, P. C., Crutcher, R. M., & Watson, W. M. 2005, MNRAS, 210, 425
- Crutcher (2004) Crutcher, R. M. 2004, Ap&SS, 292, 225
- Crutcher et al. (2004) Crutcher, R. M., Nutter, D. J., Ward-Thompson, D., & Kirk, J. M. 2004, ApJ, 600, 279
- Girart et al. (1999) Girart, J. M., Crutcher, R. M., & Rao, R. 1999, ApJ, 525, L109
- Goldreich & Kylafis (1981) Goldreich, P., & Kylafis, N. D. 1981, ApJ, 243, L75
- Goldreich & Kylafis (1982) —. 1982, ApJ, 253, 606
- Lai et al. (2002) Lai, S., Crutcher, R. M., Girart, J. M., & Rao, R. 2002, ApJ, 566, 925
- Lai et al. (2003) Lai, S., Girart, J. M., & Crutcher, R. M. 2003, ApJ, 598, 392
- Lai (1999) Lai, S. P. 1999, PhD thesis, University of Illinois at Urbana - Champaign, Urbana, IL 61801, not Available at the Astronomy library at the Astronomy building
- Lazarian (2003) Lazarian, A. 2003, Journal of Quantitative Spectroscopy and Radiative Transfer, 79, 881
- Liszt (1995) Liszt, H. S. 1995, AJ, 109, 1204
- Mezger et al. (1990) Mezger, P. G., Zylka, R., & Wink, J. E. 1990, A&A, 228, 95
- Mooney et al. (1995) Mooney, T., Sievers, A., Mezger, P. G., Solomon, P. M., Kreysa, E., Haslam, C. G. T., & Lemke, R. 1995, A&A, 299, 869
- Motte et al. (2003) Motte, F., Schilke, P., & Lis, D. C. 2003, ApJ, 582, 277
- Rao et al. (1998) Rao, R., Crutcher, R. M., Plambeck, R. L., & Wright, M. C. H. 1998, ApJ, 502, L75+
- Sault et al. (1995) Sault, R. J., Teuben, P. J., & Wright, M. C. H. 1995, in ASP Conf. Ser. 77: Astronomical Data Analysis Software and Systems IV, 433–+
- Vallée & Bastien (2000) Vallée, J. P., & Bastien, P. 2000, ApJ, 530, 806
| Offsets in arcsec | ||
|---|---|---|
| (-7.0,-9.0) | 0.120.05 | 62.39.9 |
| (0,-6.0) | 0.090.03 | 20.18.3 |
| (3.0,-2.0) | 0.040.009 | 24.86.0 |
| (0,-2.0) | 0.0230.004 | 17.75.0 |
| (3.0,0) | 0.030.005 | 6.65.3 |
| (0,0) | 0.020.003 | 13.34.3 |
| (-2.5,0) | 0.020.005 | 11.56.5 |
| (3.0,3.0) | 0.030.004 | -21.84.6 |
| (0,3.0) | 0.010.003 | -6.65.7 |
| (3.0,6.0) | 0.050.01 | -42.56.8 |
| (0,6.0) | 0.030.006 | -24.36.7 |