The All-wavelength Extended Groth Strip International Survey (AEGIS) Data Sets
Abstract
In this the first of a series of Letters, we present a description of the panchromatic data sets that have been acquired in the Extended Groth Strip region of the sky. Our survey, the All-wavelength Extended Groth Strip International Survey (AEGIS), is intended to study the physical properties and evolutionary processes of galaxies at 1. It includes the following deep, wide-field imaging data sets: Chandra/ACIS303030NASA’s Chandra X-Ray Observatory was launched in July 1999. The Chandra Data Archive (CDA) is part of the Chandra X-Ray Center (CXC) which is operated for NASA by the Smithsonian Astrophysical Observatory. X-ray (0.5–10 keV), GALEX313131GALEX (Galaxy Evolution Explorer) is a NASA Small Explorer, launched in April 2003. We gratefully acknowledge NASA’s support for construction, operation, and science analysis of the GALEX mission, developed in cooperation with the Centre National d’Etudes Spatiales of France and the Korean Ministry of Science and Technology. ultraviolet (1200–2500 Å), CFHT/MegaCam Legacy Survey323232Based on observations obtained with MegaPrime/MegaCam, a joint project of CFHT and CEA/DAPNIA, at the Canada-France-Hawaii Telescope (CFHT) which is operated by the National Research Council (NRC) of Canada, the Institut National des Science de l’Univers of the Centre National de la Recherche Scientifique (CNRS) of France, and the University of Hawaii. This work is based in part on data products produced at TERAPIX and the Canadian Astronomy Data Centre as part of the CFHT Legacy Survey, a collaborative project of NRC and CNRS. optical (3600–9000 Å), CFHT/CFH12K optical (4500–9000 Å), Hubble Space Telescope/ACS333333Based on GO-10134 program observations with the NASA/ESA Hubble Space Telescope, obtained at the Space Telescope Science Institute, which is operated by the Association of Universities for Research in Astronomy, Inc., under NASA contract NAS 5-26555. optical (4400–8500 Å), Palomar/WIRC343434Based on observations obtained at the Hale Telescope, Palomar Observatory, as part of a collaborative agreement between the California Institute of Technology, its divisions Caltech Optical Observatories and the Jet Propulsion Laboratory (operated for NASA), and Cornell University. near-infrared (1.2–2.2 m), Spitzer/IRAC353535This work is based in part on observations made with the Spitzer Space Telescope, which is operated by the Jet Propulsion Laboratory, California Institute of Technology under a contract with NASA. Support for this work was provided by NASA through contract numbers 1256790, 960785, and 1255094 issued by JPL/Caltech. mid-infrared (3.6–8.0 m), Spitzer/MIPS far-infrared (24–70 m), and VLA363636The Very Large Array of the National Radio Astronomy Observatory is a facility of the National Science Foundation operated under cooperative agreement by Associated Universities, Inc. radio continuum (6–20 cm). In addition, this region of the sky has been targeted for extensive spectroscopy using the DEIMOS spectrograph on the Keck II 10 m telescope373737Data presented herein were obtained at the W. M. Keck Observatory, which is operated as a scientific partnership among the California Institute of Technology, the University of California, and NASA. The Observatory was made possible by the generous financial support of the W. M. Keck Foundation.. Our survey is compared to other large multiwavelength surveys in terms of depth and sky coverage.
1 Introduction
The All-Wavelength Extended Groth Strip International Survey (AEGIS) is a collaborative effort to obtain both deep imaging covering all major wavebands from X-ray to radio and optical spectroscopy over a large area of sky (0.5–1 deg2) with the aim of studying the panchromatic properties of galaxies over the last half of the Hubble time. The region studied, the Extended Groth Strip (EGS: =14h17m, =+52∘30′) is an extension of and owes its name to a Hubble Space Telescope (HST) survey consisting of 28 Wide-Field Planetary Camera 2 (WFPC2) pointings carried out in 1994 by the WFPC team (Rhodes, Refregier, & Groth, 2000). This field benefits from low extinction, low Galactic and zodiacal infrared emission, and good schedulability by space-based observatories, and has therefore attracted a wide range of deep observations at essentially every accessible wavelength over this comparatively wide field.
Amongst deep multiwavelength fields, the EGS field provides a unique combination of area and depth at almost every waveband observable. It is two (for HST) to four (for Spitzer and Chandra) times larger than the combined GOODS fields (Giavalisco et al., 2004), yet has a similar range of wavelength coverage, making it ideal for studying rare classes of objects that may be absent in smaller fields. The GEMS field (Rix et al., 2004) covers a similar area to similar depths, but was studied by the COMBO-17 photometric redshift survey rather than a spectroscopic survey. Most AEGIS data sets cover 0.5–1 deg2, considerably smaller than the 2 deg2 COSMOS field (Koekemoer & Scoville, 2005). However, AEGIS observations are deeper at most wavelengths, benefiting from greater schedulability and lower backgrounds. Spectroscopy of the COSMOS field is in progress (Lilly & The zCOSMOS Team, 2005), but will not be completed for 3–5 years. An additional advantage of AEGIS is that deep HST/ACS imaging is available in two bands (F606W and F814W), whereas the COSMOS field has been observed in F814W only, while the F850LP imaging in GEMS is too shallow to study subcomponent colors for most galaxies.
Even before AEGIS, the EGS region attracted a rich suite of surveys, including both spectroscopy (Lilly et al., 1995; Steidel et al., 2003; Cristóbal-Hornillos et al., 2003) and panchromatic imaging from both the ground and space, running from X-ray (Miyaji et al., 2004; Nandra et al., 2005) to ultraviolet (UV) and optical (Beck-Winchatz & Anderson, 1999; Brunner et al., 1999; Sarajedini et al., 2006), near infrared (IR) (Cardiel et al., 2003; Hopkins et al., 2000), mid-IR (Flores et al., 1999), submillimeter (Coppin et al., 2005), and radio (Fomalont et al., 1991). AEGIS has carried this work even further; for example, the first generation of the DEEP galaxy redshift survey, DEEP1, obtained 620 galaxy redshifts in the WFPC2 Groth Strip region, now publicly available (Simard et al., 2002; Vogt et al., 2005; Weiner et al., 2005). In comparison, the successor DEEP2 Galaxy Redshift Survey has obtained 9501 redshifts in the EGS so far, with thousands more planned.
Data from DEEP2 are a linchpin for almost all AEGiS studies, providing redshifts; internal kinematics for dynamical masses; line strengths for star formation rates, AGN identification, and gas-phase metallicities; stellar population ages and metallicites; etc.. The precision and relatively dense sampling of DEEP2 redshifts allow for accurate measurement of the local environment of objects in EGS, which is a major factor driving galaxy evolution. Other surveys at similar redshifts provide weaker environmental measures due to larger redshift errors, lower sampling rates, and/or smaller areas (Cooper et al., 2005). Furthermore, we can remove cosmic variance fluctuations from observed AEGIS abundances by comparing redshift distributions to the other three, widely-separated DEEP2 fields.
Ten instrument teams and a number of theorists are now collaborating on AEGIS—nearly 100 scientists in half a dozen countries. The first fruits of this collaboration are presented in this issue of Astrophysical Journal Letters. These papers make use of the power of the combined AEGIS dataset in a variety of ways. Six Letters investigate the nature of rare objects found in the AEGIS field, illustrating the benefits of covering an area wide enough to find them in (Gerke et al., 2006; Huang et al., 2006; Kirby et al., 2006; Moustakas et al., 2006; Symeonidis et al., 2006). These studies take advantage of the full multiwavelength coverage from AEGIS, which provides each object’s spectral energy distribution (SED) in detail; we also explore the range of SEDs exhibited by a wider set of galaxies in Konidaris et al. (2006).
Five more Letters investigate the drivers and evolution of star formation in galaxies using the wide array of indicators available from this multifaceted dataset, based on UV, IR, and radio continuum as well as optical emission lines (Ivison et al., 2006; Lin et al., 2006; Noeske et al., 2006a, b; Weiner et al., 2006). Three Letters focus on the optical properties of Active Galactic Nuclei at 1.4 identified using both deep X-ray and IR data, and explore their relationship to their large-scale structure environment (Georgakakis et al., 2006; Nandra et al., 2006; Pierce et al., 2006). Two Letters test for evolution in the relationships between mass measures to 1: between stellar mass and gas kinematics within individual galaxies (Kassin et al., 2006), and between X-ray gas emission and galaxy kinematics in groups of galaxies (Fang et al., 2006). The remaining two Letters use DEEP2 spectroscopy to investigate the nature of objects which are extremely red in optical-IR color, finding that a substantial fraction of the population lies at 1.4 (Conselice et al., 2006; Wilson et al., 2006).
These papers present only the first results from the AEGIS survey; we are just beginning to reach the potential of this manyfaceted dataset. This Letter gives details on the AEGIS data which have been obtained so far; we only describe those survey data sets in the EGS field which are used in this special issue here. Large portions of this dataset, including the DEEP2 spectra and HST/ACS imaging, will be publicly released in 2007, making it a legacy for the entire community.
2 The Panchromatic Data Sets
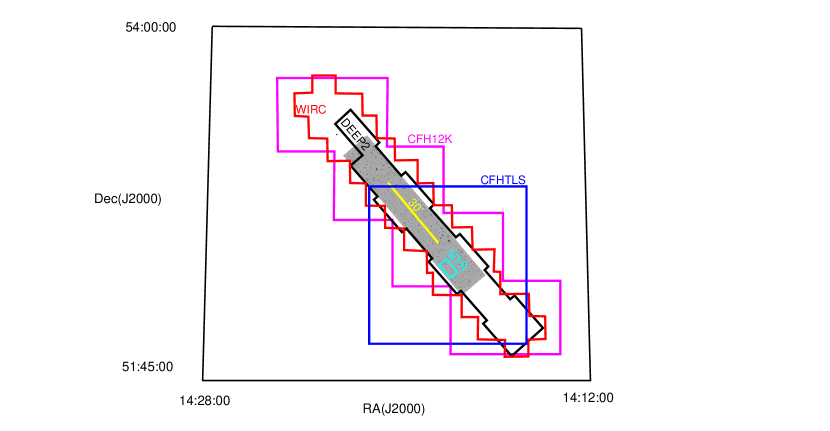
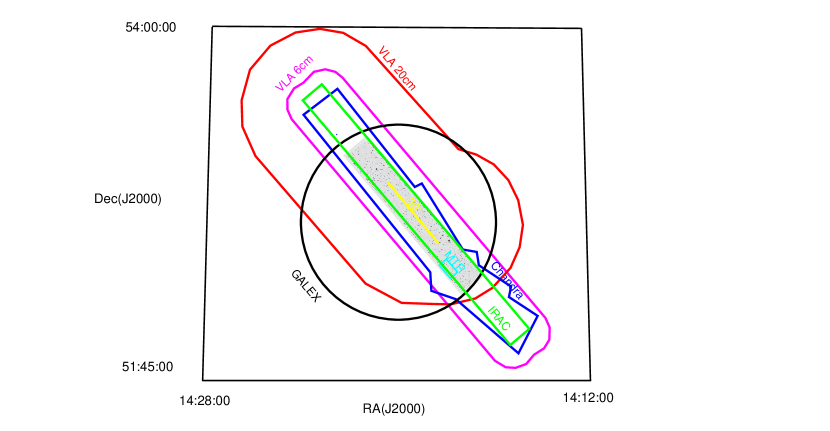
The basic parameters of the AEGIS multiwavelength data sets are listed in Table 2 and their sky coverage is shown in Figure 1. The acquisition and reduction of the AEGIS data sets and the derivation of source photometry catalogs [from which panchromatic spectral energy distributions (SEDs) are measured] are described in detail below. Spitzer IRS mid-IR spectra exist for a relatively small number of galaxies; the details of these observations are in Le Floc’h et al. (2006) and Huang et al. (2006).
| Telescope/Instr. | Band | PSF | Lim. Mag. | Surf. Dens. | Area | Exp. Time | |
|---|---|---|---|---|---|---|---|
| (Mode) | (fwhm) | (5 in most cases) | (deg-2) | (deg2) | (ks) | ||
| Chandra/ACIS | HB | 0.5′′–6.0′′ | 3.1 Å (4 keV) | 8.210erg s-1 cm-2 | 3200 | 0.67 | 200 |
| SB | 0.5′′–4.0′′ | 12.4 Å (1 keV) | 1.110erg s-1 cm-2 | 2500 | 0.67 | 200 | |
| GALEX | FUV | 5.5′′ | 1539 Å | 25 (AB) [] | 8720 | 1.13 | 58 |
| NUV | 5.5′′ | 2316 Å | 25 (AB) [] | 2.35104 | 1.13 | 120 | |
| CFHT/MegaCam | 1.1′′ | 3700 Å | 27 (AB) | 105 | 1 | 6.1 | |
| (CFHLS/current) | 1.0′′ | 4850 Å | 28.3 (AB) | 105 | 1 | 6.5 | |
| 0.9′′ | 6250 Å | 27.5 (AB) | 105 | 1 | 15 | ||
| 0.9′′ | 7700 Å | 27 (AB) | 105 | 1 | 47 | ||
| 0.9′′ | 8850 Å | 26.4 (AB) | 105 | 1 | 3.6 | ||
| CFHT/CFH12K | 1′′ | 4389 Å | 24.5 (AB) [8] | 1.45105 | 1.31 | 6.5 | |
| 1′′ | 6601 Å | 24.2 (AB) [8] | 1.45105 | 1.31 | 3.6 | ||
| 1′′ | 8133 Å | 23.5 (AB) [8] | 1.45105 | 1.31 | 4.7 | ||
| HST/ACS | F606W () | 0.1′′ | 5913 Å | 28.75 (AB) [5] | 4.0105 | 0.197 | 2.3 |
| (WFC) | F814W () | 0.1′′ | 8330 Å | 28.10 (AB) | 3.9105 | 0.197 | 2.1 |
| HST/NICMOS | F110W () | 0.35′′ | 1.10 m | 25.7 (AB) [10] | 3.3105 | 0.0128 | 2.6 |
| (NIC3) | F160W () | 0.35′′ | 1.59 m | 25.5 (AB) [10] | 3.3105 | 0.0128 | 2.6 |
| Palomar/WIRC | 1′′ | 1.25 m | 23 (Vega) | 7.64104 | 0.2 | 18 | |
| 1′′ | 2.14 m | 20.6 (Vega) | 5.37104 | 0.7 | 11 | ||
| Spitzer/IRAC | Band 1 | 1.8′′ | 3.6 m | 0.9 Jy | 1.66105 | 0.33 | 10.1 |
| Band 2 | 2.0′′ | 4.5 m | 0.9 Jy | 1.68105 | 0.33 | 10.1 | |
| Band 3 | 2.2′′ | 5.8 m | 6.3 Jy | 4.90104 | 0.33 | 10.1 | |
| Band 4 | 2.2′′ | 8.0 m | 5.8 Jy | 4.86104 | 0.33 | 10.1 | |
| Spitzer/MIPS | 24 m | 5.9′′ | 23.7 m | 77 Jy | 1.76104 | 0.534 | 1.68 |
| 70 m | 19′′ | 71.4 m | 10.3 mJy | 1275 | 0.498 | 0.84 | |
| VLA | 6 cm | 1.2′′ | 6 cm | 0.55 mJy beam-1 [10] | 88.9 | 5.2 | 0.5 |
| 20 cm | 4.2′′ | 20 cm | 100 Jy beam-1 | 1075 | 0.64 | 400 | |
| Telescope/Instr. | Wavelen. Range | Spec. Res. | Spatial PSF | Lim. Mag. | Area | Num. Targ. | Exp. Time |
| (Mode) | (Å) | (Å) | (fwhm) | (deg2) | (ks) | ||
| Keck/DEIMOS | 6400–9100 | 1.4 | 0.6′′–1′′ | =24.1 | 0.5 | 17,600 | 3.6 |
| (DEEP2/Spectra) | (final) | (final) |
2.1 Chandra ACIS X-ray Images
The EGS region has been surveyed at X-ray wavelengths by Chandra using the Advanced CCD Imaging Spectrometer (ACIS). The observations consist of eight individual pointings obtained with the ACIS-I instrument with a pixel scale of 0.49′′ and a field of view of 17′17′. The total exposure time per pointing is 200 ks split into at least four separate integrations obtained at different epochs.
The data reduction is performed using the ciao data analysis software version 3.2. After identifying hot pixels and cosmic-ray afterglows, the raw data are processed through the ciao acis_process_events task, which applies the latest gain map and charge transfer inefficiency corrections. The observations are then screened using the standard ASCA grade set (event grades 0, 2, 3, 4, and 6) and inspected for flaring spikes, when the background deviates by more than 3 from the mean quiescent value. Bad time intervals amount to % of the total exposure time per pointing. Individual observations of a given Chandra pointing are then merged into a single event file.
The final mosaic images are used to detect sources in a number of energy bands, including 0.5–2.0 keV, 2.0–7.0 keV, and 0.5–7.0 keV. The source detection is based on pre-selection of candidate sources using the ciao wavdetect task with a low likelihood probability threshold (), followed by aperture count extraction using the 70% PSF radius and a local background determination to estimate the source significance (for details see Nandra et al., 2005). The final catalog comprises sources with Poisson false probability 410-6. Point-source fluxes are estimated by integrating the net counts within the 90% encircled energy radius at the position of the source. We adopt a power-law SED with =1.4 and Galactic neutral hydrogen column density =1.31020 cm-2, appropriate for the EGS field. The limiting fluxes in standard bands are listed in Table 2. Only a subset of the AEGIS Chandra observations has been analysed at this point and therefore used for followup analysis (see Georgakakis et al., 2006).
At the time of writing the AEGIS Chandra observations represent the third deepest X-ray survey in the sky. The Hubble Deep Field North survey is 5 deeper over a 5 smaller area (Alexander et al., 2003). The Chandra Deep Field South (Giaconni et al., 2002; Lehmer et al., 2002) covers about half the AEGIS survey area mostly to a similar depth, with a smaller central region that is twice as deep. The vast majority of X-ray sources detected in the EGS field are active galactic nuclei (AGN). At the target redshift of the DEEP2 survey, =1, the AEGIS limiting luminosity of 71041 erg s-1 corresponds to 0.005, where is the characteristic AGN luminosity at this redshift (Barger et al., 2005).
2.2 GALEX Ultraviolet Images
The Galaxy Evolution Explorer (GALEX) images a 1.25∘ diameter field. GALEX images of the EGS are built from stacks of 42 far-ultraviolet (FUV) and 87 near-ultraviolet (NUV) separate one-orbit images obtained in 2003, 2004, and 2005 and processed using version 4.1 of the GALEX pipeline. The combined exposure times are 5.810s for FUV and 1.210s for NUV. The raw photon count images are flat-fielded and calibrated using relative response maps. The resulting calibrated intensity images are in units of photon s-1, where 1 photon s-1 corresponds to 18.82 and 20.08 AB mag for the FUV and NUV bands, respectively. The background in the images is estimated using PoissonBG, a program written for GALEX data that uses Poisson rather than Gaussian statistics to clip suspected sources from the background map. Finally, the source catalogs are derived from the background-subtracted images with SExtractor (Bertin & Arnouts, 1996). More details about the GALEX pipeline can be found at http://www.galex.caltech.edu.
2.3 Canada-France-Hawaii Telescope Legacy Survey MegaCam Optical Images
The EGS is one of four 1 deg2 fields covered by the ongoing Canada-France-Hawaii Telescope Legacy Survey (CFHTLS) Deep Survey383838http://www.cfht.hawaii.edu/Science/CFHLS/cfhtlsdeepwidefields.html. This field (labelled “D3” by CFHTLS) has been observed for a total of 114 hr using the MegaCam imager on the 4 m Canada-France-Hawaii Telescope (CFHT; Boulade et al., 2003) from April 2003 to the present; a total integration time of 330 hr is planned by the end of the five-year survey. This time is divided amongst five broad-band filters: , , , , and . Only images with seeing fwhm smaller than 0.9′′–1.1′′ (depending on the band) are included in the survey. Five-sigma point source detection limiting AB magnitudes in the current data set range from 26.4 (in ) to 28.3 (in ).
The catalogs used in AEGIS papers are based on a subset of the CFHTLS data set with total exposure times of 1.7/1.8/4.1/13.0/1.0 hr in ////. After visual rejection of defective exposures, Elixir-processed frames were run through the AstroGwyn and PhotGwyn software packages, improving both astrometric and photometric calibrations significantly (Magnier & Cuillandre, 2004; Gwyn et al., 2006); they were then corrected for distortions and coadded using SWarp393939http://terapix.iap.fr/rubrique.php?id_rubrique=49. Photometry was then obtained using the double image mode of SExtractor (Bertin & Arnouts, 1996), with used as reference image. The principal CFHTLS measurements used here are Kron aperture (SExtractor MAG_AUTO) AB magnitudes. In addition, photometric redshifts for CFHTLS sources were determined by applying the gwynz code to photometry within matched, 1′′ radius apertures (Gwyn et al., 2006). Additional details of the procedures used are available at: http://www.astro.uvic.ca/grads/gwyn/cfhtls/D3.html.
2.4 Canada-France-Hawaii Telescope CFH12K Optical Images
The EGS was imaged in , , and bands using the CFH12K mosaic camera (Cuillandre et al., 2001) on CFHT. This 12K8K mosaic camera has a scale of 0.21′′ pixel-1 and a field of view of 0.70∘0.47∘ (with the longer axis oriented East-West). The -band seeing ranged from 0.75′′–1′′ fwhm in the four separate CFHT12K pointings covering the EGS; integration times were 1 hr in and and 2 hr in . The -band magnitudes were measured within circular apertures of radius 3, where is the of a Gaussian fit to the image profile; for objects where 31, a 1′′ radius aperture was used instead. The and colors of each object were measured using a 1 radius aperture. The resulting photometry was calibrated to the AB system within the native CFHT12K passbands (which differ significantly from the Kron-Cousins system, particularly in ) using stars observed by the Sloan Digital Sky Survey (SDSS; York et al., 2000); the stellar locus is used to ensure consistency of the color system between CFH12K pointings. Details of the data reduction, astrometry, star-galaxy separation, and catalog construction can be found in Coil et al. (2004); the resulting catalogs are available at http://deep.berkeley.edu/DR1.
2.5 Hubble Space Telescope ACS Optical Images
Deep HST images of the EGS were obtained with ACS as part of GO Program 10134 (PI: M. Davis). The EGS was imaged in the (F606W) and (F814W) bands during the period 2004 June to 2005 March. A mosaic pattern consisting of 213 = 63 contiguous “tiles” was used to cover an effective area of 10.1′70.5′ = 710.9 arcmin2 following the IRAC imaging strip (§ 2.9). The exposure times per “tile” were 2260 and 2100 s in the and bands, respectively. Tiles were observed at a position angle of 130∘, or rotated by multiples of 90∘ relative to this value to meet guide star constraints. Each tile was observed in a 4-pointing dither pattern in each filter, in order to achieve half-pixel dithering at the center of ACS WFC, bridge the detector gap, and improve tile overlap. The final mosaic is gap-free and each pixel is observed at least three times. Dithered pointings were combined with the stsdas multidrizzle package using a square kernel. The final images have a pixel scale of 0.03′′ pixel-1 with a PSF of 0.12′′ fwhm. The 5 limiting magnitudes for a point source are (AB) and (AB) within a circular aperture of radius 0.12′′ (50 pixel area). For an extended object, the 5 limiting magnitudes are (AB) and (AB) for a circular aperture of radius (314 pixel area).
We detected objects in summed ACS + images and constructed initial galaxy segmentation maps using the SExtractor galaxy photometry software (Bertin & Arnouts, 1996) and a detection threshold of 1.5 and 50 pixels. These detection maps and the ACS zeropoints (Sirianni et al., 2005) were applied to each band separately to create the ACS photometric catalogs.
2.6 Keck DEIMOS Optical Spectra
The EGS is one of the four fields observed by the DEEP2 collaboration (Davis et al., 2003). Here we briefly describe the DEEP2 data in EGS; for more details see Davis et al. (2005) for maskmaking algorithms, Faber et al. (in prep.) for full survey details, and Cooper et al. (in prep.) for data reduction pipelines. Targets were selected for DEEP2 spectroscopy from the CFHT12K imaging described in § 2.4. Eligible DEEP2 targets have 18.524.1, 20% probability of being a galaxy (based on angular size, / colors, and mag), and surface brightness brighter than:
| (1) |
where is the area of the aperture used to measure the CFHT12K magnitude (§ 2.4); all magnitudes are AB. Each object is given a weight based on its probability of being a galaxy, its magnitude, and whether or not meets the DEEP2 color cut used to eliminate low- objects in other fields [galaxies with () 2.45()0.5, ()1.1, or ()0.5 all pass this cut]. This weight is used when randomly selecting amongst multiple objects that cannot be observed simultaneously due to DEIMOS slitmask constraints (Davis et al., 2005). Fainter objects (particularly those with 21.5 and expected 0.75 from the color cut) are given lower weight in order to sample a range of luminosities and roughly equal numbers of galaxies below and above 0.75 (Faber et al. in prep.). Selection probabilities for each potential target are known to 1%; the median is 70% for objects with 0.1, falls to 54% at 0.5–0.6, and is flat at 73% for 0.8.
All spectra were taken with the DEIMOS spectrograph (Faber et al., 2003) at the Keck II telescope. Each observation uses a unique aluminum mask milled with 150 1′′ wide and 3′′ long slitlets over a 16′4′ area, which is observed for a minimum of 1 hr (until a target signal-to-noise is reached) divided amongst 3 or more sub-exposures. The 1200 line mm-1 grating used yields a dispersion of 0.33 Å pixel-1 and a spectral resolution of fwhm=1.4 Å. The typical wavelength range of the spectra is 6500–9100 Å, varying modestly with slit position. Slitlets are tilted up to 30∘ to follow the photometric major axes of extended targets.
All DEEP2 spectra were reduced with an IDL pipeline heavily modified from the idlspec2d package designed for SDSS (Burles & Schlegel in prep.). Spectra were extracted using both boxcar and optimized Gaussian weighting. The pipeline determines a set of candidate redshifts for each object by fitting a linear combination of templates at each possible and finding local minima in ; these redshifts are then evaluated and selected amongst by DEEP2 team members using a graphical interface. Two significant features must match the templates for a secure redshift (quality =3 or 4); a resolved [O ii] 3727 Å doublet is counted as two features.
Based on both repeated observations and tests with multiwavelength photometry, we estimate that 5% of =3 redshifts (obtained for 11% of EGS targets) are incorrect, while 0.5% of highest-confidence, =4 redshifts (60% of EGS targets) are incorrect. Lower quality redshifts are considered insecure or ambiguous and not used for any analyses. Objects with repeated observations (310 out of the 13570 galaxies observed so far in EGS) have an rms redshift uncertainty of 30 km s-1. Secure redshifts have been obtained for 9501 galaxies in EGS, with median redshift 0.74. Objects at 1.42 tend not to have strong features in the DEEP2 spectral window; such objects appear to comprise the bulk of DEEP2 redshift failures (C. Steidel, priv. comm.).
2.7 Hubble Space Telescope NICMOS Near-Infrared Images
Deep HST Near Infrared Camera and Multi-Object Spectrometer (NICMOS) NIC3 images of the EGS were obtained as “parallels” of the ACS images (§ 2.5) as part of GO Program 10134 (PI: M. Davis). Each NIC3 field was observed in the (F110W) and (F160W) bands for 2560 s per band (one HST orbit). The field of view of a single NIC3 pointing is 51.2′′51.2′′. The resulting 63 NIC3 fields cover a combined area of 46 arcmin2. Out of the 63, 58 fully overlap with the ACS imaging mosaic; the remaining five NIC3 pointings coincide with other AEGIS data sets. Since the NIC3 PSF is undersampled, we developed a 4-point dither pattern that simultaneously provides optimal sub-pixel dithering for ACS WFC and NIC3 to improve the final resolution of the reduced images.
The NICMOS NIC3 images were processed in similar way as the ACS images. Basic image reductions were performed with the stsdas.calnica routine: flatfielding and corrections for dark current, bias, variable quadrant bias, amplifier glow, cosmic ray persistence, detector nonlinearity, pixel defects, bad imaging regions, cosmic rays of unusual size, and the count-rate dependent nonlinearity. The four pointings per tile per filter were combined with the stsdas.multidrizzle package using a square kernel. The final images have a scale of 0.1′′ pixel-1 with a PSF of 0.35′′ fwhm. Sources were detected using summed NIC3 + images using SExtractor (Bertin & Arnouts, 1996), using a detection threshold of 1 and minimum size of 10 pixels. Photometry was performed on the individual images using circular apertures of diameter 0.52′′ calibrated using the zero-points in the NICMOS Data Handbook.
2.8 Palomar WIRC Near-Infrared Images
Near-IR observations of the EGS in the and bands were obtained using the Wide-field Infrared Camera (WIRC) on the Palomar 5 m telescope. The observations were carried out between 2003 and 2005. WIRC has an effective field of view of 8.1′8.1′, with a scale of 0.25′′ pixel-1. The EGS observations consist of 33 WIRC overlapping pointings in and 10 pointings in , each with 430 s exposures dithered over a non-repeating 7′′ pattern. Typical total exposure times per band at any given location within the EGS are 1–2 hr. The net seeing fwhm ranges from 0.8′′ to 1.2′′. Photometric calibration was carried out by referencing standard stars during photometric conditions. The final images were made by combining individual mosaics obtained over several nights. The images were processed using a double-pass reduction pipeline developed specifically for WIRC. The total area covered in the band is 2400 arcmin2=0.67 deg2, with about a third of this area covered in the band.
2.9 Spitzer IRAC Mid-Infrared Images
The Spitzer mid-IR observations were carried out as part of Guaranteed Time Observing (GTO) program number 8, using time contributed by G. Fazio, G. Rieke, and E. Wright. The Infrared Array Camera (IRAC; Fazio et al., 2004) observations were performed in two epochs, 2003 December and 2004 June/July. Each IRAC exposure covered a 5.12′5.12′ field of view with 256256 pixels and a scale of 1.2′′ pixel-1. At each of 52 positions in a 2∘10′ map there were dithered 200 s exposures at 3.6, 4.5, and 5.8 m, together with 208 dithered 50 s exposures taken concurrently at 8.0 m.
Data processing began with the Basic Calibrated Data produced by version 11 of the Spitzer Science Center IRAC pipeline. Individual frames were corrected for the ‘muxbleed’ artifact near bright stars. Mosaicing was done using custom IDL scripts: each individual frame was distortion-corrected and projected onto a reference frame, and the frames were combined by averaging with 3-clipping. Rejection of cosmic rays, scattered light, and other image artifacts was accomplished by the sigma-clipping during mosaicing and also facilitated by having the observations done at two position angles differing by 180∘. The scale of the mosaics, 0.6′′ pixel-1, sub-samples the native IRAC pixel scale by a factor of two. The two shorter-wavelength IRAC bands are more sensitive than the longer-wavelength bands.
To make catalogs, sources in the IRAC mosaics were identified using daophot/find, and photometered in a 3′′ diameter aperture. Aperture corrections to the IRAC calibration photometry aperture of 12.2′′ (multiplicative factors of 2.07, 2.15, 2.45, and 2.68 in the four bands) were applied. For each object, neighboring objects in a 200-pixel box were subtracted before photometry. Both 3.6 m- and 8.0 m-selected catalogs were generated: photometry for the objects in each was centered on the position in the mosaic in the selected band. There are about 73,000 objects in the 3.6 m-selected catalog, many of which are undetected in the 8.0 m mosaic; the 8.0 m catalog contains only 16,000 objects.
2.10 Spitzer MIPS Far-Infrared Images
Spitzer far-IR observations with the MIPS instrument (Rieke et al., 2004) were also carried out as part of the same GTO program. Data were obtained in January and June 2004 using the slow rate MIPS scan mode with legs 2.4∘ long. The MIPS 24 m channel has a 5.4′5.4′ field of view (128128 array of 2.55′′ pixels). The 70 m channel has a 5.2′5.2′ field of view (3232 array of 9.98′′ pixels), but only half of the array is functional. The 160 m channel has a 5.3′2.1′ field of view (203 array of 16′′18′′ pixels), but one row of the array is not operational. The final mosaic covers an area 2.4∘10′. The effective integration time at 24 m is 1500 s for locations near the long centerline of the strip, decreasing to 700 s 5′ from the centerline. At 70 and 160 m, the average integration times are 700 and 100 s pixel-1 respectively. The data were reduced and mosaiced with the MIPS Data Analysis Tool (Gordon et al., 2005). Sources were identified and photometry extracted with PSF fitting using the daophot software (Stetson, 1987).
2.11 VLA Radio Continuum Images
Radio continuum observations at 6 cm (4.8 GHz, C band) were obtained at the Very Large Array (VLA) in BnA configuration for a total of 19 hr during 2003 October 11–13 (the continuum mode maximizes sensitivity but decreases the effective field of view). At 4.8 GHz the VLA antennas have a primary beam fhwm of 9′. The mapping grid contained 74 pointings, spaced 5′ apart, providing roughly uniform sensitivity over a 17′2∘ strip. Each pointing center was observed for 15 min. Phase stability was sufficient to yield astrometric accuracy better than 0.1′′ rms, and flux density was calibrated relative to 3C 286. Images containing bright (10 mJy beam-1) point sources were self-calibrated.
The data were reduced using the aips software package. For each of the 74 pointings, we created a 20482048 pixel image with a scale of 0.4′′ pixel-1. To avoid clean bias we clean-ed the images to a flux level of 260 Jy beam-1, corresponding to 4 rms, which took 100–200 iterations. For each quarter of the length of the strip, overlapping images were combined into a mosaic using the linmos task in the miriad software package. The rms noise in the mosaiced images is 42 Jy beam-1. Source candidates were extracted using SExtractor (Bertin & Arnouts, 1996) and photometry was performed with jmfit in aips on the individual pointing images, with corrections for delay beam distortions.
Altogether 51 radio components (some of which may be double radio sources) were detected at 10 significance. Further details are in Table 1, and the source list and identification with IRAC and DEEP2 counterparts are given by Willner et al. (2006).
Observations at 20 cm (1.4 GHz, L band) are described by Ivison et al. (2006) where the resulting catalog, AEGIS20, containing 1123 discrete radio emitters is published in electronic form. Briefly, spectral-line data were obtained using the VLA in B configuration, with correlator mode ‘4’, for a total of 110 hr in 2003 December and 2005 April–June. Eight overlapping pointings were observed spanning the length of the EGS, concentrating on the six furthest from the bright source, 3C 295. For each pointing the 30′ fwhm primary beam was blanketed with 37 images, each comprising 512512 pixels with a scale of 0.8′′ pixel-1, with 10–20 additional images centered on more distant, bright sources (including 3C 295). Central images of the six main pointings were mosaiced, correcting for the primary beam response and excluding data beyond the half-power point. The resulting image covers 0.04, 0.36, and 0.64 deg2 to limits of 50, 75, and 100 Jy beam-1. Source detection for AEGIS20 followed that described by Biggs & Ivison (2006).
3 Summary
This Letter has described the multiwavelength dataset in the Extended Groth Strip assembled by the AEGIS collaboration. The remaining Letters in this special issue discuss a wide range of scientific results derived from these data. By combining deep observations at almost every wavelength available over deg2 of sky with the relatively high resolution spectroscopy and dense sampling of the DEEP2 Galaxy Redshift Survey, AEGIS is making possible many unique studies of the evolution of galaxies over more than half the history of the universe. The high-quality internal kinematics and environment measurements in EGS are unmatched amongst deep multiwavelength fields. The dataset is continuing to grow and its potential is only beginning to be tapped; we expect AEGIS to provide a legacy long into the future.
References
- Alexander et al. (2003) Alexander, D. M., et al. 2003, AJ, 126, 539
- Barger et al. (2005) Barger, A. J., Cowie, L. L., Mushotzky, R. F., Yang, Y., Wang, W.-H., Steffen, A. T., & Capak, P., AJ, 129, 578
- Beck-Winchatz & Anderson (1999) Beck-Winchatz, B., & Anderson, S. F. 1999, AJ, 117, 2582
- Bertin & Arnouts (1996) Bertin, E., & Arnouts, S. 1996, A&AS, 117, 393
- Biggs & Ivison (2006) Biggs, A. D., & Ivison, R. J. 2006, MNRAS, submitted
- Boulade et al. (2003) Boulade, O., et al. 2003., SPIE, 4841, 72
- Brunner et al. (1999) Brunner, R. J., Connolly, A. J., & Szalay, A. S. 1999, ApJ, 516, 563
- Cardiel et al. (2003) Cardiel, N., Elbaz, D., Schiavon, R. P., Willmer, C. N. A., Koo, D. C., Phillips, A. C., & Gallego, J. 2003, ApJ, 584, 76
- Coil et al. (2004) Coil, A. L., et al. 2004, ApJ, 617, 765
- Conselice et al. (2006) Conselice, C. J., et al. 2006, ApJ, in press (this issue; astro-ph/0607242)
- Cooper et al. (2005) Cooper, M. C., et al. 2005, ApJ, 634, 833
- Coppin et al. (2005) Coppin, K., Halpern, M., Scott, D., Borys, C., & Chapman, S. 2005, MNRAS, 357, 1022
- Cristóbal-Hornillos et al. (2003) Cristóbal-Hornillos, D., Balcells, M., Prieto, M., Guzmán, R., Gallego, J., Cardiel, N., Serrano, Á., & Pelló, R. 2003, ApJ, 595, 71
- Cuillandre et al. (2001) Cuillandre, J.-C., Luppino, G., Starr, B., & Isani, S. 2001, in Proceedings of Semaine de l’Astrophysique Française, eds. F. Combes, D. Barret, & F. Thévenin (Les Ulis: EdP-Sciences), 605
- Davis et al. (2003) Davis, M., et al. 2003, SPIE, 4834, 161
- Davis et al. (2005) Davis, M., Gerke, B. F., Newman, J. A., & the DEEP2 team 2005, ASP Conf. Ser. 339: Observing Dark Energy, 339, 128
- Faber et al. (2003) Faber, S. M., et al. 2003, SPIE, 4841, 1657
- Fang et al. (2006) Fang, T., et al. 2006, ApJ, submitted (this issue)
- Fazio et al. (2004) Fazio, G. G., et al. 2004, ApJS, 154, 10
- Flores et al. (1999) Flores, H., et al. 1999, ApJ, 517, 148
- Fomalont et al. (1991) Fomalont, E. B., et al. 1991, AJ, 102, 1258
- Georgakakis et al. (2006) Georgakakis, A., et al. 2006, ApJ, in press (this issue; astro-ph/0607274)
- Gerke et al. (2006) Gerke, B. F., et al. 2006, ApJ, submitted (this issue)
- Giaconni et al. (2002) Giaconni, R., et al. 2002, ApJS, 139, 369
- Giavalisco et al. (2004) Giavalisco, M., et al. 2004, ApJ, 600, L93
- Gordon et al. (2005) Gordon, K. D., et al. 2005, PASP, 117, 503
- Gwyn et al. (2006) Gwyn, S., et al. 2006, in preparation
- Hines et al. (2006) Hines, D. C., et al. 2006, ApJ, 638, 1070
- Hopkins et al. (2000) Hopkins, A. M., Connolly, A. J., & Szalay, A. S. 2000, AJ, 120, 2843
- Houck et al. (2004) Houck, J. R., et al. 2004, ApJS, 154, 18
- Huang et al. (2006) Huang, J.-S., et al. 2006, ApJ, submitted (this issue)
- Ivison et al. (2006) Ivison, R., et al. 2006, ApJ, in press (this issue; astro-ph/0607271)
- Kassin et al. (2006) Kassin, S. A., et al. 2006, ApJ, submitted (this issue)
- Kirby et al. (2006) Kirby, E. N., et al. 2006, ApJ, submitted (this issue)
- Koekemoer & Scoville (2005) Koekemoer, A. M., & Scoville, N. Z. 2005, New Astron. Rev., 49, 461
- Konidaris et al. (2006) Konidaris, N., et al. 2006, ApJ, submitted (this issue)
- Le Floc’h et al. (2006) Le Floc’h, E., et al. 2006, ApJ, submitted (this issue)
- Lehmer et al. (2002) Lehmer, B. D., et al. 2005, ApJS, 161, 21
- Lilly et al. (1995) Lilly, S. J., Hammer, F., Le Fevre, O., & Crampton, D. 1995, ApJ, 455, 75
- Lilly & The zCOSMOS Team (2005) Lilly, S., & The zCOSMOS Team. 2005, The Messenger, 121, 42
- Lin et al. (2006) Lin, L., et al. 2006, ApJ, submitted (this issue; astro-ph/0607272)
- Magnier & Cuillandre (2004) Magnier, E. A., & Cuillandre, J.-C. 2004, PASP, 116, 449
- Miyaji et al. (2004) Miyaji, T., et al. 2004, AJ, 127, 3180
- Moustakas et al. (2006) Moustakas, L., et al. 2006, ApJ, submitted (this issue; astro-ph/0607239)
- Nandra et al. (2005) Nandra, K., et al. 2005, MNRAS, 356, 568
- Nandra et al. (2006) Nandra, K., et al. 2006, ApJ, in press (this issue; astro-ph/0607270)
- Noeske et al. (2006a) Noeske, K. G., et al. 2006a, ApJ, submitted (this issue)
- Noeske et al. (2006b) Noeske, K. G., et al. 2006b, ApJ, submitted (this issue)
- Pierce et al. (2006) Pierce, C. M., et al. 2006, ApJ, submitted (this issue)
- Rhodes et al. (2000) Rhodes, J., Refregier, A., & Groth, E. J. 2000, ApJ, 536, 79
- Rieke et al. (2004) Rieke, G. H., et al. 2004, ApJS, 154, 25
- Rix et al. (2004) Rix, H.-W., et al. 2004, ApJS, 152, 163
- Sarajedini et al. (2006) Sarajedini, V., et al. 2006, ApJS, in press (astro-ph/0605370)
- Simard et al. (2002) Simard, L., et al. 2002, ApJS, 142, 1
- Sirianni et al. (2005) Sirianni, M., et al. 2005, PASP, 117, 1049
- Steidel et al. (2003) Steidel, C. C., Adelberger, K. L., Shapley, A. E., Pettini, M., Dickinson, M., & Giavalisco, M. 2003, ApJ, 592, 728
- Stetson (1987) Stetson, P. B. 1987, PASP, 99, 191
- Symeonidis et al. (2006) Symeonidis, M., et al. 2006, ApJ, submitted (this issue)
- Vogt et al. (2005) Vogt, N. P., et al. 2005, ApJS, 159, 41
- Weiner et al. (2005) Weiner, B. J., et al. 2005, ApJ, 620, 595
- Weiner et al. (2006) Weiner, B. J., et al. 2006, ApJ, submitted (this issue)
- Willner et al. (2006) Willner, S. P., et al. 2006, AJ, submitted
- Wilson et al. (2006) Wilson, G., et al. 2006, ApJ, submitted (this issue)
- York et al. (2000) York, D. G., et al. 2000, AJ, 120, 1579