The X-ray spectrum of the bursting atoll source 4U 1728-34 observed with INTEGRAL
We present for the first time a study of the 3–200 keV broad band spectra of the bursting atoll source 4U 1728-34 (GX 354-0) along its hardness intensity diagram. The analysis was done using the INTEGRAL public and Galactic Center deep exposure data ranging from February 2003 to October 2004. The spectra are well described by a thermal Comptonization model with an electron temperature from 35 keV to 3 keV and Thomson optical depth, , from 0.5 to 5 in a slab geometry. The source undergoes a transition from an intermediate/hard to a soft state where the source luminosity increases from 2 to 12% of Eddington. We have also detected 36 type I X-ray bursts two of which show photospheric radius expansion. The energetic bursts with photospheric radius expansion occurred at an inferred low mass accretion rate per unit area of g cm-2 s-1, while the others at a higher one between g cm-2 s-1. For 4U 1728-34 the bursts’ total fluence, and the bursts’ peak flux are anti-correlated with the mass accretion rate. The type I X-ray bursts involve pure helium burning either during the hard state, or during the soft state of the source.
Key Words.:
binaries: close – stars: individual (4U 1728-34) – stars: neutron – X–rays: bursts1 Introduction
Low-mass X-ray binary systems (LMXBs), consisting of an accreting neutron star (NS) and a main-sequence donor star (M 1 M⊙), are usually classified as atoll or Z sources, according to the path they describe in an X-ray colour-colour diagram (CCD) or hardness-intensity diagram (HID). The main difference between atoll and Z sources is in the accretion rate, the magnetic field and probably in the spin rate and the geometry of the system. For atoll sources, the positions along the characteristic branches have historically been called the “island”, “lower banana” and “upper banana” branches, which indicate the spectral states probably as a function of the mass accretion rate (Hasinger & van der Klis, 1989). The mass accretion rate increases from the island state (hard spectral states) where the soft emission is much reduced and the spectrum is dominated at high energies up to 200 keV, to the banana states (soft spectral states) where most of the energy is emitted below keV (e.g., Barret, 2001; Gierliǹski & Done, 2002).
The atoll sources show luminosities smaller than those of Z sources (generally less than 10 per cent of Eddington, ), low magnetic fields (BG), and spectral variability, or equivalently, motion along the banana branch over a timescale of hours to days, and more slowly in the island state from days to weeks.
Some atoll sources also show time variability properties in their power spectra, such as Quasi-Periodic Oscillations (QPOs), which are strongly correlated with the position on the CCD/HID (Hasinger & van der Klis, 1989). Almost all the timing features characterizing the power density spectra of these sources seem to vary in a smooth and monotonic way when the source moves along its CCD/HID (Wijnands & van der Klis, 1999; Psaltis, Belloni & van der Klis, 1999), implying a tight correlation between spectral and temporal behaviour (for a review see van der Klis, 2004). In most atoll sources, QPOs are observed in the frequency range from millihertz to the kilohertz. Kilohertz QPOs or twin kHz QPOs in the frequency range from 300–1200 Hz are usually observed in the island state and lower banana branch (van der Klis, 2004, and references therein).
In some of the atoll sources, type I X-ray bursts are also observed (e.g., Lewin & Joss, 1983). Type I X-ray bursts are characterized by a fast rise and exponential decay with durations ranging from seconds to tens of minutes. These bursts are due to unstable hydrogen/helium burning in a thin shell on the NS surface (see e.g., the review by Lewin, van Paradjis, & Taam, 1993). The burst spectrum can be described by blackbody radiation with cooling during the decay of the burst. The gradual decay persists longer at lower energies, indicating that the burst spectrum is characterized by steadily decreasing blackbody temperatures (e.g., Lewin & Joss, 1983). During these bursts nearly-coherent oscillations are sometimes observed, the frequencies of which are in the rather narrow range between 300 and 600 Hz (Strohmayer & Markwardt, 1999; Strohmayer & Bildsten, 2004). This frequency is interpreted as the NS rotation frequency due to a hot spot (or spots) in an atmospheric layer of the rotating NS (Chakrabarty et al., 2003).
The CCDs diagrams and HIDs are powerful ways of parameterizing the spectral changes using physically motivated spectral models to understand the underlying physical changes in the source emission. In this work, we study for the first time the broad band (3-200 keV) spectral shape of the atoll source 4U 1728-34 as a function of its HID position. The correlation of type I X-ray burst properties with source state in the HID is also investigated. We analyze the International Gamma-Ray Astrophysics Laboratory (INTEGRAL) 2003/2005 data concentrating also on the high energy emission of 4U 1728-34. This paper deals only with type I X-ray bursts, therefore whenever we write burst(s), we mean type I X-ray burst(s).
1.1 The source 4U 1728-34
The persistent LMXB source 4U 1728-34 (or GX 354-0) is a well known burster discovered by Uhuru and classified as an atoll source from its colour-colour diagram and timing properties (Forman, Tananbaum & Jones, 1976; Hoffman et al., 1976; Hasinger & van der Klis, 1989). However, little is known about the system as the optical counterpart is not identified due to the high optical extinction in the direction of the Galactic center. The distance is poorly known, the current estimate being between 4.4–5.1 kpc using photospheric radius expansion burst luminosity as a standard candle (Di Salvo et al., 2000; Galloway et al., 2003). This is based on the assumption that the bolometric burst peak luminosity during photospheric radius expansion is saturated at the Eddington limit.
The time averaged persistent soft ( keV) to hard (300 keV) X-ray emission spectrum of 4U 1728-34 was studied in the past using Einstein, SAS 3, EXOSAT SIGMA and ROSAT data (Grindlay & Hertz, 1981; Basinska et al., 1984; White et al., 1986; Claret et al., 1994; Schulz, 1999) and, more recently, using RXTE, BeppoSAX, ASCA and Chandra (Di Salvo et al., 2000; Piraino, Santangelo & Kaaret, 2000; Narita, Grindlay & Barret, 2001; D’Aì et al., 2006). The spectrum was well fitted by a thermal bremsstrahlung or thermal Comptonization model as well as a Gaussian emission line at the energy 6.7 keV. Different spectral parameters were found for the electron temperature and Thomson optical depth, which can be explained by the varying state of the source in its CCD/HID position.
During all spectral states, bursts of 10–20 s duration were observed (e.g., Cornelisse et al., 2003). The burst spectrum can be fitted by a blackbody with temperature increasing from 1 to 3 keV during the burst rise time. Most of these bursts show evidence for photospheric radius expansion (Hoffman et al., 1976; White et al., 1986; Day & Tawara, 1900; Foster, Ross, & Fabian, 1986; Franco, 2001; van Straaten, 2001; Galloway et al., 2003, 2006). Flux oscillations at 363 Hz during the bursts were discovered in this source with the Rossi X-ray Timing Explorer (RXTE), and interpreted as the spin frequency of the NS (Strohmayer et al., 1996; Chakrabarty et al., 2003). Apart from the bursting activity, 4U 1728-34 also exhibits complex behaviour on short time scale. It was also the first neutron star LMXB to show twin kHz QPOs in the persistent emission with a frequency separation almost constant at Hz (e.g., Méndez & van der Klis, 1999; Di Salvo et al., 2001; Migliari, van der Klis, & Fender, 2003, and references therein).
2 Observations and Data
The present data set was obtained with the INTEGRAL observatory (Winkler et al., 2003) using the 2003/2005 Core Program Galactic Center Deep Exposure observations and publicly available data. We analyzed data from the Imager on Board the Integral Satellite (IBIS) coded mask INTEGRAL Soft Gamma-Ray Imager (ISGRI) (Ubertini et al., 2003; Lebrun et al., 2003) at energies between 20 and 200 keV and from the JEM-X monitor, module 1 and 2 (Lund et al., 2003) between 3 and 20 keV. For ISGRI and JEM-X, the data were extracted for all pointings within from the source direction. The available data consist of 356 individual pointings for a total effective exposure of 640 ks. Data reduction was performed using the standard Offline Science Analysis (OSA) software version 5.0 distributed by the INTEGRAL Science Data Centre (ISDC) (Courvoisier et al., 2003). The algorithms used in the IBIS/ISGRI analysis are described in Goldwurm et al. (2003).
The brightest bursts were detected using the INTEGRAL Burst Alert System (IBAS) software (Mereghetti et al., 2003) running at ISDC. IBAS is dedicated to the real time discovery and localization of gamma-ray bursts, transient X-ray sources and bursts in the IBIS/ISGRI data stream. Bursts are identified by scanning the data binned using different timescales (from a few milliseconds to 100 s) and energy ranges. One of IBAS operation modes, running on the 15–40 keV energy interval and 10 s time scale, is particularly suited to detect type I X-ray bursts. Typically the bursts are localized with a uncertainty. The fainter bursts were detected using 2 s rebinned JEM-X light curves in the 3–20 keV energy band. Most of the bursts detected with JEM-X were also detected with ISGRI in the 18–40 keV energy band, these flux excesses were confirmed also by the imaging as related to the source position. So, we call the bursts detected with IBAS “bright bursts” and the ones detected only with JEM-X “weak bursts”.
The burst light curves are based on events selected according to the detector illumination pattern for 4U 1728-34; for ISGRI we used an illumination threshold of 0.6 for the energy range 18–40 keV. For JEM-X we used the event list of the whole detector in the 3–6 keV, 6–12 keV and 12–20 keV energy band. In Table 1 we report the burst start time detected with INTEGRAL from February 2003 to January 2005. The start time for each burst was determined when the intensity was 10% of the peak above the persistent intensity level. Note that six of the IBAS detected bursts were outside of the JEM-X field of view. Due to the lack of the low energy data we excluded these bursts from the analysis. However we report the burst start times and durations (see Table 1).
3 Results
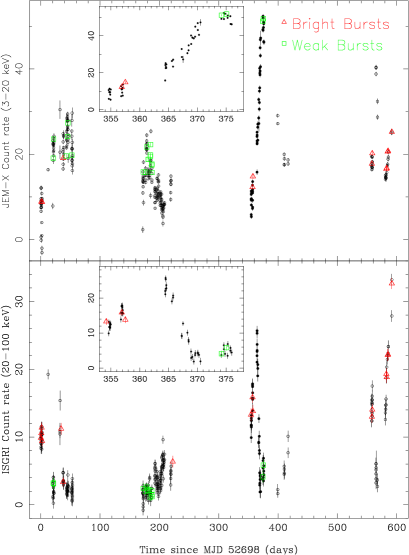
To study the light curves and spectra of 4U 1728-34 we first deconvolved and analyzed separately the 356 pointings and then combined them into a total mosaic image in the 20–40 keV energy band. In the mosaic 4U 1728-34 is clearly detected, as well as the nearby source the Rapid Burster (4U 1730-335). The source position offsets with respect to the catalog positions are for 4U 1728-34 and for the Rapid Burster. This is within the 90% confidence level assuming the source location error given by Gros et al. (2003). The derived angular distance between the two sources is . Due to the fact that INTEGRAL is able to image the sky at high angular resolution ( for ISGRI and for JEM-X), we were able to clearly distinguish and isolate the high-energy fluxes from the two sources. This allowed us to study the X-ray emission of 4U 1728-34 during its entire observation without contamination (see also for the Rapid Burster Falanga et al., 2004). In Fig. 1 we show the JEM-X (top) 3–20 keV and ISGRI (bottom) 20–100 keV light curves extracted from all the 356 images. Pointings during which bursts were detected are marked in red (bright burst) and green (weak burst). The source is very active and strong variations on a short time scale are not uncommon. Bursts were observed during all intensity states. We also observed an isolated strong flare (around 53058 MJD), during which the source count rate increases from 5 cts s-1 to 50 cts s-1 in the soft energy band, 3–20 keV, and shows a different trend at higher energy, 20–100 keV. During this flare, lasting days, the source undergoes a transition from a hard to a soft state (see Sect. 3.3). Note that during this flare two weak bursts happen at the peak of the 3–20 keV flux.
| Burst | IBIS/JEMX | IBIS/JEM-X | IBIS | JEMX | Burst | Parameters | ||||
|---|---|---|---|---|---|---|---|---|---|---|
| Nr. | Date | Tstart (UTC) | TBurst | Eb | Fpeak | |||||
| 1† | 2003 Feb 28 | 07:55:01 | 8.4(3) | – | – | – | – | – | – | – |
| 2† | 2003 Mar 01 | 00:04:45 | 8.2(3) | 6.8(5) | 1.7(2) | 8.3(3) | 9.6(3) | 8.6(6) | 0.012(4) | |
| 3† | 2003 Mar 01 | 16:05:27 | 9.4(3) | – | – | – | – | – | – | – |
| 4† | 2003 Mar 02 | 07:42:17 | 11.0(3) | 6.8(5) | 1.7(2) | 8.9(3) | 9.9(3) | 9.0(4) | 0.016(3) | |
| 5 | 2003 Mar 21 | 06:09:48 | 5.7(3) | 4.5(5) | 3.2(2) | 3.5(3) | 3.9(3) | 9.0(9) | 0.07(7) | – |
| 6 | 2003 Mar 21 | 15:46:38 | 3.5(3) | 3.6(5) | 4.3(2) | 3.2(2) | 7.9(2) | 4.1(3) | 0.051(2) | |
| 7† | 2003 Apr 03 | 08:40:16 | 4.2(3) | – | – | – | – | – | – | – |
| 8† | 2003 Apr 06 | 19:45:28 | 5.8(3) | 5.9(5) | 3.7(2) | 5.1(4) | 7.4(4) | 6.9(6) | 0.046(8) | – |
| 9 | 2003 Apr 12 | 07:12:20 | 3.2(5) | 3.5(2) | 2.6(2) | 4.4(2) | 5.8(5) | 0.073(6) | – | |
| 10 | 2003 Apr 14 | 09:05:15 | 3.4(5) | 3.7(2) | 1.9(2) | 3.4(2) | 5.5(7) | 0.103(8) | – | |
| 11 | 2003 Apr 14 | 20:13:47 | 5.0(5) | 4.5(3) | 2.7(3) | 3.8(2) | 7.1(9) | 0.111(8) | ||
| 12 | 2003 Apr 21 | 09:31:41 | 5.4(5) | 3.7(2) | 2.1(2) | 3.6(2) | 5.8(6) | 0.062(7) | – | |
| 13 | 2003 Apr 19 | 22:57:35 | 3.5(3) | 3.4(5) | 2.7(2) | 3.1(2) | 5.1(2) | 6.1(5) | 0.049(4) | – |
| 14 | 2003 Aug 23 | 16:14:00 | 4.2(3) | 5.0(5) | 2.7(2) | 3.5(2) | 6.1(2) | 5.7(4) | 0.042(4) | – |
| 15 | 2003 Aug 25 | 18:24:08 | 6.0(3) | 4.1(5) | 3.9(2) | 3.6(2) | 6.6(2) | 5.5(3) | 0.056(3) | – |
| 16 | 2003 Aug 28 | 01:23:58 | 7.6(3) | 3.6(5) | 3.2(5) | 3.9(5) | 5.5(5) | 7.1(6) | 0.055(5) | – |
| 17 | 2003 Aug 28 | 06:01:29 | 4.6(3) | 2.6(5) | 3.3(5) | 3.1(5) | 5.3(5) | 5.8(6) | 0.057(6) | |
| 18 | 2003 Aug 31 | 15:54:14 | 6.8(3) | 6.5(5) | 3.1(4) | 3.1(4) | 6.3(4) | 5.0(7) | 0.046(7) | – |
| 19 | 2003 Aug 31 | 20:00:09 | 4.0(3) | 3.5(3) | 1.9(4) | 3.9(4) | 4.9(9) | 0.08(1) | ||
| 20 | 2003 Aug 31 | 23:48:20 | 5.6(3) | 4.6(2) | 3.1(3) | 3.7(3) | 8.4(9) | 0.12(1) | ||
| 21 | 2003 Sep 03 | 03:26:33 | 5.0(3) | 3.1(5) | 3.1(3) | 3.8(5) | 7.1(5) | 5.3(8) | 0.04(7) | – |
| 22 | 2003 Sep 03 | 08:39:29 | 6.8(3) | 4.9(5) | 2.9(5) | 2.8(3) | 4.5(3) | 6.2(7) | 0.06(5) | |
| 23 | 2003 Sep 03 | 13:07:21 | 2.7(3) | 3.9(5) | 2.8(4) | 2.1(4) | 4.4(4) | 4.8(9) | 0.06(1) | |
| 24† | 2003 Oct 08 | 09:58:35 | 5.5(3) | – | – | – | – | – | – | – |
| 25† | 2004 Feb 17 | 04:47:27 | 9.9(3) | – | – | – | – | – | – | – |
| 26† | 2004 Feb 19 | 21:06:41 | 5.6(3) | 1.97(5) | 2.4(4) | 4.2(4) | 8.2(4) | 5.1(5) | 0.028(5) | – |
| 27† | 2004 Feb 20 | 12:00:21 | 6.3(5) | – | – | – | – | – | – | – |
| 28 | 2004 Mar 08 | 04:14:44 | 4.5(3) | 5.2(5) | 12.4(3) | 3.3(3) | 6.8(3) | 4.8(6) | 0.171(5) | – |
| 29 | 2004 Mar 09 | 00:58:20 | 4.9(3) | 3.6(5) | 10.4(4) | 3.5(4) | 6.9(4) | 5.0(7) | 0.14(5) | |
| 30 | 2004 Sep 07 | 21:30:45 | 5.0(3) | 3.1(5) | 3.8(3) | 4.2(3) | 7.0(3) | 6.0(6) | 0.056(5) | – |
| 31† | 2004 Sep 08 | 12:44:37 | 6.8(3) | 4.9(5) | 4.1(3) | 4.6(3) | 7.3(3) | 6.3(6) | 0.052(5) | |
| 32† | 2004 Oct 02 | 05:59:14 | 2.7(3) | 3.9(5) | 4.1(3) | 4.1(3) | 6.9(3) | 5.9(6) | 0.054(6) | – |
| 33† | 2004 Oct 02 | 21:51:07 | 6.1(3) | 5.5(5) | 3.7(4) | 3.6(4) | 7.7(4) | 4.7(5) | 0.074(5) | |
| 34† | 2004 Oct 04 | 12:29:37 | 4.5(3) | 5.2(5) | 4.7(3) | 3.9(3) | 7.3(3) | 5.3(5) | 0.059(6) | – |
| 35† | 2004 Oct 05 | 05:59:09 | 6.0(3) | 4.6(5) | 5.5(3) | 4.0(3) | 6.7(3) | 5.9(5) | 0.082(5) | |
| 36† | 2004 Oct 11 | 12:59:09 | 4.9(3) | 6.8(5) | 1.7(3) | 3.5(3) | 7.0(3) | 5.0(5) | 0.091(6) | – |
Notes : † bright type I X-ray bursts. not a statistically significant detection in ISGRI. The burst exponential decay time, , is in units of seconds in the 3–20 keV energy band. The mass accretion rate per unit area of the persistent emission before the bursts, , are expressed in units of g cm-2 s-1, assuming a canonical NS radius of 10 km. The net burst fluence, , and the net peak flux, , (both persistent emission subtracted) are in units of erg cm-2 and erg cm-2 s-1, respectively. The bursts parameters is in units of seconds, and is also listed for each burst. The quantity is defined as the ratio of the total energy emitted in the persistent flux to that emitted in bursts, , where is the time interval from the beginning of one burst to the next. We report only the most confident values, i.e. without data gap between two burst.
3.1 Burst light curves
In total, we observed 36 bursts, which we label numerically according to time. Their main properties are listed in Table 1. Based on JEM-X/ISGRI light curves in the 3–6 keV, 6–12 keV, 12–20 keV and 20–40 keV energy bands, rebinned at 0.5 s, we determined that the bursts have rise times of s. The decay time at 12–20 keV energy is significantly shorter than that in the 3–6 keV range, indicating spectral softening during each burst decay. This was also verified by determining hardness ratios, using the three JEM-X energy bands. For JEM-X the flux decays to quiescence with an mean exponential time-scale (see Table 1). At high energy, the bursts were only significantly detected in the first T 5–10 s (see Table 1). In Fig. 2 we show six JEM-X/ISGRI representative burst light curves in different energy bands. For bursts 2 and 4, a double peak profile is evident at high energy (lower panel) within the first 10 s, while during this time the intensity at lower energy (upper panel) remains constant. This can be interpreted as a consequence of a photospheric radius expansion (PRE) episode during the first part of the outburst (see e.g., Verbunt & van den Heuvel, 1995). When a burst undergoes a PRE episode, due to radiation pressure, the luminosity, , remains constant at the Eddington value, , and, at high energy, a double peak profile can be observed. Such behaviour is well known for 4U 1728-34 and was observed previously in different bursts and recently reported with RXTE data (Franco, 2001; van Straaten, 2001; Galloway et al., 2003, 2006).
We attempted to test the hypothesis of a PRE using the four different JEM-X/ISGRI energy bands and we measured such a double peak behaviour in the hardness ratio only for burst 2 and 4.

3.2 Hardness Intensity Diagram of the persistent emission
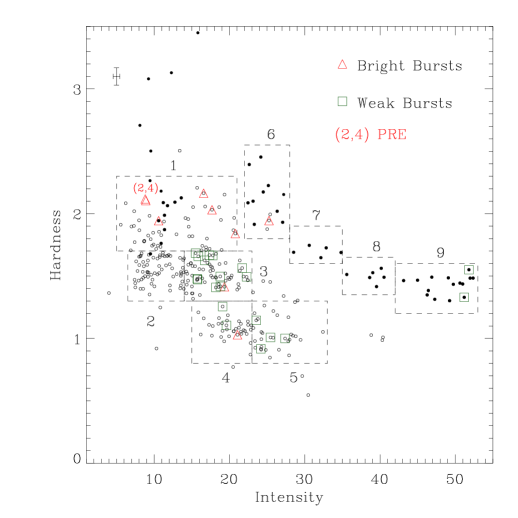
To generate a CCD (see for this source e.g., Hasinger & van der Klis, 1989; Di Salvo et al., 2001; Franco, 2001) we used the background subtracted and burst subtracted JEM-X light curve with a 500 s time resolution. We defined the soft colour as the logarithm of the ratio of the count rate in the energy range 3–4.8 keV to the count rate in the range 4.8–7.7 keV. Similarly, we defined the hard colour in the range 7.7–12.5 keV and 12.5–20 keV. In this case the CCD was inadequate as the colour errors were as large as the colour variation. In order to reduce the errors on the colours, we generated a HID based on the net count rates in the 3–6 keV and 6–20 keV obtained in the single individual pointings of 1800 s each. In our case the source behaviour is much better traced in the HID rather than in the CCD, because the statistical uncertainties are reduced along one of the two axes. The HID is shown in Fig. 3, with the positions superposed where the bursts were detected. Note that the patterns observed in a CCD are often also recognizable in the corresponding HID obtained by replacing soft colour by intensity, as applied e.g. on the Z sources GX 17+2 (Di Salvo et al., 2000; Farinelli et al., 2005), GX 5-1 (Muno, Remillard & Chakrabart, 2002) and on the atoll source Aql X-1 (Muno, Remillard & Chakrabart, 2002). This results from the intensity being dominated in the lower bands by soft photons whose thermal component correlates with temperature and therefore colour. The HID could indicate the banana branch of the atoll, with inferred accretion rate increasing along the atoll from left to right on the upper branch to the lower banana branch. To study the spectral variability of the source as a function of the HID position we divided the HID into nine regions, as shown in Fig. 3. The intervals were chosen in order to have good statistics for the spectral analysis. We averaged the different intensities with nearly the same hardness ratios and considering the nearness colours these spectra should be very similar. We also studied in more detail the 21 day long flare (see Fig. 1), divided among the boxes 6–9, represented by the filled dotted points in Fig. 3. The HID of the flare shows a transition from a hard to a soft state during 21 days with an intensity ratio (see Sect. 4). This trend held also for the persistent emission, which also moved from a hard to soft state (boxes 1–5). This overall trend can also be seen in the RXTE/ASM light curve (Fig. 7) for the period of this observation.
3.3 Spectral Analysis
The spectral analysis was done using XSPEC version 11.3 (Arnaud, 1996), combining the 20–200 keV ISGRI data with the simultaneous 5–20 keV JEM-X data. A constant factor was included in the fit to take into account the uncertainty in the cross-calibration of the instruments. The factor was fixed at 1 for the ISGRI data. A systematic error of 2% was applied to JEM-X/ISGRI spectra which corresponds to the current uncertainty in the response matrix. All uncertainties in the spectral parameters are given at a 90% confidence level for single parameters. For the source distance we use 4.5 kpc (Galloway et al., 2003, 2006).
3.3.1 Persistent emission variability
We studied the spectra of 4U 1728-34 along the atoll pattern for the different boxes reported in Fig. 3. A broad band 3–200 keV spectrum was obtained for each box using the joint JEM-X/ISGRI data and removing the time intervals corresponding to the bursts.
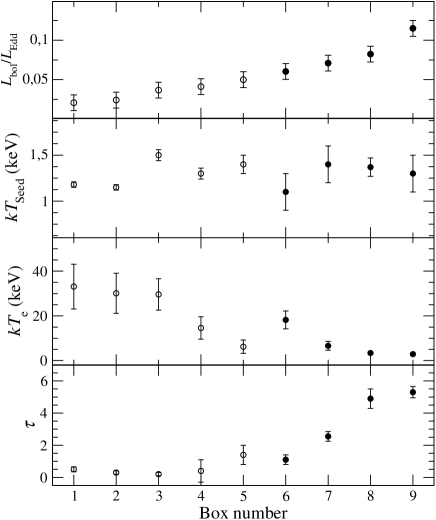
Atoll source spectra are successfully fitted by a two-component model consisting of a multicolour blackbody soft X-ray emission and a Comptonized spectrum, for the hard X-ray emission. The emission from the accretion shock on a neutron star is expected to be produced by thermal Comptonization of soft seed photons from the star, or from an optically thick boundary layer between accretion disc and NS surface (e.g., Zeldovich & Shakura, 1969; Alme & Wilson, 1973). We model the shock emission by the comptt model (, 1994) which is an analytic model describing Comptonization of soft photons in a hot plasma. We approximate the accretion shock geometry by a plane-parallel slab at the neutron star surface. The main model parameters are the Thomson optical depth across the slab, , the electron temperature, , and the seed photon temperature, . The soft thermal emission, , believed to be produced by the disc, is fitted by a multi-temperature disc model of (Mitsuda et al., 1984). We were not able to constrain the interstellar column density (as the JEM-X bandpass starts above 3 keV), so we have set to the value 2.5 observed by ROSAT and BeppoSAX. We add to the fit a Gaussian line around 6.4 keV with a fixed width at keV as observed previously (e.g., Di Salvo et al., 2000; Piraino, Santangelo & Kaaret, 2000), but it was not statistically required. The multi-temperature disc model was also not required in the fit during the low/hard state. Soft emission (presumably from the accretion disc) during this state is difficult to detect since the JEM-X bandpass begins at 3 keV. Compton reflection between 10–30 keV was not required by the fit. The best fit parameters for each box are reported in Table 2 and in Fig. 5. For all the fits, the normalization constants of the JEM-X response were within . The nine unabsorbed spectra and the residuals of the data to the model are shown in Fig. 4.

| Box 1 | Box 2 | Box 3 | Box 4 | Box 5 | Box 6 | Box 7 | Box 8 | Box 9 | |
|---|---|---|---|---|---|---|---|---|---|
| Parameter | (diskbb + comptt) | ||||||||
| (kev) | – | 0.54 | 0.7 | 0.6 | 0.6 | – | 0.73 | 0.78 | 0.65 |
| – | 40 | 20 | 62 | 58 | – | 30 | 27 | 69 | |
| (keV) | 1.18 | 1.15 | 1.5 | 1.3 | 1.4 | 1.1 | 1.4 | 1.37 | 1.3 |
| (keV) | 34.9 | 32.1 | 29.6 | 14.6 | 6.2 | 18.2 | 6.6 | 3.4 | 2.9 |
| 0.5 | 0.3 | 0.2 | 0.4 | 1.4 | 1.1 | 2.55 | 4.9 | 5.3 | |
| 146/133 | 144/144 | 150/139 | 149/134 | 123/131 | 160/134 | 160/136 | 129/130 | 126/133 | |
| (erg s-1) | 3.8 | 4.4 | 6.7 | 7.5 | 9.1 | 1.1 | 1.3 | 1.5 | 2.1 |
a Assuming a distance of 4.5 kpc. The diskbb normalization is .
3.3.2 X-ray burst spectra
To study the net bursts’ spectra, we first extracted the persistent emission spectrum excluding the outburst interval. We verified that during each burst pointing the count rate was stable, then we used the same fit models as described in Sect. 3.3.1 to fit the data. In Table 1 we report the mass accretion rate per unit area, , of the persistent emission for each burst pointing. This is given by , where Aacc is the area covered by . We assume a 10 km radius for the neutron star. The persistent mass accretion rate, , is calculated from c-2, where is the accretion efficiency for a NS. The bursts occurred at a persistent emission level 2–8% .
We then studied the net bursts’ time averaged spectra using for each burst the persistent emission spectra as background. The low statistics of JEM-X/ISGRI do not allow us to study the spectral evolution during the bursts. The spectra were extracted over the whole duration of each burst as determined from the JEM-X light curves. We also included in the fit the ISGRI spectra in the 18–40 keV energy bands. All obtained spectra were fitted by a photoelectrically absorbed blackbody. The unabsorbed flux between 0.1–200 keV, , was calculated according to erg cm-2 s-1, where is the blackbody temperature in unit of keV and is the normalization of the blackbody component as returned by the fitting program. The blackbody temperature of the time averaged burst spectrum, kTbb, was between 1.8 keV and 2.4 keV. The burst fluence, , is calculated by integrating the measured over the burst duration. The burst peak flux, , was calculated by converting the peak count rate to flux using the averaged spectrum of each burst. Taking into account the typical blackbody temperature variation within the bursts (van Straaten, 2001), the associated error on our conversion factor is of the order of 12%, which is within our statistical errors. The best fit results and calculated burst parameters are reported in Table 1.
4 Discussion
4.1 Origin of X-ray emission
We have fitted the 3–200 keV spectra of the atoll source 4U 1728-34 along its track on the HID by a two-component model: a thermal Comptonization model together with a soft component. The spectra and the parameters are shown in Fig. 4 and Fig. 5, respectively (see Table 2). The change in the spectral shape between the hard state (box/spectrum 1) and the soft state (box/spectrum 5) is clearly visible, as also during the flare (box/spectra 6–9), probably caused by a dramatic change in the accretion flow geometry. During the spectral evolution, spectra 1–5, at low intensity the optical depth was with a high plasma temperature keV (box 1), and at higher intensity the optical depth was with a plasma temperature as low as keV (box 5). During this spectral change the luminosity increases from to 0.05 , where the seed photons temperature was almost constant at keV. The same behaviour is observed also during the flare event (box 6–9) where the plasma temperature decreases from to 3 keV and the optical depth increases from 1 to 5 and the spectral change the luminosity increases from to 0.12 . We observe a typical atoll spectral change from a low or intermediate/hard state to a high/soft state, where the accretion rate increases from the hard state to the soft state. The soft component could be associated with the radiation from the accretion disc.
With our coverage of luminosity variation, , observed during days integration time between 2003 February and 2004 October we are probably not observing the full atoll track, even during the flare (see Fig. 3) . We observe the source most likely from a intermediate/hard state, upper banana, to the soft state, lower banana state, and probably not during the island state. If the source was in the island state, we could also expect that more then two bursts with PRE are observed (see Sect. 4.2). The hard component observed during the hard/intermediate state is explained with Comptonization of seed photons from a NS surface by hot electrons in an inner optically thin accretion flow (or outer boundary layer). The optically thin Comptonization medium has temperature of keV. The observed plasma temperature and optical depth during the spectra 1–3 are typically hard/intermediate state parameters, only during the flare we observe typically lower banana state parameters. In the lower banana branch spectra the Comptonized component is much softer, with temperature of keV and optical depth of as observed during the spectra 5–9.
From our fits it results that the hard spectra can be described by unsaturated Comptonization of soft photons in the hot keV optically thin plasma. However, different models have been proposed to explain the different emission region and emission mechanism during the different spectral states and evolution (Mitsuda et al., 1989; Zeldovich & Shakura, 1969; Alme & Wilson, 1973; White, Stella & Parmer, 1988).
If the soft photons are emitted from a disc, then the inner disc radius can be estimated from the diskbb model as
| (1) |
where D is the source distance, is the inclination angle of the system, is the ratio of the colour to effective temperature (Shimura & Takahara, 1995) and is the correction factor for the inner torque-free boundary condition (Gierliǹski et al., 1999, = 2.7 for and less for higher ). With kpc, and using a mean inclination angle of we find km. For 4U 1728-34 the observed QPO are related on their position in the CCD/HID (Méndez & van der Klis, 1999; Di Salvo et al., 2001; Migliari, van der Klis, & Fender, 2003). Among the most frequently used QPO models, the upper kHz QPO is related to the Kepler frequency, i.e. 1184 Hz (/15 km), at the innermost stable orbit of the accretion disc (for a review see van der Klis, 2004, and reference therein). Using our measured inner disc radius, , the upper kHz QPO has to be in the frequency range from Hz to Hz. These values are consistent with the upper kHz QPO values of 4U 1728-34 (Di Salvo et al., 2001). However, using this relation we are not able to exactly locate the source position in the CCD/HID.
We have measured the plasma temperature, optical depth, and flux of 4U 1728-34 over a range of positions on the HID for the first time. We compare with previously reported time averaged spectra (Grindlay & Hertz, 1981; Basinska et al., 1984; White et al., 1986; Claret et al., 1994; Schulz, 1999; Di Salvo et al., 2000; Piraino, Santangelo & Kaaret, 2000; Narita, Grindlay & Barret, 2001; D’Aì et al., 2006). Accounting for the fact that these authors have reported time averaged spectra sometimes over possibly different spectral states, and sometimes only in energy ranges less than 20 keV, and insofar as the models used to fit the data are consistent, we found that all the previous reported spectral parameters are consistent with our measurements. For example, Claret et al. (1994), using SIGMA (30-200 keV) data, measured plasma temperatures KTe of and keV in two different source states. These correspond to our reported soft and hard states. Also using a broad band spectrum, BeppoSAX observed the source with kT keV and , also consistent with an intermediate soft state. We would like to point out, in order to determine the source states with more confidence, how important it is for 4U 1728-34 to have: a high energy spectrum above 20 keV, and not to average the spectra over a long time period. using the JEM-X and ISGRI broad band spectrum (box 1) from 3–200 keV, in the intermediate/hard state, the thermal Comptonization plasma temperature was 35 keV, considerably higher than the value ( keV) derived from the low energy 3–20 keV JEM-X data alone. a flux variation of a factor 1.12 will already change the spectral parameters and a factor 2 will drastically change the source state (see Table 2). Note also, e.g., that during the flare we have in the 3–20 keV band which corresponds to a flux variation of in the 3–200 keV band. This shows again for 4U 1728-34 how important the energy contribution is above 20 keV.
4.2 Type I X-ray bursts
More than 200 bursts have been observed in 4U 1728-34 since its discovery (Hoffman et al., 1976; White et al., 1986; Basinska et al., 1984; Foster, Ross, & Fabian, 1986; Day & Tawara, 1900; Franco, 2001; van Straaten, 2001; Galloway et al., 2003, 2006). Compared to the previously observed bursts, ours appear as ordinary bursts observed for this source. All the detected bursts have a rise time about 1 s with a e-fold decay time from 3–7 s in the 3–20 keV energy band. Most of the bursts are observed up to 30–40 keV during the first 5–10 s, and the energetic ones are observed at the lowest inferred mass accretion rate (see Fig. 3). Such behaviour was observed e.g., also for GX 3+1, where a super burst and a unusually long burst occurred at the lowest mass accretion rate (Kuulkers & van der Klis, 2000; Chenevez et al., 2006).
The averaged spectrum during the burst measured a blackbody temperatures from 1.8 to 2.4 keV with a bolometric flux from to erg cm-2 s-1, respectively. This corresponds to an effective emission radius (i.e., where is the gravitational redshift correction and is the Stefan-Boltzman constant), , from d d4.5kpc km, assuming a NS radius of 10 km, a NS mass of 1.4 M⊙ and isotropic emission. This emission radius could be attributed to an extended part of the NS surface.
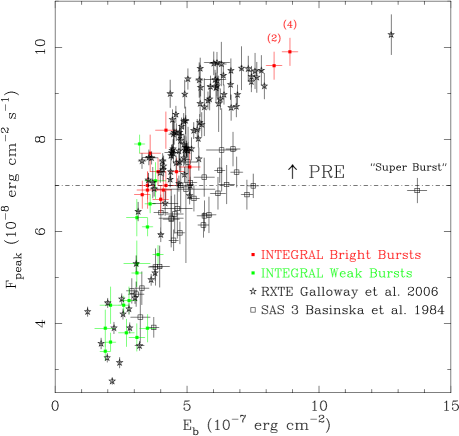
In Fig. 6 we show the bursts’ peak flux, , plotted as a function of the integrated burst flux, , including the 32 and 104 bursts observed by SAS 3 and RXTE (Basinska et al., 1984; Galloway et al., 2006). Note that a subset of the RXTE bursts were reported and discussed in (Galloway et al., 2003). Most of the bursts with a higher peak flux as erg cm-2 s-1 show double-peaked behaviour, these energy-dependent double-peaked profile are also the result of PRE. All the bursts below the dashed line are bursts without PRE. The INTEGRAL bursts, excluding bursts with PRE, occurred at a persistent emission flux minimum and maximum level of and erg cm-2 s-1 ( g cm-2 s-1), respectively (3–20 keV). The values without PRE observed by SAS 3 (Basinska et al., 1984) are within the INTEGRAL observation. The averaged value of the persistent emission during the SAS 3 observation was erg cm-2 s-1 (1-20 keV) and varied by a factor . The INTEGRAL bursts with PRE, burst 2 and 4, occurred at the lowest mass accretion rate of g cm-2 s-1. The bursts total fluence, and the bursts peak flux are anti-correlated with the mass accretion rate. From a 30 days averaged RXTE/ASM light curve (1.5–12 keV) (Levine et al., 1996) the persistent flux of 4U 1728-34 shows a variation of about a factor three on a yr time scale and INTEGRAL observed 4U 1728-34 during a bright persistent emission phase (see Fig. 7). Indeed the only two bursts with PRE where observed at the the lowest mass accretion rate at the start of the INTEGRAL observation, all other bursts without PRE are observed at higher mass accretion rate.
The lowest inferred mass accretion rate at the erg cm-2 s-1 line (see Fig. 6) is g cm-2 s-1. From the observed burst properties (see Table 1) and inferred mass accretion rates, the present theory predicts that these bursts are pure helium burning (e.g. Strohmayer & Bildsten, 2004). For helium flashes, the fuel burns rapidly, since there are no slow weak interactions, and the local Eddington limit is often exceeded. These conditions lead to PRE bursts with a duration, set mostly by the time it takes the heat to escape, of the order of 5–10 s, as observed. The INTEGRAL-observed bursts without PRE with a mass accretion rate of g cm-2 s-1 could also arise from helium burning. In the framework of the thermonuclear-flash models (e.g., Lewin, van Paradjis, & Taam, 1995) the burst duration, s, and the ratio of the observed persistent flux to the net peak flux, , indicate a hydrogen-poor burst, i.e., pure helium bursts. We found a good agreement with the predicted amount of liberated helium fuel during the bursts with the observed accreted mass between two bursts (calculated only for the bursts with known parameter). The amount of fuel liberated in the thermonuclear burning is calculated as L, where Lb is the observed burst total fluence and Mev/nucleon erg g-1 is the He energy release. For instance, for burst 2, g is in agreement with the predicted amount of liberated helium fuel during this burst L g. We observed pure helium bursts during the different spectral states. 4U 1728-34 shows the same burst properties as the ultracompact 10 minute binary 4U 1820-30 (Cumming, 2003). In Fig. 6 we also show the so-called “super burst” by Basinska et al. (1984). Super bursts, as currently understood and observed, have a duration of several hours, a total fluence of erg and are believed to be due to unstable burning of a thick carbon layer (e.g. Strohmayer & Bildsten, 2004). The observed “super burst” by Basinska et al. (1984) was most likely also a helium burst with PRE triggered after a longer burst recurrence time.

5 Summary
We analyzed the spectral and bursting behaviour from the simultaneous INTEGRAL IBIS/ISGRI and JEM-X observation of 4U 1728-34, which was spatially well distinguished from the neighbouring source, the Rapid Burster. The broad band spectra from 3–200 keV is well described by a thermal Comptonization model with seed photons from the neutron star surface scattered in a shock-heated accretion column above the hot spot region, or from an optically thick boundary layer between accretion disc and NS surface. The thermal blackbody soft emission could arise from the accretion disc. The spectral evolution observed from an intermediate/hard state to the soft state are entirely typical of atoll sources. With increasing mass accretion rate the source spectra become brighter and softer. We observed a decreasing electron temperature from 35–3 keV an increase of the optical depth from 0.5–5, during the source luminosity increase from 2-12% of Eddington, i.e. from the intermediate/hard state to the soft state.
The 36 type I bursts show an anti-correlation between burst peak flux or fluence with the mass accretion rate. At low mass accretion rate, intermediate/hard state, most of the bursts show PRE with a peak flux exceeding the Eddington luminosity, at higher mass accretion rate, soft state, the bursts were normal type I bursts. We observed normal X-ray bursts for this source involving pure helium either during PRE in the intermediate/hard state, or during the soft state.
Acknowledgements.
MF and DG acknowledge the French Space Agency (CNES) for financial support. MF is grateful to D. Galloway for providing us with the RXTE data used in Figure 6 and for valuable discussions. The data reported in this paper are based on observations with INTEGRAL, an ESA project with instruments and the science data center funded by ESA member states (especially the PI countries: Denmark, France, Germany, Italy, Switzerland, Spain), Czech Republic and Poland, and with the participation of Russia and the USA. ISGRI has been realized and maintained in flight by CEA-Saclay/DAPNIA with the support of CNES.References
- Alme & Wilson (1973) Alme, M. L., & Wilson, J. R. 1973, ApJ, 186, 1015
- Arnaud (1996) Arnaud, K. A. 1996, in Astronomical Data Analysis Software and Systems V. ed. G. H. Jacoby, & J. Barnes, ASP Conf. Series 101 (San Francisco: ASP), 17
- Barret (2001) Barret, D. 2001, AdSpR, 28, 307
- Basinska et al. (1984) Basinska, E. M., Lewin, W. H., Sztajno, M., Cominsky, L. R., Marshall, F. J. 1984, ApJ, 281, 337
- Cumming (2003) Cumming, A. 2003, ApJ, 595, 1077
- Chenevez et al. (2006) Chenevez, J., Falanga, M., Brandt, S. 2006, A&A, 449, L5
- Chakrabarty et al. (2003) Chakrabarty, D., Morgan, E. H., Muno, M. P., et al. 2003, Nature, 424, 42
- Claret et al. (1994) Claret, A., Goldwurm, A., Cordier, B., et al. 1994, ApJ, 423, 436
- Cornelisse et al. (2003) Cornelisse, R., in’t Zand, J. J. M., Verbunt, F., et al. 2003, A&A, 405, 1033
- Courvoisier et al. (2003) Courvoisier, T. J.-L., Walter, R., Beckmann, V., et al. 2003, A&A, 411, L57
- D’Aì et al. (2006) D’Aì, A., Di Salvo, T., Iaria, et al. 2006, A&A, 448, 817
- Day & Tawara (1900) Day, C. S. R., & Tawara, Y. 1990, MNRAS, 245, 31
- Di Salvo et al. (2000) Di Salvo, T., Iaria, R., Burderi, L., Robba, N. R. 2000, ApJ, 542, 1034
- Di Salvo et al. (2000) Di Salvo, T., Stella, L., Robba, N. R., et al. 2000, ApJ, 544, L199
- Di Salvo et al. (2001) Di Salvo, T., Méndez, M., van der Klis, M., et al. 2001, ApJ, 546, 1007
- Falanga et al. (2004) Falanga, M., Farinelli, R., Goldoni, P., et al. 2004, A&A, 426, 979
- Farinelli et al. (2005) Farinelli, R., Frontera, F., Zdziarski, A. A., et al. 2005, A&A, 434, 25
- Forman, Tananbaum & Jones (1976) Forman, W., Tananbaum, H. & Jones, C. 1976, ApJ, 206, L29
- Foster, Ross, & Fabian (1986) Foster, A., J, Ross, R. R., & Fabian, A. C. 1986, MNRAS, 221, 409
- Franco (2001) Franco, L. M., 2001, ApJ, 554, 340
- Galloway et al. (2003) Galloway, D. K., Psaltis, D., Chakrabarty, D., Muno, M. P. 2003, ApJ, 590, 999
- Galloway et al. (2006) Galloway, D. K., et al. 2006, in preparation
- Goldwurm et al. (2003) Goldwurm, A., Daid, P., Foschini, L., et al. 2003, A&A, 411, L223
- Gros et al. (2003) Gros, A., Goldwurm, A., Cadolle-Bel, M., et al. 2003, A&A, 411, L179
- Gierliǹski et al. (1999) Gierliǹski, M., Zdziarski, A. A., Poutanen, J., et al. 1999, MNRAS, 309, 496
- Gierliǹski & Done (2002) Gierliǹski, M., Done, C. 2002, MNRAS, 337, 1373
- Grindlay & Hertz (1981) Grindlay, J. E., & Hertz, P. 1981, ApJ, 247, L17
- Hoffman et al. (1976) Hoffman, J. A., Lewin, W. H. G., Doty, J., et al. 1976, ApJ, 210, L13
- Hasinger & van der Klis (1989) Hasinger, G., & van der Klis, M. 1989, A&A, 225, 79
- Lebrun et al. (2003) Lebrun, F., Leray, J.-P., Lavocate, Ph., et al. 2003, A&A, 411, L141
- Levine et al. (1996) Levine, A. M., Bradt, H., Cui, W. 1996, ApJ, 469, L33
- Lewin, van Paradjis, & Taam (1995) W. H. G. Lewin, J., van Paradjis, & R. E., Taam, in X-ray Binaries, eds. W. H. G. Lewin, J., van Paradjis, & E. P., J., van den Heuvel, 1995, (Cambridge Univ. Press)
- Lewin, van Paradjis, & Taam (1993) Lewin, W. H. G., van Paradjis, J., & Taam, R. 1993, Space Sci. Rev., 62, 223
- Lewin & Joss (1983) W. H. G. Lewin, & P. C. Joss, in Accretion-Driven Stellar X-ray Sources, eds. W. H. G. Lewin &E. P., J., van den Heuvel, 1983, (Cambridge Univ. Press)
- Lund et al. (2003) Lund, N., Budtz-Joergensen, C., Westgaard, N. J., et al. 2003, A&A, 411, L231
- Mereghetti et al. (2003) Mereghetti, S., Götz, D., Borkowski, R., et al. 2003, A&A, 411, L291
- Méndez & van der Klis (1999) Méndez, M., & van der Klis, M. 1999, ApJ, 517, L51
- Migliari, van der Klis, & Fender (2003) Migliari, S., van der Klis, M., & Fender, R. P. 2003, MNRAS, 345, L35
- Mitsuda et al. (1984) Mitsuda, K. K., Inoue, H., Koyama, K., et al. 1984, PASJ, 36, 741
- Mitsuda et al. (1989) Mitsuda, K., Inoue, H., Nakamura, N., Tanaka, Y., et al. 1989, PASJ, 41, 97
- Muno, Remillard & Chakrabart (2002) Muno, M. P., Remillard, R., A., Chakrabarty, D., 2002, ApJ, 568, L35
- Narita, Grindlay & Barret (2001) Narita, T., Grindlay, J. E., & Barret, D. 2001, ApJ, 547, 420
- Piraino, Santangelo & Kaaret (2000) Piraino, S., Santangelo, A., & Kaaret, P. 2000, A&A, 360, L35
- Psaltis, Belloni & van der Klis (1999) Psaltis, D., Belloni, T., van der Klis, M. 1999, ApJ, 520, 262
- Kuulkers & van der Klis (2000) Kuulkers, E. & van der Klis, M. 2000, A&A, 356, L45
- Poutanen & Svensson (1996) Poutanen, J., & Svensson, R. 1996, ApJ, 470, 249
- Schulz (1999) Schulz, N. S. 1999, ApJ, 511, 304
- Shimura & Takahara (1995) Shimura, T., & Takahara, F. 1999, ApJ, 445, 780
- Strohmayer et al. (1996) Strohmayer, T. E., Zhang, W., Swank, K. H., et al. 1996, ApJ, 469, L9
- Strohmayer & Markwardt (1999) Strohmayer, T. E., Markwardt, C. B., 1999, ApJ, 516, L81
- Strohmayer & Bildsten (2004) Strohmayer, T. E.,& Bildsten, L. 2004, in Compact stellar X-ray sources, ed. W. H. G. Lewin & M. van der Klis, (Cambridge: Cambridge University Press), [arXiv:astro-ph/0301544]
- (52) Titarchuk, L. 1994, ApJ, 434, 570
- Ubertini et al. (2003) Ubertini, P., Lebrun, F., Di Cocco, G., et al. 2003, A&A, 411, L131
- van der Klis (2004) van der Klis, M., 2004, in Compact stellar X-ray sources, ed. W. H. G. Lewin & M. van der Klis, (Cambridge: Cambridge University Press), [arXiv:astro-ph/0410551]
- van Straaten (2001) van Straaten, S., van der Klis, M., Kuulkers, E., & Méndez, M. 2001, ApJ, 551, 907
- Verbunt & van den Heuvel (1995) Verbunt, F., & van den Heuvel, E. P. J. 1995, in X-ray binaries, ed. W. H. G. Lewin, J. van Paradijs, & E. P. J. van den Heuvel (Cambridge: Cambridge University Press), 457
- Wijnands & van der Klis (1999) Wijnands, R., & van der Klis, M. 1999, A&A, 514, 939
- Winkler et al. (2003) Winkler, C., Courvoisier, T. J.-L., Di Cocco, G., et al. 2003, A&A, 411, L1
- White, Stella & Parmer (1988) White, N. E., Stella, L., & Parmer, A. N. 1988, ApJ, 324, 363
- White et al. (1986) White, N. E., Peacock, A., Hasinger, G., et al. 1986, MNRAS, 218, 129
- Zeldovich & Shakura (1969) Zel’dovich, Ya. B., & Shakura, N. I. 1969, Sov. Astron., 13, 175