The X-ray synchrotron emission of RCW 86 and the implications for its age
Abstract
We report here X-ray imaging spectroscopy observations of the northeastern shell of the supernova remnant RCW 86 with Chandra and XMM-Newton. Along this part of the shell the dominant X-ray radiation mechanism changes from thermal to synchrotron emission. We argue that both the presence of X-ray synchrotron radiation and the width of the synchrotron emitting region suggest a locally higher shock velocity of km s-1 and a magnetic field of G. Moreover, we also show that a simple power law cosmic ray electron spectrum with an exponential cut-off cannot explain the broad band synchrotron emission. Instead a concave electron spectrum is needed, as predicted by non-linear shock acceleration models. Finally, we show that the derived shock velocity strengthens the case that RCW 86 is the remnant of SN 185.
Subject headings:
shock waves – X-rays: observations individual (RCW 86) – supernova remnants
1. Introduction
Since the discovery of X-ray synchrotron radiation from SN1006 (Koyama et al., 1995) it has been found that most young, shell-type supernova remnants (SNRs) emit X-ray synchrotron radiation (Vink, 2006, for a review). For the youngest SNRs Cas A, Kepler (SN1604) and Tycho (SN1572) this radiation is confined to a narrow region close to the shock front. This does not seem to be the case for somewhat older, but physically much larger objects like RCW 86, G266.2-1.2 (Slane et al., 2001) and G347.3-0.5 (Cassam-Chenaï et al., 2004). The X-ray emission from the latter two SNRs does in fact only reveal synchrotron radiation, and both have been detected in TeV gamma-rays (Aharonian et al., 2005, 2004).
It has been shown that the thickness of the X-ray synchrotron emitting region is directly related to the post-shock magnetic field strength (e.g Vink & Laming, 2003). The relatively strong fields found are probably a result of magnetic field amplification by cosmic ray streaming (e.g. Bell, 2004; Bykov & Toptygin, 2005). The presence of X-ray synchrotron radiation is in itself an indication of efficient acceleration, and if the cut-off energy of the photon spectrum is determined by synchrotron losses, it is independent of the magnetic field strength, but scales with shock velocity, as (Aharonian & Atoyan, 1999).
Here we report on the analysis of Chandra and XMM-Newton data of the northeastern (NE) part of RCW 86 (G315.4-2.1). RCW 86 is an interesting SNR. The non-thermal X-ray emitting regions are broader than those of the historical SNRs, and not confined to the forward shock region, possibly as a result of projection effects (Vink et al., 1997). In that respect RCW 86 resembles G266.2-1.2 and G347.3-0.5. However, unlike those SNRs RCW 86 also emits noticeable thermal X-ray emission. This allows the determination of plasma properties, which can help to determine the conditions that may potentially lead to X-ray synchrotron emission in older SNRs. In particular the NE part seems best suited for that purpose, since the X-ray synchrotron radiation is confined to the region directly behind the shock front, and, as a result, the geometry of the emitting region is easier to asses.
| NE | E bright | E faint | N bright | N faint | |
| (cm-3kpc-2) | |||||
| (keV) | |||||
| ( cm-3s) | |||||
| (cm-3kpc[-2) | - | - | - | ||
| (keV) | - | - | - | ||
| (cm-3s) | - | - | - | ||
| O | 1 | 1 | |||
| Ne | 1 | 1 | |||
| Mg | 1 | 1 | |||
| Si | 1 | 1 | |||
| Fe | 1 | 1 | |||
| PL Norm (s-1keV-1 cm-2) | - | - | - | ||
| - | - | - | |||
| ( cm-2) | |||||
| C-stat/d.o.f. | 190.6/169 | (302+260)/230 | 182/85 | 242/103 | |
2. Observations and Analysis
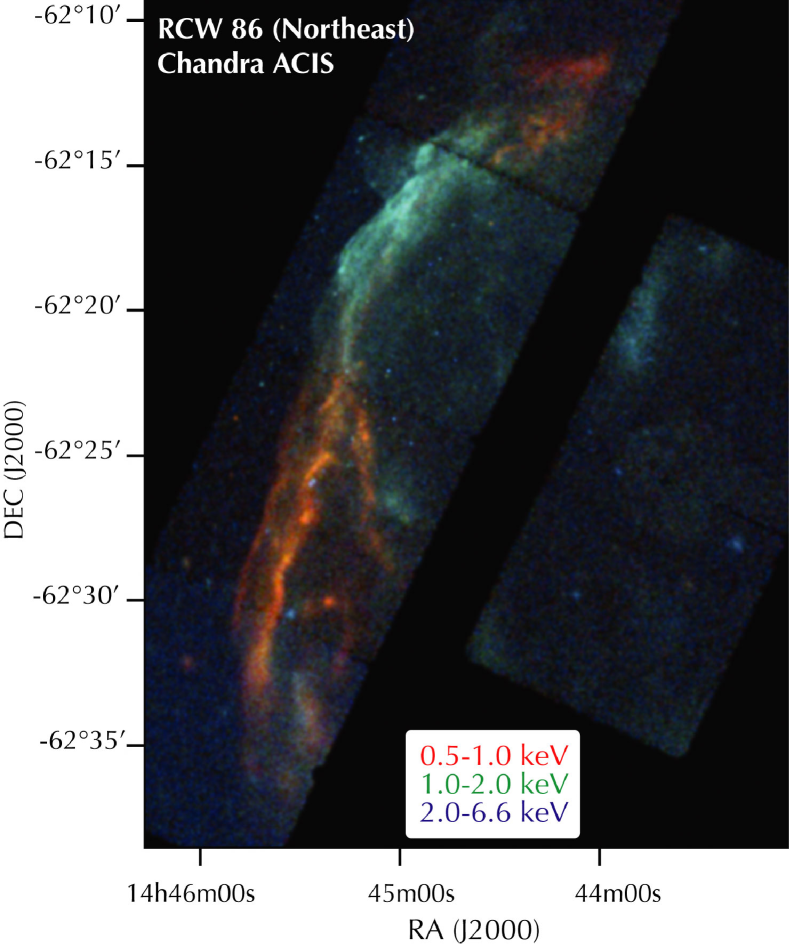
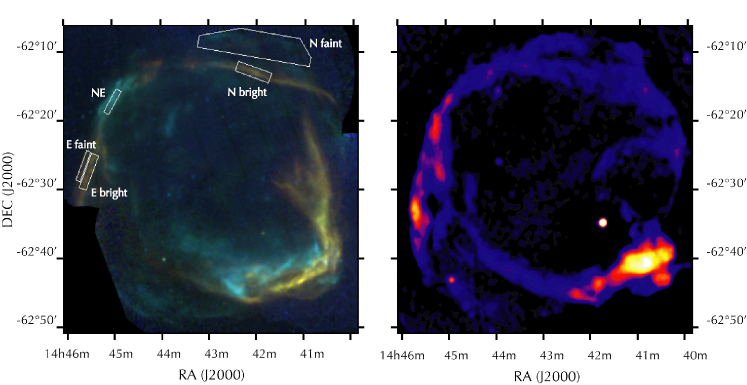
The NE of RCW 86 was observed by Chandra and XMM-Newton for their joint program. The Chandra observation (ID 500436) has a net exposure time of 72.6 ks and was made on June 6, 2004. The XMM-Newton observation (ID 0208000101) was made on January 26, 2004 with an exposure time of 60 ks. Both Chandra and XMM-Newton observed other parts of RCW 86 before (e.g. Rho et al., 2002). Here we present Chandra imaging of the NE part of RCW 86 (Fig. 4/Plate 1), but for spectroscopy we focus on the spectra obtained with the EPIC-MOS (Turner et al., 2001) instrument of XMM-Newton, since it offers the best spectral resolution. For comparison we also present an analysis of EPIC-MOS data of an observation of the northern part of RCW 86 (Obs ID 0110011401, 18 ks). Moreover, we used all six observations of RCW 86 by XMM-Newton to produce the X-ray map shown in Fig. 1. It also shows the spectral extraction regions. Background spectra were taken from regions outside the SNR. The data reduction was done with the standard software packages ciao 3.0 for Chandra and SAS 6.5.0 for XMM-Newton.

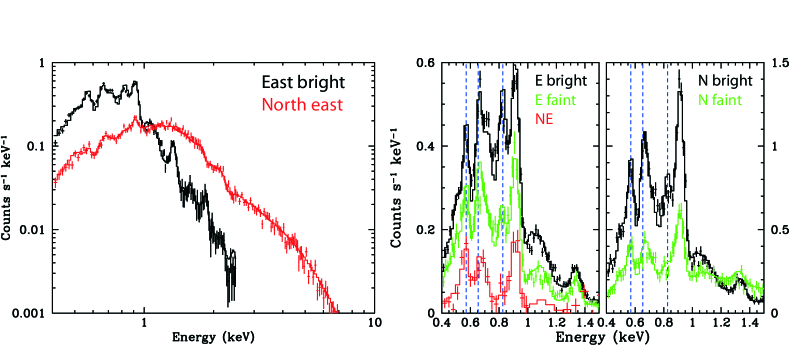
The spectrum from the region labeled “NE” (Fig. 2) shows an absence of bright line features. This is usually taken as a sign for synchrotron emission (Bamba et al., 2000; Borkowski et al., 2001; Rho et al., 2002), but for RCW 86 it has been argued by some of us in the past that non-thermal bremsstrahlung may be viable mechanism as well (Vink et al., 1997). One of the reasons was the detection of Fe-K emission at 6.4 keV in the southwest coinciding with the hard X-ray continuum. This interpretation was disputed by Rho et al. (2002), based on energetic grounds. Here we concur with that view. In fact the XMM-Newton and Chandra spectra of the NE region do not show any evidence for Fe-K emission, providing additional evidence for an X-ray synchrotron interpretation.
Figure 4 shows that along the shell the X-ray emission changes from thermal radiation to predominantly synchrotron radiation. Unlike in other parts of RCW 86, it is unambiguous that in the NE the non-thermal emission starts at the shock front. Surprisingly, the radio map shows that in the NE the X-ray synchrotron radiation is not associated with bright radio emission, but instead relatively weak radio emission. In order to better determine the plasma conditions of the X-ray synchrotron emitting regions, we do not present here the spectrum extracted from the whole X-ray synchrotron emitting region, but from a smaller region, labeled “NE” in Fig. 1, which shows more traces of thermal emission. Apart from the NE shell, we also analyzed a faint region outside the main shell (“N-faint”), which shows up better in radio than in X-ray.
We fitted the EPIC-MOS spectra using the spectral analysis software SPEX (Kaastra & Mewe, 2000). The spectra are reasonably well described by a combination of two non-equilibrium ionization (NEI) models or, for the X-ray synchrotron dominated regions, by one NEI model and a power law spectrum (Table LABEL:tab_spectra). The spectral fits indicate extreme departures from collisional equilibration, even compared to other young SNRs, except for SN1006 (Vink et al., 2003). Although the fit quality is not always satisfactory, both the fitted models and the raw spectra itself (Fig. 2) show that the fainter the thermal emission, the lower the ionization degree. This can be judged from the increase of O VIII with respect to the O VII emission and presence of Fe L emission from the brighter parts. There is also a hint that the X-ray synchrotron emitting regions contain hotter plasma, and are characterized by lower ionization parameters (). However, we caution that, since most of the continuum is non-thermal, the temperature is solely determined by line ratios, making it more sensitive to potential errors in the atomic data. This may also explain the peculiarity that whenever a second thermal component was fitted, its best value was much higher than the principal component. The second component improved, in particular, the fit between 1 and 1.2 keV, dominated by Ne IX line emission.
3. Discussion
A recent development in the interpretation of X-ray synchrotron radiation is that the width of the region can be used to estimate the downstream magnetic field. However, different groups have used, at face value, different methods for estimating the magnetic field: Vink & Laming (2003) assumed that the width, , of the X-ray synchrotron emitting region is determined by a combination of plasma velocity relatively to the shock front, , and the synchrotron loss time , i.e. , with the particle energy in erg and the magnetic field strength in Gauss. The other method assumes that the width corresponds to the diffusion length scale (Bamba et al., 2005; Völk et al., 2005), given by , with the diffusion coefficient. In essence is the length scale at which advection starts to dominate over diffusion as means of transporting particles. Both methods give a combination of and , which can be solved by using the fact that the observed photon energies peak around .Both methods rely on different assumptions. First of all, for standard shocks , but for very efficient shock acceleration the compression factor may be stronger than a factor 4. Secondly, the diffusion length method assumes , which is the smallest diffusion coefficient possible, as the particle mean free path is then equal to the gyro-radius (the “Bohm limit”).
It turns out that with both methods very similar magnetic field estimates are obtained (Ballet, 2005; Vink, 2006). As shown by Vink (2006), this is to be expected if one observes the X-ray synchrotron spectrum near the spectral cut-off energies: The acceleration time for particles according to the first order Fermi acceleration theory is, within a factor of order one, (Malkov & Drury, 2001). For electrons the acceleration is limited by synchrotron losses. So there is only a net acceleration if , and the maximum energy is reached when (Reynolds, 1998). So:
| (1) |
Therefore, is the geometrical equivalent of . Note that the observational fact that the diffusion length scale and advection length scale methods give similar results is a justification for the assumption that the diffusion coefficient is close to the Bohm limit, and a compression ratio close to the standard value of 4 (Vink, 2006).
The Chandra image reveals a width of the X-ray synchrotron shell of ″, corresponding to cm for a distance of kpc (Westerlund, 1969; Rosado et al., 1994). Fitting a projected shell model we estimate a physical width of cm. In addition we apply a factor 0.6, because the actual width is a convolution of advection and diffusion processes (i.e. we set in Eq. (1) of Berezhko & Völk (2004)), so cm. Assuming that the shock velocity is km s-1 (Ghavamian et al., 2001) gives inconsistent results for the two methods: G employing the diffusion length method, and 6 G assuming the advection length method.
However, if we no longer assume a shock velocity of 600 km s-1, which after all was based on optical observations of a different part of RCW 86 from which no X-ray synchrotron radiation is emitted, we can use the condition that in order to estimate and , using an observed photon energy of keV. We found that can be directly estimated from the diffusion/advection length alone, whereas the plasma velocity only depends on the photon energy:
| (2) | |||
| (3) |
where the shock compression factor. Eq. (3) was previously reported by Aharonian & Atoyan (1999). To get more accurate estimations one has to solve the, model dependent, kinetic equations for the particle distribution. For the moment, we estimate the error in the physical width due to distance uncertainties and projection effects to be %, resulting in an error in of G. The downstream magnetic field therefore appears to be lower than for other SNRs (Vink, 2006). There is some uncertainty in the actual cut-off energy of the synchrotron spectrum (see below), but uncertainties about the assumptions - larger compression ratio, less efficient diffusion - make Eq. (3) effectively a lower limit.
One may wonder why the shock velocity in some regions may be so much higher, and why it has not resulted in a more distorted shell. Here the thermal spectra helps to answer this question. For all fitted regions the value of the primary component is low, being cm-3s even for the brightest region. From the size of our extraction box, we estimate that the emitting volume is cm3, together with the emission measure this implies an electron density of cm-3. If we use this to estimate how long ago the plasma was shock heated we find yr. This is surprisingly short for a large SNR as RCW 86. In such a time the difference in radius between regions with low and high shock velocity would be pc on an average shock radius of 16 pc. The short interaction time supports the idea that RCW 86 is a SNR expanding in a wind blown bubble (Vink et al., 1997). Such SNRs expand rapidly for a long time, but the shock velocity drops rather suddenly as soon as the shock starts interacting with the surrounding shell swept up by the stellar wind (e.g. Dwarkadas, 2005). This suggests that in RCW 86 the shock has reached in some regions the dense shell around the bubble some 400 yr ago, after which it rapidly decelerated. In other regions the shock velocity is still high, but, due to the low density, the thermal X-ray emission is weak. This explains the coexistence of relatively weak radio synchrotron emission with conspicuous X-ray synchrotron emission: due to the lower density fewer electrons are accelerated, but because of the high shock velocity they can be accelerated to higher energies.
Interestingly, the X-ray synchrotron radiation is relatively bright, with respect to the radio emission, because we find that the simplest broad band synchrotron model, i.e. synchrotron radiation from a power law electron spectrum with an exponential cut-off does not fit the data (Fig. 3). It can explain the X-ray flux, but not the spectral slope. Instead the electron spectrum needs to be concave, as predicted by non-linear shock acceleration models. However, we can not determine whether the electron power law index bends toward -2, predicted for an overall shock compression ratio of 4, or toward -1.5, predicted for strongly cosmic ray modified shocks (Berezhko & Ellison, 1999).
The NE region of RCW 86 has properties resembling those of the TeV emitting SNRs G347.3-0.5, and G266.2-1.2: weak radio emission, and X-ray emission (almost) entirely consisting of synchrotron radiation. For RCW 86 the (weak) thermal X-ray emission indicates that these properties are due to a low density combined with a, relatively, high shock velocity. We speculate that for G347.3-0.5 and G266.2-1.2 the shock also moves through a low density region, e.g. a stellar wind bubble, and the shock velocity is similarly high. RCW 86 may be different in that some parts of the shock have reached the shell. Inside the bubble the shock evolution can be approximated by the Sedov self-similar model, but this breaks down as soon as the shell is reached. Finally, assuming a Sedov evolution and using the apparent radius of 22′, the age of the remnant is estimated to be yr. This would put the explosion date of RCW 86 closer to AD 185, the year a putative supernova was observed in China (Stephenson & Green, 2002). A shock velocity of km s-1 would be more consistent with a 10,000 yr old SNR. Our results, therefore, strengthen the case that the event recorded by Chinese astronomers was indeed a supernova and that RCW 86 is its remnant.
References
- Aharonian et al. (2005) Aharonian, F. et al. 2005, A&A, 437, L7
- Aharonian & Atoyan (1999) Aharonian, F. A. & Atoyan, A. M. 1999, A&A, 351, 330
- Aharonian et al. (2004) Aharonian, F. A. et al. 2004, Nature, 432, 75
- Anders & Grevesse (1989) Anders, E. & Grevesse, N. 1989, Geochim. Cosmochim. Acta, 53, 197
- Ballet (2005) Ballet, J. 2005, astro-ph/0503309
- Bamba et al. (2000) Bamba, A., Koyama, K., & Tomida, H. 2000, PASJ, 52, 1157
- Bamba et al. (2005) Bamba, A., Yamazaki, R., Yoshida, T., Terasawa, T., & Koyama, K. 2005, ApJ, 621, 793
- Bell (2004) Bell, A. R. 2004, MNRAS, 353, 550
- Berezhko & Ellison (1999) Berezhko, E. G. & Ellison, D. C. 1999, ApJ, 526, 385
- Berezhko & Völk (2004) Berezhko, E. G. & Völk, H. J. 2004, A&A, 419, L27
- Borkowski et al. (2001) Borkowski, K. J., Rho, J., Reynolds, S. P., & Dyer, K. K. 2001, ApJ, 550, 334
- Bykov & Toptygin (2005) Bykov, A. M. & Toptygin, I. N. 2005, Astronomy Letters, 31, 748
- Cassam-Chenaï et al. (2004) Cassam-Chenaï, G. et al. 2004, A&A, 427, 199
- Caswell et al. (1975) Caswell, J. L., Clark, D. H., & Crawford, D. F. 1975, Australian J. of Phys. Astroph. Suppl., 39
- Dickel et al. (2001) Dickel, J. R., Strom, R. G., & Milne, D. K. 2001, ApJ, 546, 447
- Dwarkadas (2005) Dwarkadas, V. V. 2005, ApJ, 630, 892
- Ghavamian et al. (2001) Ghavamian, P., Raymond, J., Smith, R. C., & Hartigan, P. 2001, ApJ, 547, 995
- Ginzburg & Syrovatski (1969) Ginzburg, F. & Syrovatski. 1969, ARA&A, 365, L1
- Kaastra & Mewe (2000) Kaastra, J. S. & Mewe, R. 2000, in Atomic Data Needs for X-ray Astronomy, ed. M. A. Bautista, T. R. Kallman, & A. K. Pradhan, 161
- Koyama et al. (1995) Koyama, K. et al. 1995, Nature, 378, 255
- Malkov & Drury (2001) Malkov, M. A. & Drury, L. 2001, Reports of Progress in Physics, 64, 429
- Reynolds (1998) Reynolds, S. P. 1998, ApJ, 493, 375
- Rho et al. (2002) Rho, J., Dyer, K. K., Borkowski, K. J., & Reynolds, S. P. 2002, ApJ, 581, 1116
- Rosado et al. (1994) Rosado, M., Le Coarer, E., & Georgelin, Y. P. 1994, A&A, 286, 231
- Slane et al. (2001) Slane, P. et al. 2001, ApJ, 548, 814
- Stephenson & Green (2002) Stephenson, F. R. & Green, D. A. 2002, Historical supernovae and their remnants (Oxford: Clarendon Press)
- Turner et al. (2001) Turner, M. J. L. et al. 2001, A&A, 365, L27
- Völk et al. (2005) Völk, H. J., Berezhko, E. G., & Ksenofontov, L. T. 2005, A&A, 433, 229
- Vink (2006) Vink, J. 2006, in The X-ray Universe 2005, ESA SP-604 Vol. 1, A. Wilson ed. (ESA, ESTEC, The Netherlands), 319
- Vink et al. (1997) Vink, J., Kaastra, J. S., & Bleeker, J. A. M. 1997, A&A, 328, 628
- Vink & Laming (2003) Vink, J. & Laming, J. M. 2003, ApJ, 584, 758
- Vink et al. (2003) Vink, J., Laming, J. M., Gu, M. F., Rasmussen, A., & Kaastra, J. 2003, ApJ, 587, 31
- Westerlund (1969) Westerlund, B. E. 1969, AJ, 74, 879
- Whiteoak & Green (1996) Whiteoak, J. B. Z. & Green, A. J. 1996, A&AS, 118, 329