The Stellar Mass Density at from Spitzer Imaging of -drop Galaxies
Abstract
We measure the ages, stellar masses, and star formation histories of galaxies, observed within 1 Gyr of the Big Bang. We use imaging from the Hubble Space Telescope (HST) and the Spitzer Space Telescope from the public “Great Observatories Origins Deep Survey” (GOODS), coupled with ground-based near-infrared imaging, to measure their spectral energy distributions (SEDs) from m, spanning the rest-frame UV and optical. From our sample of ‘-drop’ Lyman-break star-forming galaxies in GOODS-South with , we focus on with reliable photometric or spectroscopic redshifts. Half of these are confused with foreground sources at Spitzer resolution, but from the 16 with clean photometry we find that a surprisingly large fraction (40%) have evidence for substantial Balmer/4000 Å spectral breaks. This indicates the presence of old underlying stellar populations that dominate the stellar masses. For these objects, we find ages of Myr, implying formation redshifts of , and large stellar masses in the range . Analysis of seven -drops that are undetected at 3.6 m indicates that these are younger, considerably less massive systems. We calculate that emission line contamination should not severely affect our photometry or derived results. Using SED fits out to m, we find little evidence for substantial intrinsic dust reddening in our sources. We use our individual galaxy results to obtain an estimate of the global stellar mass density at . Correcting for incompleteness in our sample, we find the comoving stellar mass density to be . This is a lower limit, as post-starburst and dust-obscured objects, and also galaxies below our selection thresholds, are not accounted for. From our results, we are able to explore the star formation histories of our selected galaxies, and we suggest that the past global star formation rate may have been much higher than that observed at the epoch. The associated UV flux we infer at could have played a major role in reionizing the universe.
keywords:
galaxies: evolution – galaxies: formation – galaxies: starburst – galaxies: high redshift – galaxies: stellar content1 Introduction
Studying the stellar populations in the most distant objects known could provide a key insight into galaxy formation, potentially revealing the star formation history at even earlier epochs. The current frontier for spectroscopically-confirmed galaxies is , with unconfirmed candidates based on photometric redshifts at perhaps even higher redshifts. The -drop technique is based on the Lyman-break technique (Steidel et al. 1996) and robustly selects star-forming galaxies at (Stanway, Bunker & McMahon 2003; Bunker et al. 2004; Bouwens et al. 2004a; Yan & Windhorst 2004; Giavalisco et al. 2004), when the universe was less than 1 Gyr old. If some of these -drop galaxies can be shown to harbour stellar populations with ages of a few hundred Myr, then this pushes their formation epoch to . Measurements of the stellar masses of individual galaxies can also constrain structure formation paradigms; in a simple hierarchical model, massive galaxies assemble at later times through merging, so it might be expected that in this scenario the number density of massive evolved galaxies in the first Gyr would be low.
In Eyles et al. (2005), we presented Spitzer/IRAC imaging of -drop galaxies with known spectroscopic redshifts, sampling the rest-frame optical at m. Our previous work with optical HST/ACS data and near-infrared imaging from VLT/ISAAC and HST/NICMOS (Stanway, McMahon & Bunker 2005) explored the rest-frame ultraviolet (UV) in these galaxies, which is dominated by recent or ongoing star formation. The addition of Spitzer/IRAC imaging allowed us to fit spectral energy distributions from the multi-wavelength broad-band photometry to stellar population synthesis models. We were able to constrain the stellar masses and ages, and hence explore the preceding star formation history and the formation epochs. We concentrated primarily on two bright, well-detected objects (SBM03#1 & #3 from Stanway, Bunker & McMahon 2003) with spectroscopic redshifts of (Stanway et al. 2004a,b; Bunker et al. 2003). For these two sources, we found evidence for the presence of Balmer/4000 Å spectral breaks, indicating significant old stellar populations, with ages of the order of a few hundred million years (see Section 4.1). From this we inferred formation redshifts of , and that even more vigorous star formation had taken place prior to the time of observation. Our work was confirmed independently by Yan et al. (2005) who, in their selection of galaxies, studied one of the same objects, SBM03#1 (see also Finlator, Davé & Oppenheimer 2006). The epoch marks a pivotal point in the history of the Universe – the end of the reionisation era (Becker et al. 2001; Kogut et al. 2003; Spergel et al. 2006). Hence we suggested that if objects such as these were commonplace at , the UV flux from their initial vigorous starbursts may have played a key role in the reionisation of the Universe, supporting earlier work of Bunker et al. (2004) and Egami et al. (2005).
The evidence found for the presence of significant Balmer/4000 Å breaks in our two well-detected -drops raises the question: are these breaks rare in objects, or are they commonplace? In this paper, we now look to expand on our case studies of a few individual sources, by considering the observed optical-infrared properties of a larger population of -drop galaxies. If Balmer/4000 Å breaks are found to be rare occurrences a possible scenario is that most star-forming -drops could be young “protogalaxies” undergoing their first bout of star formation at . On the other hand, if these breaks are commonplace at , it could be inferred that there is a significant population of well-established objects in place 1 Gyr after the Big Bang. In these systems, vigorous star formation would be required at in order to assemble the bulk of the stellar mass.
Thus our primary goal is to obtain a robust estimate of the stellar mass density at from our sample of -drop galaxies; coupled with age estimates (also derived from our photometry), we may be able to uncover the preceding star formation history. This is immensely important when considering galaxy assembly scenarios and also the reionisation of the Universe. The contribution of star-forming galaxies at to the UV ionizing background, and hence the reionisation of the Universe, is still debated. Bunker et al. (2004) discovered -drop galaxies in the Hubble Ultra Deep Field (HUDF) with (). Star formation rates of these galaxies extend down to , derived from the rest-frame UV continuum assuming a standard Salpeter initial mass function (IMF). Bunker et al. concluded that the star formation density from these observed sources would be insufficient to reionize the Universe at , even with large escape fractions for the Lyman continuum photons. Yan & Windhorst (2004) independently confirmed the Bunker et al. -drops in the HUDF (see Stanway & Bunker 2004 for a comparison), but suggested that unobserved galaxies below the detection limit could contribute much of the flux if the faint-end slope of the rest-UV luminosity function was much steeper than seen for Lyman break galaxies at lower redshifts (; Steidel et al. 1996). Stiavelli, Fall & Panagia (2004) suggested that a warmer intergalactic medium (IGM), a top-heavy IMF and substantially lower metallicity (e.g., Population III) at might just provide sufficient ionizing flux if the escape fraction was , much higher than observed at (; Inoue, Iwata & Deharveng 2006). Whilst the slumping star formation rate density from the observed -drops (Bunker et al. 2004, Bouwens et al. 2004a) might be insufficient to account for reionisation at , it is possible that earlier more intense star formation played a significant role in achieving reionisation at higher redshifts.
Using public imaging taken as part of the “Great Observatories Origins Deep Survey” (GOODS; Dickinson & Giavalisco 2003; Dickinson et al. in prep), our group has explored the stellar mass density and ages of -drop galaxies at (Stark et al. 2006). Comparing the inferred previous star formation histories of these -drops with observations of the star formation rate density at higher redshifts, Stark et al. concluded that perhaps as much as half of the star formation occurring at goes unobserved. Potential reasons for this include a high contribution from low-luminosity sources, dust obscuration and/or a yet to be observed phase of star formation at very high redshift (). Recently, Yan et al. (2006) have provided an estimate to the stellar mass density at , and concluded that the bulk of reionising photons must have been provided by other sources, perhaps by objects that are below current detection limits.
It should be noted that such studies of Lyman break galaxies (LBGs) place lower limits on the stellar mass density at the epoch of observation. The LBG selection technique is reliant upon an objects’ detection in the rest-frame UV (e.g., the -band for -drops at ), so there must be at least some ongoing star formation at the epoch of observation for the galaxy to be selected. Attempts to find post-starburst (Balmer-break) objects at are extremely difficult and uncertain due to a large population of lower redshift interloping galaxies. For example, Mobasher et al. (2005) have recently suggested the presence of a massive post-starburst galaxy, HUDF-JD2, with a photometric redshift of (high-redshift solutions with being preferred 85 per cent of the time). This comes from the re-analysis of an IRAC-detected Extremely Red Object (IERO) identified in the HUDF by Yan et al. (2004), who originally derived a photometric redshift of (see also Chen & Marzke 2004). If the higher redshift from Mobasher et al. (2005) is correct, then the SED suggests a remarkably large stellar mass of at – a factor of ten greater than the masses we presented in Eyles et al. (2005). However, deep spectroscopy has yet to yield a redshift for this source, and the high photometric redshift estimate of Mobasher et al. has been disputed by Dunlop et al. (2006), who suggest that is more plausible.
Rather than study all galaxies in the GOODS fields with potential photometric redshifts at , in this paper we restrict ourselves to the -drop selection, which has proven to be a reliable technique in isolating star-forming galaxies (see Bunker et al. 2005 for a review) and so should minimize low redshift contaminant sources. Hence by investigating the stellar masses of our Lyman-break galaxies, we should be able to derive lower limits on the stellar mass density at this epoch.
In this paper we examine the SEDs of -drop galaxies in the GOODS-South field, using observations from HST/ACS in the optical, VLT/ISAAC in the near-IR, and Spitzer/IRAC to span the rest-frame UV/optical. The work presented in this paper is an independent analysis of the -drop population, and differs from the recent work of Yan et al. (2006) in several ways. In addition to photometric data gathered in HST/ACS & Spitzer/IRAC wavebands, we also use ground-based near-IR imaging of the GOODS-South field to better constrain the SEDs and the stellar population fitting (see Sections 3.2 & 3.3). Rather than assign a common redshift of to all galaxies in our sample, we choose to use -drops with either spectroscopically confirmed or robust photometric redshifts, and provide photometry for each source and details of the best-fit stellar population models for individual galaxies (Sections 3 & 4). For those objects which suffer from confusion with neighbouring sources, we attempt to subtract the contaminating objects in order to obtain accurate aperture photometry, rather than simply discarding these -drops from our sample (see Section 3.1). We look to build on our previous work in Eyles et al. (2005) by now considering a full sample of -drop candidates, and exploiting new, improved imaging datasets provided by the GOODS team (see Section 2.1), including both epochs of the Spitzer/IRAC imaging.
An outline of this paper is as follows: Section 2 provides a summary of the imaging datasets used in this study and our selection of -drop galaxies. In Section 3 we describe the photometry and the removal of contaminating sources, and also the fitting of stellar population synthesis models to the observed spectral energy distributions. We discuss our results and their implications in Section 4, and our conclusions are presented in Section 5. Throughout we adopt the standard “concordance” cosmology of , , and use , which is within of the latest WMAP determination (Spergel et al. 2006) – in our adopted cosmology, the Universe today is 13.67 Gyr old, and at its age was 914 Myr. All quoted magnitudes are on the system (Oke & Gunn 1983).
2 Observations and Object Selection
2.1 Imaging Data
In this paper, we use multi-waveband data of the GOODS-South field which is centred on the Chandra Deep Field South (Giacconi et al. 2002) and also contains the Hubble Ultra Deep Field (Beckwith et al. 2003).
The Advanced Camera for Surveys (ACS; Ford et al. 2003) onboard the
HST has provided deep optical imaging of the GOODS-South field,
as part of HST Treasury Programs #9425 & 9583 (Giavalisco
et al. 2003; 2004), using the F435W (), F606W (), F775W
(SDSS-) and F850LP (SDSS-) broad-band filters, with a pixel
scale of . In our analysis we make use of the publicly
available version-1.0 release111available from
ftp://archive.stsci.edu/pub/hlsp/goods/ of the reduced data
from the GOODS team. These data, taken over
5 observing epochs, had
been ‘drizzled’ using a ‘multidrizzle’ technique (Koekemoer et al. 2002), producing combined images with a pixel scale of ,
mosaicked in a area.
The limiting
magnitudes, measured in diameter
apertures, are , , &
For the purpose of this
study, we are primarily concerned with the & -band images.
Deep ground-based near-infrared data were obtained using the Infrared
Spectrometer and Array Camera (ISAAC) on the Very Large Telescope
(VLT), as part of the ESO Large Programme LP168.A-0485(A) (PI: C. Cesarsky). We utilise the -band (m) and -band (m)
data which were released as part of the publicly available v1.5 reduced
dataset222available from
http://www.eso.org/science/goods/releases/20050930/ (Vandame et
al. in prep). We note that the and data release is an
updated version of the v1.0 release used in Eyles et al. (2005) and
Stanway et al. (2003; 2004a,b). The mosaicked and images
each cover arcmin2, and comprise of 24 tiles taken over
many nights. These data have a pixel scale of , five times
larger than that of the ‘drizzled’ ACS pixels, and each individual
tile has undergone a rescaling in order to provide an homogeneous
zeropoint AB-magnitude of 26.0 in both the & -bands. The
and -band limiting magnitudes, measured in -diameter
apertures are & (see Section 3.2).
Imaging of the GOODS-South field using the Infrared Array Camera
(IRAC; Fazio et al. 2004) onboard Spitzer was conducted as part
of the GOODS Legacy programme (PID 194, Dickinson et al. in prep). IRAC uses four broad-band filters with central
wavelengths at approximately 3.6 m, 4.5 m, 5.8 m &
8.0 m (channels 1-4). The data were taken over two observing
epochs, with the telescope roll angle differing by . Note
that at the time of our previous study (Eyles et al. 2005) only the
epoch 1 data
were available; as the area covered by channels 1 & 3 is offset by
6.7 arcmin from that covered by channels 2 & 4, IRAC imaging of the
entire GOODS-South field was not complete in any of the four
channels. With the release of the epoch 2 data333Second Data
Release (DR2); see
http://data.spitzer.caltech.edu/popular/goods/
Documents/goodsdr2.html,
the full field is now covered in all four wavebands.
We use the publicly-released reductions of the GOODS-South images
produced by the GOODS team (the updated DR3 for epoch 1 rather
than the original DR1, and DR2 for epoch 2).
As with the HST/ACS GOODS data, these reduced IRAC images had been ‘drizzled’ by the GOODS team,
resulting in combined images
with a pixel scale of (approximately half the original pixel size), a factor of twenty greater than that
of the ‘drizzled’ ACS data.
The
limiting magnitudes are 26.5 & 26.1 for IRAC channels 1 & 2
respectively, measured in diameter apertures, and 23.8 &
23.5 for IRAC channels 3 & 4 measured in & diameter apertures
respectively (these limits include aperture corrections appropriate for
unresolved sources, see Section 3.2). In this work, we
concentrate on the two shorter wavelength IRAC filters which have
the greatest sensitivity.
2.2 The -band Dropouts
A catalog of galaxy candidates present in the GOODS-South field was constructed (Stanway 2004), with objects selected via the Lyman-break technique (Steidel, Pettini & Hamilton 1995; Steidel et al. 1996; 1999). For a Lyman-break galaxy, the flux decrement due to absorption by the intervening Lyman- forest is redshifted to fall between the -band and -band filters, causing it to “drop-out” in the -band. Previous studies (Stanway et al. 2004b; Dickinson et al. 2004) have shown that a colour-cut of mag reliably selects star-forming galaxies at , with some contamination from lower redshift, passively evolving galaxies (the “Extremely Red Object” ERO population, e.g., Cimatti et al. 2002, Doherty et al. 2005), and also from low-mass stars (e.g., Hawley et al. 2002). In this paper we apply our -drop selection criteria to the total GOODS-ACS dataset (5 epochs co-added into a single image); previous work by our group (Stanway et al. 2003) was based on single-epoch selections, and the co-added 5-epoch dataset of the version-1.0 release allows us to push mag deeper than before, to a level similar to that of Bouwens & Illingworth (2006). Our -drop catalog (Stanway 2004) was constructed using the Source Extractor program (Bertin & Arnouts 1996), training the apertures in the -band and demanding a colour of mag within a small aperture (-diameter) to minimize contamination effects from nearby sources. Candidate -drops within this list were then scrutinised according to the quality and reliability of their detections; we removed detector artifacts, diffraction spikes from bright stars, and low signal-to-noise ratio candidates (typically in the edge regions of each tile where fewer epochs overlapped). We also required that there was no detection at in the -band (shortward of the 912 Å Lyman limit at ). Some of the brighter -drops are faintly detected in -band (e.g., 31_2185/SBM03#3 with has and ), consistent with a large Lyman- forest flux decrement of . Using the HST/ACS -band imaging, bright -drops with half-light radii were identified as probable low-mass Galactic stars, and these point sources were removed from our catalog; this included the sources SBM03#4 & SBM03#5 / UDF B2104 (Stanway, Bunker & McMahon 2003; Bunker et al. 2004). At magnitudes fainter than the star–galaxy separation is less clean, so we keep borderline unresolved fainter sources in our sample, and use the ACS/near-IR/IRAC SEDs to reject possible stellar interlopers later (Section 3.2).
For consistency with our other work (Bunker et al. 2004; Eyles et al. 2005) we have remeasured the photometry of our -drops in -diameter apertures, and aperture-corrected them to approximate total magnitudes (see Section 3.2). We imposed a selection criterion based on the -band magnitudes of our -drops, selecting only those with . These robust detections () mean that the () colour is secure, and we should have little contamination from lower-redshift red galaxies with intrinsic colours just blueward of our colour cut scattering up into our selection through photometric errors. This appears to severely affect the -drop catalogs of other groups who work with lower significance detections: for example, Dickinson et al. (2004) and Giavaliso et al. (2004) analysed the GOODS fields, selecting -drops down to in the -band, and estimated that 55% of these would be genuine galaxies on the basis of simulations. However, Bouwens et al. (2005) looked at those sources covered by the deeper UDF imaging, and found that only 25% were real -drops.
Our list of -drops in GOODS-South has 54 objects with (where we treat 3 close pairs seen in HST/ACS as single objects as they are unresolved at Spitzer/IRAC resolution). We note that the analysis of Yan et al. (2006) uses 142 -drops in GOODS-South from Giavalisco et al. (in prep.), but figure 1 of Yan et al. (2006) indicates that their selection extends to . This is a factor of two fainter than our limit; the number counts appear to turn over at , so presumably fainter magnitudes suffer large incompleteness.
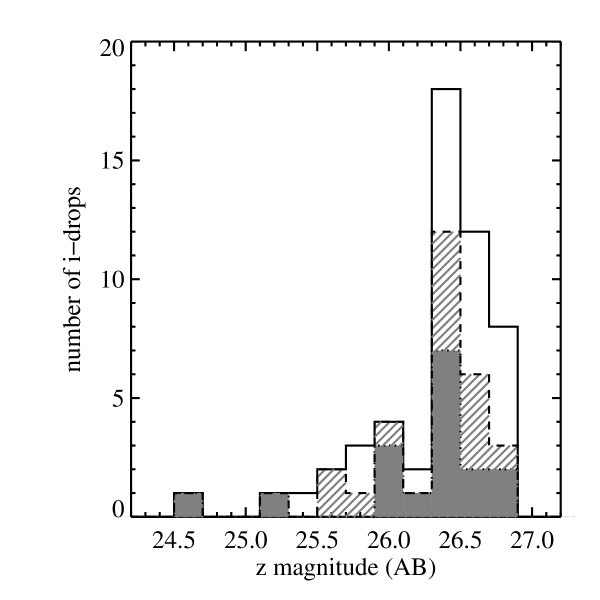
We then further refined our list of objects to the subset which had either spectroscopic or robust photometric redshifts. Our group was the first to publish spectroscopic confirmation of the HST/ACS -drop selection technique, using Keck/DEIMOS (Bunker et al. 2003; Stanway et al. 2004a; see also Dickinson et al. 2004), and also Gemini/GMOS spectroscopy (GLARE; Stanway et al. 2004b). Three of the four objects with spectroscopic redshifts in our previous Spitzer analysis (Eyles et al. 2005) also appear in our current sample – & (SBM03#1 & #3 respectively), and also (GLARE#3001). We note that GLARE#3011, the fourth (and faintest) object to feature in our previous analysis, was omitted from our current -drop catalog as it has . We matched our -drop candidates with the GOODS-MUSIC photometric catalog of this field (Grazian et al. 2006). This catalog uses 13-band SEDs from HST/ACS and Spitzer/IRAC photometry along with ground-based , & to derive photometric redshifts. We found 27 of the 54 objects within our list of -drops also featured in the GOODS-MUSIC catalog with photometric redshifts , of which five have spectroscopic redshifts from the literature444The GOODS-MUSIC survey uses the redshift compilation given in http://www.eso.org/science/goods/spectroscopy/CDFS Mastercat/. A further four of our -drop catalog had confirmed redshifts from VLT/FORS2 spectroscopy (Vanzella et al. 2005; 2006), but were missing from the GOODS-MUSIC catalog. This gives us a total of 31 objects with spectroscopic or photometric redshifts at , which are detailed in Table 1. Of the remaining 23 galaxies in our -drop catalog, two were likely EROs with , and were removed from our sample (a contamination rate by EROs of %). Three GOODS-MUSIC matches had photometric redshifts of , below the nominal -drop selection, and another five had matches in the GOODS-MUSIC catalog, but no photometric redshift solution had been found (). The remaining 15 were absent from the GOODS-MUSIC catalog, possibly due to incomplete photometry in all wavebands in these regions (particularly the , , & ). However, the available colours and the distribution of magnitudes of these galaxies seem similar to our other -drops (Figure 1), so we will scale the results from the spectroscopicphotometric sub-sample to our whole GOODS-South -drop sample at , excluding bright Galactic stars and lower-redshift EROs (a total of 52 objects).
By restricting ourselves to the proven -drop pre-selection, rather than including all galaxies with a potential photometric redshift solution, our sample should contain fewer numbers of spurious high redshift sources which may otherwise scatter into the selection (e.g., see Dunlop et al. 2006). We note, however, that the Lyman-break selection we adopt requires at least some ongoing or very recent star formation to detect the break in the rest-frame UV (a detection in the -band) so we are incomplete for galaxies in which star formation has ceased. Hence our measurements of the global stellar mass density at will necessarily be firm lower limits for galaxies in the GOODS-South field (see Section 4.5). Cosmic variance will of course play a role, but for the size of the GOODS survey this has been estimated to be a 20 per cent effect (Somerville et al. 2004) if the -drops have similar clustering to the Lyman-break galaxies at (the -band drop-outs).
Although, as a consequence of our selection criteria, our sample of galaxies is smaller than that of Yan et al. (2006), in doing so we preserve the available redshift information, rather than assigning a common redshift of to all objects. This selection process, based on the quality of HST/ACS detections and the availability of robust spectroscopic or photometric redshifts, resulted in a sub-sample of 31 objects for further analysis.
| our ID | GOODS-MUSIC ID | RA (J2000) | Dec. (J2000) | (05) | () | Redshift | |
|---|---|---|---|---|---|---|---|
| 499 | 03:32:25.605 | –27:55:48.69 | |||||
| 8940 | 03:32:40.012 | –27:48:15.01 | |||||
| 8079 | 03:32:13.071 | –27:49:00.75 | |||||
| 3912 | 03:32:39.027 | –27:52:23.12 | |||||
| — | 03:32:33.194 | –27:39:49.11 | |||||
| 10580 | 03:32:49.983 | –27:46:56.20 | |||||
| 7818 | 03:32:54.099 | –27:49:15.88 | |||||
| 959 | 03:32:23.842 | –27:55:11.62 | |||||
| 7536 | 03:32:46.039 | –27:49:29.71 | |||||
| 9235 | 03:32:14.739 | –27:47:58.75 | |||||
| — | 03:32:32.460 | –27:40:01.93 | |||||
| 9234 | 03:32:24.797 | –27:47:58.82 | |||||
| 16461 | 03:32:37.956 | –27:42:07.53 | |||||
| — | 03:32:22.282 | –27:52:57.21 | |||||
| 4264 | 03:32:31.190 | –27:52:06.17 | |||||
| 10898 | 03:32:36.462 | –27:46:41.40 | |||||
| 15047 | 03:32:27.888 | –27:43:15.70 | |||||
| 13076 | 03:32:35.361 | –27:44:57.18 | |||||
| 11002 | 03:32:25.110 | –27:46:35.67 | |||||
| 9858 | 03:32:27.397 | –27:47:28.28 | |||||
| 1366 | 03:32:17.808 | –27:54:41.60 | |||||
| 8187 | 03:32:18.297 | –27:48:55.64 | |||||
| — | 03:32:48.941 | –27:46:51.45 | |||||
| 4361 | 03:32:36.833 | –27:52:01.01 | |||||
| 7737 | 03:32:43.348 | –27:49:20.37 | |||||
| 15052 | 03:32:36.342 | –27:43:15.51 | |||||
| 15176 | 03:32:15.257 | –27:43:09.02 | |||||
| 10793 | 03:32:13.414 | –27:46:46.38 | |||||
| 5207 | 03:32:38.961 | –27:51:16.64 | |||||
| 9135 | 03:32:52.214 | –27:48:04.80 | |||||
| 16458 | 03:32:29.019 | –27:42:07.89 |
∗ These objects were rejected from further analysis for reasons
outlined in Section 3.1.
⋄ These are spectroscopic redshifts. Those of &
come from Keck/DEIMOS spectroscopy
(Stanway et al. 2004; Bunker et al. 2003), and for from
Gemini/GMOS spectroscopy (Stanway et al. 2004b). The other
spectroscopic redshifts are from VLT/FORS2 spectroscopy by
Vanzella et al. (2006).
† Object has photometry consistent with
being a T-dwarf low-mass star, and is unresolved in the HST/ACS images.
3 Data Analysis
3.1 Removal of Contaminating Sources
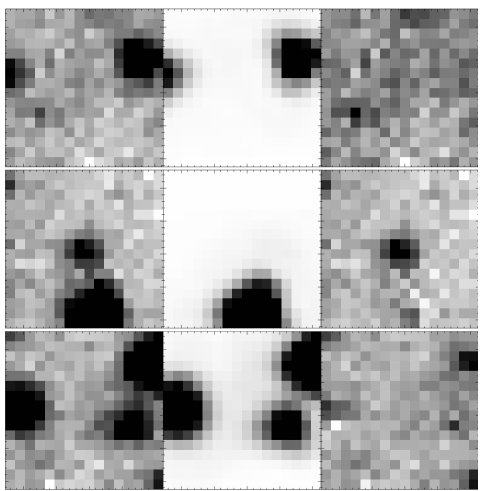
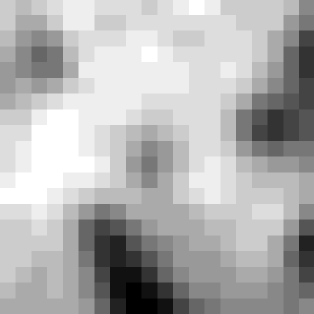
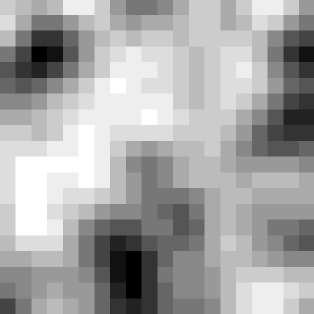
Before photometry of individual objects was gathered, it was necessary to ensure that they did not suffer from contamination due to neighbouring sources; this is particularly common in the Spitzer/IRAC data, due to the low spatial resolution () compared with the HST (). Each of the -drops in our sample was visually inspected in IRAC channels 1 & 2 (3.6 m & 4.5 m), and compared to the higher-resolution HST/ACS -image and the VLT/ISAAC -band in order to identify any contaminating sources. As in our recent work on the -band drop-outs in this field (Stark et al. 2006), each galaxy was classified in the Spitzer/IRAC data as: a) isolated and detected; b) confused; c) undetected; or d) unobserved (either not in the field of view, or in a noisy region close to the edge of the field where few frames overlap). Four of our 31 objects fell into category d), and so were removed from the sample and not analysed further. Of the remaining 27, three sources were isolated and detected (category a) and one was isolated and undetected (category c). Hence 23 of the -drop galaxies in our sample were classified as confused, and for these objects attempts were made to subtract out the contribution from neighbouring sources, using the “GALFIT” software package (Peng et al. 2002) to model the surface brightness profiles of nearby sources in the IRAC field. We emphasize that we use GALFIT to fit the neighbouring sources to subtract out, not the -drops themselves.
In order to perform the subtraction of contaminating sources with GALFIT, it
was necessary to obtain the point spread function (PSF) for each
waveband. For the Spitzer/IRAC data, we used in-flight PSFs
which were oversampled by a factor of two relative to the ‘drizzled’
data555see
http://ssc.spitzer.caltech.edu/irac/psf.html.
These PSFs were then rotated to match the orientation of the
drizzled IRAC GOODS-South images; epoch 2 differed from epoch 1 by a roll angle of
. The PSFs of the & -band data were created
by trimming regions around bright yet unsaturated
stars in the field of view; due to variation in seeing between
different pointings in the mosaic, a separate PSF for each individual
image tile was created. The stars used for these PSFs were then later
employed in calculating aperture corrections for the
photometry (see Section 3.2).
GALFIT constructs a two-dimensional model of each confusing galaxy for various surface brightness profiles (e.g., exponential disk, de Vaucouleurs, Sérsic) according to several initial input parameters specified by the user (e.g., magnitude, centre, axial ratio, position angle), which can be held fixed or allowed to vary. The model is then convolved with the instrument PSF (we used two-times oversampled PSFs for IRAC). Perturbing the model parameters from the initial guess, an iterative minimisation process converges on a best-fit solution. The best-fit parameters are returned, along with images of the 2-D fitted model and of the residual flux when the model is subtracted from the original galaxy image.
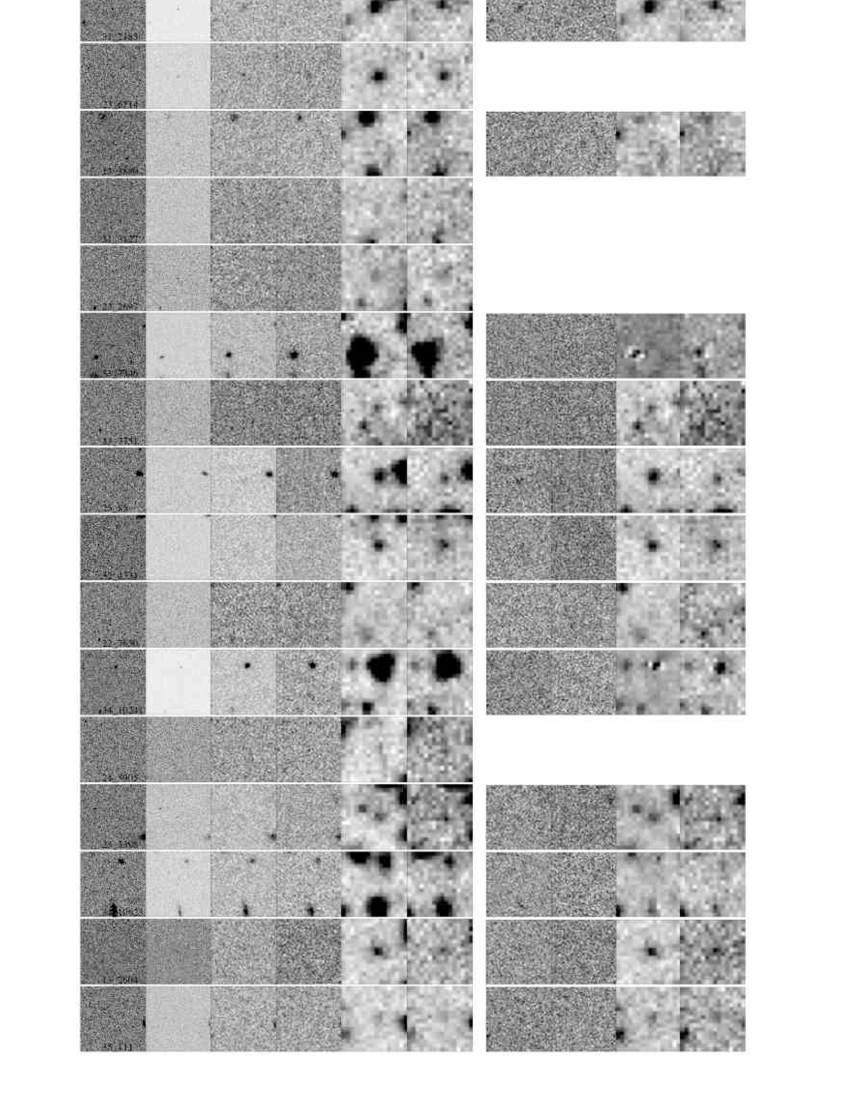
For the 23 confused sources in our sample, regions surrounding each individual object in the , , 3.6 m & 4.5 m wavebands were used to begin the following process. Initial GALFIT input parameters for neighbouring sources were estimated from the -band images, as this waveband typically had the highest spatial resolution of the infrared images. We used the IRAF task imexamine to obtain magnitude and coordinate estimates of the neighbouring sources. GALFIT was then run on the -band image with all input parameters allowed to vary and a generic Sérsic profile adopted, where (where is the Sérsic index). Using the output parameters from the -band fits as input estimates, GALFIT was then applied to the other infrared filters (, 3.6 m & 4.5 m). In these wavebands, three versions of the fitting process were carried out. For one version, all input parameters as determined from the -band were held fixed, except the magnitudes (this would be appropriate if the morphology was independent of wavelength, i.e. no colour gradients). In the second version, we repeated the GALFIT procedure, but updated the input centres and magnitudes of the surrounding sources with those measured directly from the , 3.6 m & 4.5 m images, and again fixed the galaxy shape parameters (axial ratio, PA, Sérsic index, scale length) from the -band fitting. Finally, we also re-ran GALFIT on the , 3.6 m & 4.5 m images allowing all of the input parameters to vary. Each resulting subtraction was then visually inspected, and the best fit for each waveband was selected. For those confused objects which appear in both epochs of the Spitzer/IRAC data, the subtraction of neighbouring objects was attempted on each epoch independently, as the PSF differed greatly. Some galaxies appeared in the central overlap region between the two epochs; we used the deeper of the two, and where the depth was the same we used the epoch which yielded the better GALFIT subtraction of confusing sources. In several cases (particularly when used on the Spitzer/IRAC data), GALFIT failed to satisfactorily remove the confusing source(s); this resulted in the removal of a further 10 sources from our sample, leaving a total of 17 sources for which reliable photometry was obtainable. From this list, object was later rejected as its photometry is more consistent with being a low-mass T-dwarf star than a galaxy (see Section 3.2), and it is unresolved in the HST/ACS images. Figure 2 shows the multi-waveband images of the remaining 16 objects of our sub-sample, before subtraction of confusing sources was conducted (left-hand side), and also the results of GALFIT for those confused objects for which subtraction of neighbouring sources was successful (right-hand side). In Section 4.5, we discuss the correction to the total stellar mass density of those objects for which attempts at subtracting the effect of neighbouring confusing sources were unsuccessful. In Figure 1 we show the distribution of -band magnitudes for our 17 -drops with clean photometry, compared to the full sub-sample of 31 -drop galaxies with spectroscopic or photometric redshifts, and with our complete catalog of 52 -drops with (see Section 2.2). The magnitude distribution of the sub-sample analysed does not show any obvious bias; a Kolmogorov-Smirnov test shows that there is a 99 per cent probability of the 31 galaxies with redshift information having the same -band magnitude distribution as the total -drop sample of 52; and that there is a 94 per cent chance that the 17 -drops analysed have the same magnitude distribution as all the -drops with redshift information.
3.2 Photometry
As shown in our previous work, the typical half-light radius of a -drop galaxy is (Bunker et al. 2004; see also Ferguson et al. 2004, Bouwens et al. 2004a), and these objects are often barely resolved in the HST/ACS images. Hence when viewed at the poorer resolution of the VLT/ISAAC data, and in particular the Spitzer/IRAC images, they are essentially unresolved, and so we treat them as point sources for the purposes of photometry. HST/ACS photometry of our full catalog of 52 -drop candidates (see Section 2.2) had been previously gathered by our group (Stanway 2004; Bunker et al. 2004), using diameter apertures, and had been both aperture & extinction-corrected for Galactic dust; we used these magnitudes for this analysis. Magnitudes for each of our selected -drops in the near-IR and IRAC wavebands were obtained using the IRAF digiphot.phot package to perform aperture photometry, measuring the enclosed flux at the coordinates determined from the astrometry of the GOODS version-1.0 -band data. Aperture corrections were then applied to convert the measured aperture magnitudes to approximate total magnitudes, appropriate for point sources. Photometry in the ground-based VLT/ISAAC & images was performed using -diameter apertures, removing the residual sky background determined from an annulus between and radius. The seeing was generally good () but varied from tile to tile. Hence a unique aperture correction for each individual tile was calculated, using the PSF stars used in the subtraction of confused sources with GALFIT (Section 3.1), measuring the flux out to a diameter of . The aperture corrections for our fixed -diameter apertures were found to be in the range mag. Noise estimates were also made on a tile-to-tile basis to account for the differing seeing conditions and exposure times, producing limiting total magnitudes of & .
For the Spitzer/IRAC photometry, we used an aperture of diameter , which maximises the signal-to-noise ratio () for unresolved objects. For both IRAC channels 1 & 2, the FWHM (as determined from unsaturated point sources in the GOODS-South IRAC images) was 2.5 drizzled pixels or . Hence we set the photometric aperture diameter to be 4 drizzled pixels (). The local background was determined from an annulus between 20 and 40 pixels radius ( and ). We note that for object , a smaller background annulus was employed (between 7 and 10 pixels). This was due to the fact that this source resides in a particularly crowded region of the GOODS-South field, where the larger sky annulus was significantly contaminated by several bright objects. As determined in our previous study, the corrections for the IRAC 3.6 m & 4.5 m channels to convert from our aperture magnitudes to approximate total magnitudes were found to be mag, measuring out to diameter. These are consistent with those derived for the First Look Survey (Lacy et al. 2005). The noise estimates adopted in this study mirror those used in Eyles et al. (2005) and Stark et al. (2006) – limiting magnitudes of & for channels 1 & 2 respectively, in diameter apertures.
Photometry was gathered on the 17 sources in our sub-sample, with 13 of them having had neighbouring objects subtracted with GALFIT (see Section 3.1). Of these 17 objects, 10 were detected at in IRAC channel 1 and 9 in channel 2 (with source marginally detected in channel 2). Table 2 lists the measured AB magnitudes in the , , , , m & m filters of the 17 objects for which reliable photometry was gathered. These values have had the appropriate aperture corrections applied, and so represent estimated total magnitudes, which were then used to conduct spectral energy distribution modelling (Section 3.3).
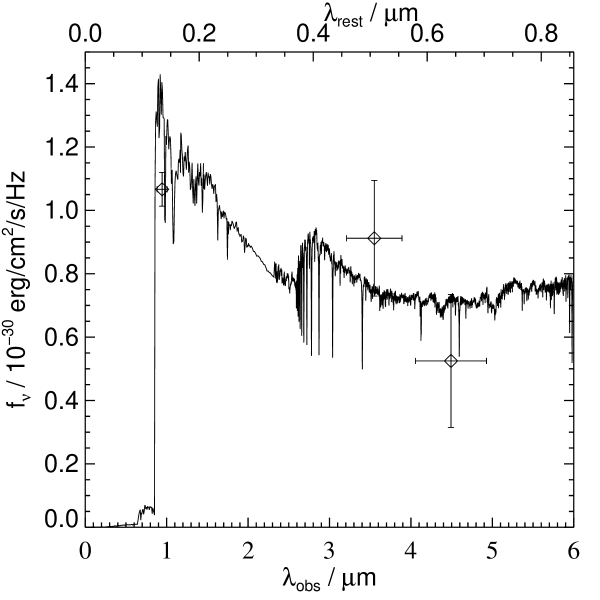
The photometry
of object appears to be anomalous for a galaxy,
with very peculiar colours – twice as bright in and IRAC channel 2
than in and IRAC channel 1, quite unlike the SEDs of our spectroscopically-confirmed
-drops. The
source appears to be unresolved in the HST/ACS imaging
suggesting that it may be a Galactic point source (although the GOODS-MUSIC catalog does
allocate a photometric redshift of ). It was not
removed from the initial -drop list because its faint magnitude ()
is where star-galaxy separation just begins to become unreliable.
However, in Figure 8 we overplot the SED on a spectrum of
the T7 Dwarf Gl 229B666Available from http://www.jach.hawaii.edu/skl/spectra/
T7Gl229B.txt (Leggett et al. 2002). The photometry of
closely resembles that of a T-dwarf, with
H20 and CH4 spectral features significantly contributing to the detected -band
and m fluxes. Comparing our measured photometry
to the colours of T-dwarfs in Patten et al. (2006), and converting
our AB magnitudes to the Vega system used, the ,
3.6 m and 4.5 m colours appear to be consistent
with a T57 dwarf. The only other -drop in our subsample
to have a half-light radius as small as
(as for the T-dwarf ) is , which has a spectroscopic redshift
of and colours unlike the T-dwarf (i.e., probably not a star) .
Hence object was also eliminated from inclusion in any further analysis as a probable T-dwarf star, resulting in a final selection of 16 -drop galaxies on which SED fitting was subsequently conducted. For objects , & (SBM03#1, SBM03#3 & GLARE#3001 respectively), comparisons were made with the photometry collected in our previous study (Eyles et al. 2005); that of & appears to be consistent with our original data. It should be noted that in our earlier study, deeper HST/NICMOS F110W (‘-band’) & F160W (‘-band’) data were used in place of the VLT/ISAAC -band for (SBM03#1); this is the only object in our selection which falls within the HUDF field. Also, at the time, no IRAC m data were available for – it was not in the channel 2 field of view in the epoch 1 data release. The m detection of object in the deeper epoch 2 data is slightly discrepant with respect to our earlier analysis, in which it was undetected in epoch 1. The stellar ages and mass estimates from stellar population fits presented in Eyles et al. (2005) are not significantly altered with this new photometry (Section 4).
We have also compared our photometry with that in the GOODS-MUSIC catalog, which used PSF-matching of the space- and ground-based data with the ‘ConvPhot’ routine. For our -drop sample, we find in general good agreement for the magnitudes; where discrepancies were noted, visual inspection showed that this was most likely through confusing sources which we have tried hard to eliminate by GALFIT modelling and subtraction. We have chosen to use our aperture magnitudes in the current analysis, corrected to approximate total magnitudes through aperture corrections, as these are most appropriate to barely-resolved sources (such as our -drops in the infrared) and are simple and reproducible. We note however that agreement with the independently-determined GOODS-MUSIC catalog magnitudes is good, and adopting these magnitudes for most sources would not qualitatively affect our stellar age and mass determinations from population synthesis model fits.
| ID | 3.6 m | 4.5 m | ||||
|---|---|---|---|---|---|---|
| () | () | () | ||||
| () | () | () | () | () | ||
| () | () | () | () | |||
| () | () | () | () | |||
| () | () | |||||
| () | ||||||
| () | () | () | ||||
| () | () | () | ||||
| () | () | |||||
| () | ||||||
| () | ||||||
| () | () | () | () | |||
| () | ||||||
| () | () |
† These objects are those which were noted to be confused, and
subsequently had the neighbouring sources successfully subtracted by GALFIT.
⋄ IRAC channel 2 (4.5 m) is anomalously
faint compared to IRAC channel 1 (3.6 m).
∗ This object is most likely a low-mass T-dwarf object (see Section 3.2).
3.3 Spectral Energy Distribution Fitting
Once magnitudes in each of the different wavebands had been obtained, the photometric data were then used to construct SEDs for each of our selected sources. As in our previous work, we made use of the latest Bruzual & Charlot (2003, hereafter B&C) isochrone synthesis code, utilising the Padova-1994 evolutionary tracks (preferred by B&C). The models span a range of 221 age steps approximately logarithmically spaced, from yr to yr, although here we discount solutions older than yr (the age of the Universe at ). The B&C models have 6900 wavelength steps, with high resolution (FWHM 3 Å) and 1 Å pixels over the wavelength range 3300 Å to 9500 Å and unevenly spaced outside this range. We opted to primarily explore models with the Salpeter (1955) initial mass function (IMF), and of solar metallicity. We considered the effects of sub-solar metallicity and adopting the Chabrier (2003) IMF in Eyles et al. (2005, see also Section 4.3). From the range of possible star formation histories (SFH) available, we considered a single stellar population (SSP; an instantaneous burst), a constant star formation rate (SFR), and several exponentially-decaying star formation rate “-models”. These had , where is the star formation rate at time (the formation of the galaxy). We considered exponential star formation histories with decay constants in the range Myr, specifically Myr.
For an SSP (instantaneous burst) model, the B&C synthetic spectra are normalised to an initial total mass of . For the constant SFR model, the B&C template normalization is an SFR of . Additionally, we investigated a model composed of two distinct stellar populations: an ongoing starburst with constant SFR at the time of observation, and an underlying older population that formed via an instantaneous burst sometime previously. We also consider the possibility that the red optical–infrared colours of objects within our sample could be due to intrinsic dust reddening, rather than an age-sensitive spectral break (see Section 4). As in our previous work, we adopted the empirical reddening model of Calzetti (1997), suitable for starburst galaxies.
For each -drop in our sample, the filters were corrected to their rest-frame wavelengths by the appropriate redshift factor. The measured flux in each waveband was folded through the corresponding filter transmission profile, and the best-fit age model was computed via minimisation of the reduced , using the errors measured on the magnitudes. The flux of the models below Lyman- ( Å) was reduced to correct for blanketting by intervening Lyman- forest absorption ( was assumed at ). Some of our data points, particularly those from the HST/ACS imaging, have . However, as done previously, the minimum magnitude error is set to , to account for calibration uncertainties. Non-detections in the VLT/ISAAC & -bands were treated in two different ways. First, the fitting routine was run with all non-detections set to the corresponding detection limits, and a magnitude error of was imposed, giving these filters a very low statistical weighting during the fitting process. Secondly, the fitting was re-run, omitting any filters with non-detections. Checks were carried out on the returned best fit SEDs to ensure that the flux density in the wavelength region of the omitted filter was not in conflict with the corresponding upper limit: this was found to be the case, so we adopted the fits excluding each near-IR waveband in which an object was undetected. In seven of the 16 galaxies in our sub-sample, there was no IRAC detection at in either channel 1 or 2 (Figure 5). We present a stacking analysis of these sources in Section 4.2.
The normalisations (scalings) for the models that produced the best fits to the broadband photometry were returned by the fitting code, and these were then used to calculate the corresponding best-fit total masses (see Section 4.1), using the luminosity distance for the redshift of each -drop. For each fit, the number of degrees of freedom was taken to be the number of independent data points (i.e., magnitudes in different filters). When considering models other than a SSP (instantaneous burst), it was necessary to correct the total ‘mass’ values output by the fitting routine. For a constant SFR model, each of these masses needed to be multiplied by the corresponding best-fit age, since the B&C template normalization has the mass grow by . For the models, the returned ‘mass’ values were corrected by a factor , accounting for the decay timescale and the normalization of the B&C models (where as ). The fits to the B&C models returned ‘total masses’ which were the sum of the mass currently in stars, in stellar remnants, and in gas returned to the interstellar medium (ISM) by evolved stars. For each best-fit model, we also calculated the mass currently in stars for every galaxy, again using information from the B&C population synthesis code. The results of the SED fitting for the nine galaxies with IRAC detections are presented in Tables 3, 4 & 5, where we list both the ‘stellar masses’ and ‘total masses’ (stars, recycled gas and stellar remnants) for each galaxy. The best-fit stellar populations are shown in Figure 4 (for simple star formation histories), Figure 6 (incorporating dust reddening) and Figure 7 (for composite two-component models).
| ID | Model | Age | Total mass | Stellar mass | Current SFR | SSFR | |
|---|---|---|---|---|---|---|---|
| /Myr | / | / | / | / | |||
| const. SFR | |||||||
| Myr | |||||||
| Myr | |||||||
| Myr | |||||||
| Myr | |||||||
| Myr | |||||||
| Myr | |||||||
| Myr | |||||||
| Myr | |||||||
| inst. burst | |||||||
| weak sources | const. SFR | 57 |
⋄ The anomalously-faint IRAC channel 2 (4.5 m) was excluded from the fit.
| ID | Model | Age | Total mass | Stellar mass | Current SFR | SSFR | ||
|---|---|---|---|---|---|---|---|---|
| /Myr | / | / | /mag | / | / | |||
| const. SFR | ||||||||
| Myr | ||||||||
| inst. burst | ||||||||
| Myr | ||||||||
| Myr | ||||||||
| Myr | ||||||||
| Myr | ||||||||
| Myr | ||||||||
| Myr |
⋄ The anomalously-faint IRAC channel 2 (4.5 m) was excluded from the fit.
| ID | Model | Age | Total mass | Stellar mass | burst fraction | Current SFR | SSFR | |
|---|---|---|---|---|---|---|---|---|
| /Myr | / | / | / | / | ||||
| 3 Myr burst | ||||||||
| 3 Myr burst | ||||||||
| 3 Myr burst | ||||||||
| 10 Myr burst | ||||||||
| 3 Myr burst | ||||||||
| 3 Myr burst | ||||||||
| 3 Myr burst | ||||||||
| 30 Myr burst | ||||||||
| 3 Myr burst |
⋄ The anomalously-faint IRAC channel 2 (4.5 m) was excluded from the fit.
† This object was found to produce degenerate results, as each best fit model infers none of its stellar mass is involved in an ongoing (current) starburst. Hence the two population SED model is non-applicable, and so for each burst duration, the same results are produced.
Upon comparison of the results for objects & (SBM03#1 & #3 respectively) with those of our previous analysis (Eyles et al. 2005), we find that the derived stellar ages and masses are broadly consistent; variations are primarily due to differences in the photometry used, as discussed in Section 3.2.


4 Analysis
4.1 Properties of IRAC-detected -drop Galaxies – Balmer/4000 Å Breaks
The Balmer/4000 Å spectral break is sensitive to the luminosity-weighted stellar age777That is, the average age of the stars in the galaxy with each star’s contribution weighted by its luminosity. of a galaxy; the presence of a substantial break indicates that the observed system is being viewed some time after an epoch of substantial star formation. The Balmer break, at a rest wavelength of 3648 Å, is most pronounced when the main-sequence turn-off has reached the A-star population (after a few hundred Myr), whilst the 4000 Å break is due to metal line blanketting in late-type stars. Our SED fitting process is sensitive to the Balmer/4000 Å break, which falls between the and IRAC-3.6 m filters at . For our nine galaxies with significant detections in the Spitzer/IRAC imaging, we present the results of our population synthesis fitting to the SEDs for a range of star formation histories in Tables 3, 4 & 5. We ignore those models which returned best-fit ages Gyr, as these exceed the age of the Universe at and hence are unphysical.
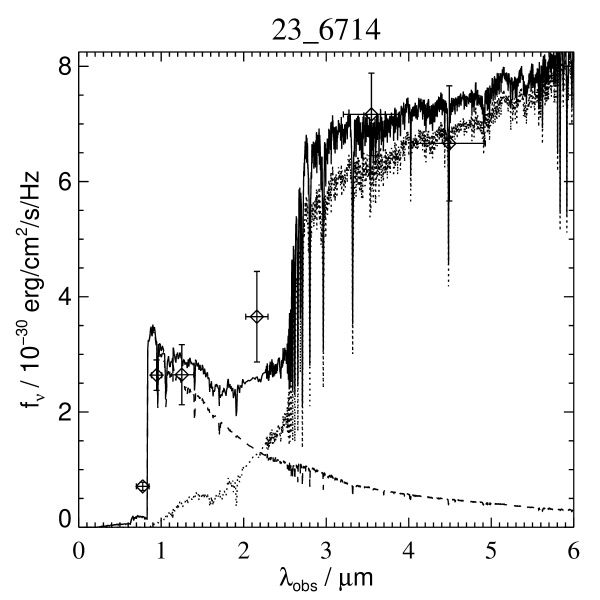
We find evidence for the presence of substantial Balmer/4000 Å breaks in the SEDs of six of our galaxies (312185, 236714, 2585, 324331, 233398 & 132604), each brightening, on average, by a factor of in flux density () from the near-infrared (m) to 3.6 m. These break amplitudes are comparable to those observed at in the Sloan Digital Sky Survey (SDSS; e.g., Kauffmann et al. 2003), and by Le Borgne et al. (2006) in massive post-starburst galaxies in the Gemini Deep Deep Survey (GDDS). For our -drops it is known that there has been at least some recent or ongoing star formation, due to the fact that the -drop Lyman break technique relies on a magnitude-limited selection in the -band, sampling the rest-frame UV (see Section 4.5) which is dominated by young, hot, massive stars. Additionally, for the two bright sources SBM03#1 & #3 which featured in our previous paper (and which are re-analysed here), Keck/Gemini spectra (Bunker et al. 2003; Stanway et al. 2004a) display Lyman- emission, caused by the photoionisation of hydrogen by populations of short-lived OB stars. However, in order to produce the observed Balmer/4000 Å break amplitudes in the SEDs of these six -drops, it is likely that the bulk of their stellar mass formed well before the current period of star formation. If even a modest fraction of the mass is involved in current star formation then it will tend to dilute the break amplitude.
From the fitting of the B&C spectral synthesis models to our photometric data, the inferred luminosity-weighted ages of these six sources all lie in the range Myr, suggesting formation redshifts in the range . Our SED modelling also shows that these -drops with Balmer/4000 Å breaks have considerable stellar masses, in the range . We can draw comparison of these inferred stellar masses to that of an galaxy today, by taking from analysis of the SDSS by Blanton et al. (2003). Using appropriate for a Gyr old population from the B&C models (Salpeter IMF) we calculate the stellar mass of an galaxy today to be , comparable to the estimate of Cole et al. (2001). Hence we find that our six IRAC-detected sources with Balmer/4000 Å breaks have best-fit stellar masses % that of an galaxy observed today.
Exploring the results from the two population composite modelling (Table 5), we find that for these objects, only a small fraction (in the range 0.1% - 1.5%) of their stellar mass is involved in the current star formation episode, indicating that in these cases underlying older stellar populations dominate the mass. This may require previous epochs of extremely intense star formation (see Section 4.6). Assuming the sources for which SED fitting was conducted are representative of the entire -drop population, our results suggest that a significant fraction (%) of the -drop galaxies with contain old, established stellar populations that formed at . Our results also suggest that in the first Gyr after the Big Bang the number density of massive galaxies containing evolved stellar populations is in fact rather high, perhaps contrary to the expectations of some hierarchical models of galaxy formation. For example, the stellar mass function presented in Bower et al. (2005) from the GALFORM model indicates a space density of for galaxies at with stellar masses (interpolating for between the space density values at of and at , with in our adopted cosmology). This would suggest that in the volume of the GOODS-South field there should theoretically be 3 galaxies with stellar masses , using an effective volume of for -drops at (from Stanway, Bunker & McMahon 2003, see also Section 4.5). In our sub-sample of SED fits alone, we have 4 galaxies of this stellar mass; scaling for the incompleteness due to confusion and galaxies outside the GOODS-MUSIC photometric redshift catalog, we infer that there should be such massive galaxies, a factor of 4 higher than the GALFORM model. The recent Yan et al. (2006) paper compares the number density of massive -drops to other CDM simulations by Night et al. (2006). These simulations predict a space density for galaxies with stellar masses of at , a factor of higher space density than the models in Bower et al. (2005), and broadly consistent with our measurements.
We have nine robust detections with IRAC of -drops, and we have discussed the six that show probable Balmer breaks. The remaining three sources with IRAC detections (232897, 243905 and 35111) are fainter and have inconclusive stellar population fits to the photometry, which are compatible with a wide range of SEDs from flat spectra in to a brightening across a spectral break by up to a factor of in .
In order to assess the uncertainties on our mass values, we use the method employed in Eyles et al. (2005) and also adopted by Stark et al. (2006) for galaxies. For a particular SED model, we took the best-fit stellar mass, and allowed it to vary over the range Mstellar, recalculating a reduced for each variation in order to map the confidence intervals for the masses and ages returned by our fitting code. We find typical uncertainties in these properties of each -drop to be percent, and so it is reasonable to assume a 50 percent uncertainty in these values, and subsequently in the stellar mass density (see Section 4.5).
Histograms of the best-fit stellar masses and ages of these nine IRAC-detected objects are given in Figures 9 & 10, respectively. In summary, we find that these IRAC-detected -drops have ages between Myr; several galaxies have ages a significant fraction of the age of the Universe at the epoch (1 Gyr). Contained within these -drops is a significant amount of stellar mass – adding the best-fit masses we obtain a total of present in these nine objects. The majority of this stellar mass is contained within older underlying stellar populations which, considering the inferred ages of six of these -drops, must have formed during earlier vigorous star formation episodes ().


4.2 Properties of IRAC-undetected -drops
The fitting of photometry to the B&C models returned unconstrained SEDs the seven -drops which are not detected at IRAC wavelengths (although some of these can be seen in the IRAC images, they are fainter than the limiting magnitudes). Hence we are unable to constrain their properties to the level that is obtainable for IRAC-detected objects. However, we can still draw some useful information from their analysis. By considering the upper limits on their (m) colours, it is possible to estimate the maximum possible Balmer/4000 Å break amplitudes that may be present in their spectral energy distributions. In five cases, we find that the 3.6 m 3 limiting magnitude is inconsistent with the presence of a Balmer/4000 Å spectral break, as the corresponding 3.6 m limiting flux is actually less than that detected in the -band. For the remaining two IRAC-undetected objects, their 3.6 m non-detections are consistent with flat spectral energy distributions, and the maximum break amplitudes are constrained to be magnitudes ().
The (m) colours exhibited by these IRAC-undetected objects in our sample are noticeably bluer than most of the IRAC-detected sample, as depicted in Figure 14, and this is not simply an effect of limiting magnitude; many of the IRAC-detected sample are fainter in -band than the IRAC-undetected sources. None of our galaxies fall into the ‘IRAC-selected Extremely Red Objects’ (IERO) colour cut of (m) mag (Yan et al. 2004).
We have also stacked four non-detections that are not badly confused (313127, 227650, 3410623 & 337751 [two epochs]) to improve the signal-to-noise (Figure 12) with outlier rejection to reduce the effect of contamination by neighbouring sources. This resulted in a detection at 3.6 m at 26.5 mag, and a marginal detection at 4.5 m of 27.1 mag. The average magnitude of these objects was 26.33. This confirms the very blue (m) color of the IRAC-weak population. Figure 13 shows the fit to this composite SED. For solar metallicity, the best fit is a 57 Myr old continuous star formation model with a total mass of and a stellar mass of (reduced ). For a metallicity of 0.2 solar the best fit is a 67 Myr old continuous star formation model, also with a total mass of and a stellar mass of (reduced ). Hence at , we suggest that whilst a large proportion of -drop sources contain mature stellar populations of considerable stellar mass, there is also a significant fraction of young star-bursting galaxies which have colours consistent with being ‘protogalaxies’ experiencing their first throes of star formation.


4.3 Effects of Dust, Metallicity and IMF
To investigate the effects of differing metallicities on our results, in addition to using solar () metallicity models, we also considered a sub-solar model (0.2). We find that for both these metallicities, the ages and masses of our -drops output by our fitting code are similar, with the sub-solar models returning slightly smaller reduced values.
We wish to address whether or not these sources suffer from significant dust reddening; our earlier two case studies showed little or no evidence for the presence of any intrinsic dust. However, the studies of a spectroscopically confirmed lensed galaxy at (Chary et al. 2005; Schaerer & Pello 2005), and also of a GRB host galaxy (Berger et al. 2006) suggest that these objects suffer from measurable dust extinction ( mag). If objects are generally found to be dusty, then their star formation rates, and hence the global star formation density, will have been underestimated. To investigate this, we re-ran our SED fitting routine whilst incorporating the Calzetti (1997) dust reddening law, appropriate for starburst galaxies. For each of the B&C spectral template age steps, we varied the reddening over the range mag, in steps of mag, and computed the reduced at each step. Inspecting the results presented in Table 4, we find little or no evidence for intrinsic dust reddening in our selection of -drop galaxies, over the wavelength range studied (out to m), with object displaying the highest E(B-V) value of , and several other sources having formal best fits with no reddening. This supports a spectral break interpretation for those objects which significantly brighten in flux between m to 3.6 m, rather than the smoother increase in the continuum that would be produced by dust reddening, indicating the presence of older stellar populations in these galaxies (see Section 4.1).
We were also able to use data at 5.8 m and 8.0 m to constrain the average reddening in our sample. Cutouts of six brightest 3.6m galaxies (all objects with mag, excluding the T-dwarf) were taken from the IRAC images in all four channels. These images in each channel were scaled by the ratio of each galaxy’s 3.6m flux to that of the brightest object in the sample and combined, with weighting by inverse-variance of the scaled images. To remove confusion, the highest and lowest pixels in the pixel stack were rejected. Aperture photometry was then carried out on these combined images to obtain a composite SED for the brighter IRAC detections. Larger apertures of and pixel diameter were used at 5.8 m and 8.0 m to allow for the larger PSF (see Eyles et al. 2005 for details). At 5.8m a detection is present at , whilst at 8.0m we fail to detect the galaxies but are able to obtain a useful limit. This composite SED allows us to rule out reddening of , assuming a solar metallicity and an SED typical of our IRAC detections (see Figure 15). In fact, our composite is somewhat bluer than the solar metallicity SEDs at rest-frame wavelengths of 0.5-1.0 m, and favours a low metallicity ( solar), though solar metallicity cannot be ruled out on the basis of these data.

All of the results quoted in this work were produced via the fitting of B&C spectral synthesis models to our photometry using a Salpeter (1955) power law IMF. To test the effects of differing IMF models on the derived properties of our -drops, for the limiting cases of an instantaneous (SSP) burst model and that of a continuous SFR we also employed a Chabrier (2003) IMF. We find that for a Chabrier IMF, the returned ages of our objects were very similar, but that the stellar masses were less than those produced using a Salpeter IMF. We note, as in Eyles et al. (2005), that the variations in the derived stellar masses primarily stem from a mass re-scaling, arising from differing mass fractions contained in low-mass long-lived stars. The inferred ages of our sources do not significantly vary as this re-scaling is independent of the assumed SFH.
4.4 Line Contamination
It is possible that some of our photometric datapoints may be contaminated due to the presence of strong spectral lines. We cannot definitively remove any contribution by such lines from the measured fluxes without spectroscopy of these emission lines; the most prominent of these would lie at m, where sufficiently deep spectroscopy is not currently viable, but could be done with NIRSpec on the James Webb Space Telescope (JWST). For the moment, we use our estimates of the current star formation rates in each individual galaxy to assess the possible impact of line contamination on our measurement of the spectral energy distributions, and on the fitting of the stellar ages and masses.
We consider first the effect of Lyman- on the -band and -band magnitudes. For three of the galaxies considered here, we have detected Lyman- emission in Keck/DEIMOS and Gemini/GMOS spectroscopy. In the galaxies 236714, 312185 & 232897 at we measure rest-frame equivalent widths of 30, 20 & 30 Å (Stanway et al. 2004a; Bunker et al. 2003; Stanway et al. 2004b). This line emission would cause the - and -band photometry to appear mag brighter than for a pure-continuum source. We note that at , only 25% of Lyman-break galaxies have Lyman- rest-frame equivalent widths of Å (Shapley et al. 2006).
We now consider the effect of H, which is redshifted into IRAC channel 2 (m) at , most of the redshift range selected through the -drop technique. We use the rest-frame UV flux density to derive the unobscured star formation rate, and then convert this to an H line luminosity using the relations in Kennicutt (1998). We then remove this line contribution to the IRAC channel 2 filter and recompute the magnitude. In all cases, the effect was a dimming of mag (at most a 10% effect). This is consistent with the range in H rest-frame equivalent widths of Å at reported by Erb et al. (2006). We also consider the effect of dust causing the star formation rate to be underestimated from the rest-UV by a factor of relative to H (see Erb et al. 2005), which would cause at most an overestimate of mag in the channel 2 photometry (comparable to the typical error on the detection). We have re-run the stellar population fitting to the ‘line-free’ SEDs, and get similar results (within the confidence intervals) for the stellar ages and stellar masses; this is largely because our constraint on the break amplitude comes mainly from the IRAC channel 1, which is much less affected by line contamination that channel 2. For the higher-redshift portion of our sample (), channel 1 may be affected by [OIII] 5007/4959 Å and H 4861 Å, although these are typically weaker than H in star-forming galaxies. We note that for most of our -drop sample, the IRAC channel 1 flux density is slightly brighter than channel 2 (in , see Table 2), which again argues against significant line contamination, as the brighter line (H) is centrally located in channel 2.
4.5 Stellar Mass Density
We have made measurements of the stellar masses and luminosity-weighted ages for a number of probable galaxies in the GOODS-South field. In order to progress from our previous individual case studies to a measurement of the global stellar mass density at this epoch, consideration of several selection effects is required, most notably: i) incompleteness due to foreground confusion; ii) our apparent magnitude limit; and iii) our pre-selection of star-forming galaxies in the rest-frame UV through the -drop Lyman break technique. Due to these, our sample of -drop galaxies will necessarily provide a lower limit on this stellar mass density at . Where possible, we attempt to correct for these effects, as described below.
Our sample of 17 objects with clean Spitzer/IRAC photometry was taken from a list of 31 sources for which either spectroscopic or reliable photometric redshifts were available, out of our full sample of 52 -drops (excluding two probable EROs). We were able to infer the properties of nine of these galaxies (IRAC-detected), whilst one was found to exhibit peculiar colours (see Figure 8) and was ignored as a likely low-mass T-dwarf object. The remaining seven IRAC-undetected objects are consistent with having young ages and low stellar masses. As discussed in Section 3.1, the remaining 14 of the 31 objects were discarded due to the severity of confusion in the IRAC imaging; attempts to remove the neighbouring sources using GALFIT proved unsuccessful, and hence reliable photometry was unobtainable. However, inspection of the -band magnitudes and also the () colours (Table 1) using small apertures for the HST/ACS suggests that the Spitzer-confused galaxies, and the galaxies without GOODS-MUSIC photometric redshifts, have the same distribution of -magnitudes and colours as those 16 galaxies which were isolated or had neighbouring sources successfully subtracted. Hence we are able to compensate for the loss of these objects from our sample, by making the reasonable assumption that the stellar mass distribution of the -drop population is independent of IRAC contamination (i.e., we assume that the occurrence of a foreground confusing source in the IRAC image is random and not related to the intrinsic properties of the -drop). Hence we can now correct for the stellar mass present in those IRAC-confused sources and those without GOODS-MUSIC photometric redshifts. Taking the sum of the best-fit masses for our 16 -drops with clean photometry, we find a total stellar mass of (most of this coming from the nine IRAC-detected objects). Scaling this to account for all 51 of our -drops in GOODS-South with (after removing two lower-redshift EROS and the T-dwarf star), we find that the minimum total stellar mass contained in these sources is approximately .
Another selection effect involved in our study is due to the nature of the Lyman break technique. The -drop method is reliant upon the detection of a source at rest-frame UV wavelengths; for galaxies, in the HST/ACS -band. As the majority of the flux in this wavelength region is due to hot, short-lived OB stars, all galaxies selected via the -drop technique must have at least some ongoing or very recent star formation (within Myr). Hence dormant objects (pure post-starburst), experiencing no current or recent star formation episodes will not be included amongst the -drop population, and the stellar mass contained within them will not be accounted for. The abundance of such objects at is essentially unknown, and highly uncertain even for redshifts ; cluster surveys suggest that post-starburst (‘E+A’) galaxies may comprise as much as 20% of the total cluster population (e.g., Dressler et al. 1999; Tran et al. 2003), although other estimates suggest they are present in far fewer numbers, at % of the total population at low redshift (Balogh et al. 1999). At slightly higher redshifts, Doherty et al. (2005) find that a significant fraction (%) of the ‘Extremely Red Object’ population at exhibit post-starburst spectra. Hence it is impossible to accurately account for these post-starburst galaxies and their contribution to the global stellar mass density and SFR. As a consequence our derived values in this work are necessarily lower limits. This distribution of stellar ages and masses is shown in Figure 11. Two selection effects combine to restrict the objects in Figure 11 to near the diagonal of the plot. Objects in the upper left, with low stellar masses and high ages will be below our IRAC detection limits. Objects in the lower right of the plot, with high stellar masses and high star formation rates would be very bright in -band, and our survey volume is not large enough to find such luminous objects.
A fraction of -drop galaxies are likely to be below our selection threshold ( mag). We now attempt to estimate the stellar mass contribution of those objects which lie at the faint end of the UV luminosity function, below our limit. The faintest -band magnitude of an object in our selection of 16 -drop galaxies is . This would correspond to a luminosity limit of , if is the same for the Lyman-break galaxies at as for the well-studied populations at , where mag (AB), and (Steidel et al. 1999). If in fact at is a factor of fainter than at (as has been suggested by Bouwens et al. 2005) then our limit corresponds to . Assuming a faint end slope with a steep (Bunker et al. 2004), we integrate the Schechter function, truncating it at (as in Steidel et al. 1999), and consequently obtain a factor by which we need to scale our measurement of the total stellar mass in order to account for objects which lie below our luminosity limit. We note that although our selection of objects reside at different redshifts, for the sake of simplicity we assume a fixed redshift () so that only a single luminosity cut is used (using an “effective volume” accounts for the effect of different redshifts and hence luminosities for a fixed limiting magnitude). From this, we estimate the scaling factor to be (for the Steidel and Bouwens values of ), resulting in a possible total (corrected) stellar mass of . The range of correction factors change only slightly if the faint end slope appropriate for Lyman break galaxies at is adopted (, Steidel et al. 1999) rather than (the corrections are compared to , a per cent effect).
However, performing this kind of correction is fraught with uncertainty. The rest-frame UV, as discussed previously, reflects the current star formation distribution. Yet from our results, we find a range of star formation histories for our 16 selected -drop sources, with some galaxies showing evidence for significant older populations, and others containing very young stellar populations. Therefore, correcting the observed mass function of these objects for those which are below our selection limit is likely to be highly inaccurate, as the relation between the mass function and the rest-UV luminosity function is non-trivial.
We now move to calculate the comoving stellar mass density at . We reiterate our value will be a lower limit, as we can only consider those objects which satisfy our selection criteria and detection capabilities. Taking a redshift interval of , the effective comoving volume for the GOODS-south field is , as in Stanway, Bunker & McMahon (2003), which takes into account the luminosity bias against higher-redshift sources in our redshift selection window due to the apparent magnitude cut in -band. Using our confusion-corrected total stellar mass of , we find the lower limit to the stellar mass density to be . This value may be around if the correction factor for sources on the faint-end slope of the luminosity function is reasonable, and higher still when post-starburst and dust-obscured galaxies are also taken into account. Our lower limit value is consistent with the findings of Yan et al. (2006), who find a stellar mass density of at . The lower limit we place on the stellar mass density at is roughly 20% that measured by Stark et al. (2006) at , requiring the assembly of between and . Assuming constant star formation over this period, this corresponds to a star formation rate density of , a factor of four larger than measured by Bunker et al. (2004) at in the UDF. The shortfall could be explained by substantial star formation below the sensitivity limits of Bunker et al. or an extreme amount of dust extinction which obscures ongoing star formation, which would support the suggestion by Stark et al. (2006).
Galaxies at intermediate redshifts, such as in Dickinson et al. (2003) and Rudnick et al. (2003), have fairly reliably placed constraints on the stellar mass already formed at redshifts (see Figure 16). These studies imply that roughly 50-75% of the stellar mass seen at the present day formed by , i.e. out of the present day stellar mass of (such as in Cole et al. 2001). This work, as well as that of Yan et al. (2006) and Stark et al. (2006), extend these measurements to , and indicate that there may be more stellar mass already assembled at these early epochs than expected in some hierarchical scenarios (see Section 4.1). If exceptional objects such as Mobasher et al. (2005) are considered real and possibly common – at a stellar mass density another greater than those discussed in here and in Yan et al. (2006) – the shortfall of these model scenarios is even greater. Different choices in the IMF slope and metallicity may narrow the predicted versus observed stellar mass density. However, with the conservative lower limits expressed here and in other studies, most corrections (such as reddening, surface brightness effects, and limiting magnitude) tend to actually increase the mass.

4.6 SFRs and Star Formation Histories
The fitting of the B&C spectral synthesis models to our photometric data has allowed us to gain estimates of the current SFRs for our selected -drop galaxies. For our six sources which show evidence of significant Balmer/4000 Å breaks, we find the inferred SFRs span a substantial range, , involving between of their total stellar mass (derived from the two-population composite model fits generally favoured for these objects). In particular, & have, for their two population SED fits, inferred SFRs of & . (SBM03#1) is the brightest confirmed -drop in the UDF, with mag, and (SBM03#3) is the brightest -drop in the GOODS-South field, with mag; these two objects were the focus of our previous study. Their estimated SFRs are by far the highest of our six Balmer/4000 Å break sources; the fainter four have inferred current SFRs between . The remaining three IRAC-detected objects have inferred ongoing SFRs of . In fact, two of these sources nominally have SFRs of inferred by their SEDs, as the preferred models for each of these are of young systems being viewed shortly after a single starburst (i.e. no current star formation, but rather very recent activity, within 10 Myr so the rest-UV continuum still persists).
In Eyles et al. (2005) we commented that SBM03#1 & SBM03#3 may not be typical of the entire -drop population; our analysis here suggests that in fact a substantial proportion of -drops share similar masses and ages. However, they are significantly different from the subset of our selected objects which are undetected at IRAC wavelengths, and which appear to be much younger and less massive (see Section 4.2). Hence these two objects are actually quite representative of the older, more massive -drop population, but in terms of current star formation rates, they do stand out alone as the most currently active of -drop galaxies in the GOODS-South field.
Consideration of the specific star formation rate (SSFR; e.g., Brinchmann & Ellis 2000) is useful when investigating the SFRs of our galaxies. It is defined as specific , and is a measure of the fraction of the total stellar mass that is currently being born as stars. The SSFR is similar in concept to the dimensionless ‘-parameter’ (e.g., Brinchmann et al. 2004), which is the ratio of the current star formation rate to the past average. The specific SFRs calculated from the results of the SED fitting are tabulated in Tables 3, 4 & 5. For the best-fit models to our IRAC-detected sources, we calculate values of specific (Figure 17), extending up to for the composite SED of the IRAC-undetected galaxies. These are comparable to the values inferred by Egami et al. (2005) for a lensed galaxy (Kneib et al. 2004), and are also consistent with the findings of Yan et al. (2006). These specific SFR values are an indication of vigorous star formation occurring in these nine IRAC-detected objects at the time of observation, and these specific star formation rates are typically higher than the lower-redshift results of Sajina et al. (2006) and Gil de Paz et al. (2000). However, we find that in most cases, the past-average SFR must be comparable, if not greater than the current SFR. This is the reason why the star formation histories that, for most of these objects, return the best-fit results are decaying SFR models; the exponential (tau) models, and for the younger galaxies, the burst (SSP) models. If this was not the case, then there would not have been enough time, prior to the epoch of observation, for the stellar masses of these objects to assemble, considering their inferred formation redshifts. Assuming the limiting case of a constant SFR, most of our nine IRAC-detected objects require past average SFRs of the order of SFR, with some needing SFRs perhaps as high as . The relative lack of candidate galaxies and the resultant continuing low luminosity density seen by Bouwens et al. (2004b) in the HST/NICMOS UDF suggests that reionisation may have been achieved by a considerably higher SFR density at even earlier epochs (although see Bouwens et al. 2005), and our analysis here supports this.

Taking a different approach towards exploring the previous star formation rates of our -drop sample, rather than assuming constant SFRs prior to observation, we take into account the best-fit star formation histories of each of our galaxies. Figure 18 is a composite plot of the best-fit SFH (solid lines) for our nine IRAC-detected objects. The dashed line represents represents the total SFR contribution due to these objects, smoothed using a time interval of 100 Myr, from the time of formation (obtained from their inferred ages) until the epoch of observation (i.e. the redshift at which they now reside). The estimated star formation rate densities extrapolated over each epoch shown in Figure 18 represent lower limits to the actual SFRD due to the populations of galaxies not accounted for in our galaxy selection (see Section 4.5). However, our results seem to suggest that the star formation density increases at , relative to our measured value at .

4.7 Implications for Reionisation
From SED fitting to HST and Spitzer photometry, we have determined the best-fit preceding star formation histories of individual -drop galaxies observed at . In Section 4.6 we summed these to recover the star formation rate at , necessarily a lower limit on this quantity as our galaxy census in incomplete (magnitude-limited on the rest-frame UV). However, our results do suggest a vigorous phase of star formation activity, prior to . If the resultant ionizing photons are able reach the IGM (i.e. if the escape fraction is high) then this star formation may have played a key role in the reionisation of the Universe.
Madau, Haardt & Rees (1999) estimate the density of star formation required for reionisation, and we use their equation 27 (updated for a more recent concordance cosmology estimate of the baryon density from Spergel et al. 2003 of ):
| (1) |
This relation is based on the same Salpeter Initial Mass Function as we have used throughout. is the concentration factor of neutral hydrogen, . Simulations suggest (Gnedin & Ostriker 1997). The escape fraction of ionizing photons () for high-redshift galaxies is highly uncertain (e.g., Steidel, Pettini & Adelberger 2001), but we consider here the limiting case of a high escape fraction (i.e., no absorption by H I/dust).
It has recently been suggested by Stiavelli, Fall & Panagia (2004) that this star formation rate density requirement for reionisation could be relaxed by a factor of at since the IGM temperature will be higher (perhaps 20,000 K rather than the 10,000 K assumed in Madau, Haardt & Rees 1999). Figure 19 shows this star formation rate requirement for reionisation (solid curve, for a 20,000 K IGM) overplotted with the star formation rate at inferred from the population synthesis fits to the -drops and corrected for incompleteness (confused galaxies and those below our magnitude limit; see Section 4.6). This past star formation rate should still be regarded as a lower limit, as dormant post-starburst galaxies are not found by the Lyman break technique. The incompleteness is likely to be larger at higher redshifts (earlier times) since by a redshift of 6 the light from these fading populations will be swamped by any more recent star formation activity in these galaxies.
What is apparent from Figure 19 is that our inferred lower limit on the past star formation activity at is sufficient to achieve reionisation, provided that the escape fraction is high. The star formation history at higher redshift is more poorly constrained, and could easily be sufficient given our incomplete census of galaxies (at our lower limit is only a factor of below the reionisation requirement). This interpretation may be consistent with the CMB temperature-polarisation correlation measurement from WMAP (Spergel et al. 2006) which indicates the Universe was 50% reionized at . However, we emphasize that the above assumes that the UV ionizing photons escape galaxies; if star formation is dust obscured even at these high redshifts, or if the galaxy HI is optically thick to these photons, then our inferred past star formation may be insufficient to provide the necessary ionizing background. Yan et al. (2006) point out that if the escape fraction is lower, , then the previous star formation inferred from Spitzer studies of -drops may only be able to sustain reionisation for short periods.

5 Conclusions
We have used multi-waveband imaging of the GOODS-South field (HST/ACS, VLT/ISAAC & Spitzer/IRAC) to measure the stellar mass density of the -drop galaxy population. From an original catalog of 52 -drop candidates, we concentrated on 31 objects for which either spectroscopic or robust photometric redshifts from GOODS-MUSIC were available. A further 14 of these were eliminated from our analysis due to IRAC-confusion with neighbouring sources, which could not be satisfactorily removed. One further source, singled out as having peculiar photometry, had its SED matched very well to the spectra of a T-dwarf object – an interloper in our sample. Fitting of SEDs to B&C spectral synthesis models was conducted on the remaining 16 galaxies, and properties including ages, stellar masses and star formation histories were constrained. Of these, nine were detected at IRAC wavelengths, and six of these showed evidence for significant Balmer/4000 Å spectral breaks, brightening across the break by up to a factor of in . These indicate the presence of old stellar populations that dominate the stellar masses of these galaxies, with inferred ages of Myr, and stellar masses of . During the SED modelling process, we considered the possibility of intrinsic dust reddening, and also the effects of differing metallicities and IMF models. We do not find evidence of substantial dust reddening in our -drop galaxies, and using differing metallicities did not have any significant effect on our derived properties. Use of a Chabrier, rather than Salpeter IMF had little effect on our inferred galaxy ages, but did reduce our stellar mass values by % due to a mass re-scaling. The results of the SED fitting of the three other fainter IRAC-detected sources were inconclusive. For the seven objects undetected in the IRAC wavebands, their SED fitting inferred much younger, less massive systems than their detected counterparts.
Using the constrained properties of our -drop sample, we were able to calculate a value for the stellar mass density of , correcting for those objects eliminated from our analysis due to their un-treatable IRAC-confusion and those lacking GOODS-MUSIC photometric redshifts. Using a somewhat uncertain correction in order to account for the stellar mass in objects below our -band magnitude selection limit, this value could perhaps be . Any post-starburst and dust-obscured sources would not be found using the -drop selection technique, and hence our stellar mass density value is necessarily a lower limit, and is consistent with the estimates of Yan et al. (2006).
Exploring the previous star formation histories of our -drops, as inferred from their SED fitting, we suggest that the global star formation of these sources may have been substantially higher prior to the epoch of observation, and the resultant UV flux at may have played an important role in reionizing the Universe.
Acknowledgments
This work is based on observations made with the Spitzer Space Telescope, which is operated by the Jet Propulsion Laboratory, California Institute of Technology under NASA contract 1407. Observations have been carried out using the Very Large Telescope at the ESO Paranal Observatory under Program ID: LP168.A-0485. This paper is based in part on observations made with the NASA/ESA Hubble Space Telescope, obtained from the Data Archive at the Space Telescope Science Institute, which is operated by the Association of Universities for Research in Astronomy, Inc., under NASA contract NAS 5-26555. These observations are associated with proposals #9425 & 9583 (the GOODS public imaging survey). We are grateful to the GOODS team for making their reduced images public. LPE acknowledges a Particle Physics and Astronomy Research Council (PPARC) studentship supporting this study. AJB is grateful for financial support from a Leverhulme Prize. ERS gratefully acknowledges support from NSF grant AST 02–39425. The compilation of T-dwarf spectra comes from Sandy Leggett. We acknowledge useful discussions with Richard McMahon, Karl Glazebrook and Michelle Doherty, and thank Carlton Baugh for providing electronic tables of the GALFORM stellar mass function. LPE thanks Rob King for useful discussions about low mass T-dwarf objects. We are grateful to Andrea Grazian and Adriano Fontana for providing us with the GOODS-MUSIC sample: a multicolour catalog of near-IR selected galaxies in the GOODS-South field. We thank the referee for useful comments on this manuscript.
References
- [Balogh 1999] Balogh, M.L., Morris, S.L., Yee, H.K.C, Carlberg, R.G., Ellingson, E. 1999, ApJ, 527, 54
- [Baugh et al. 2002] Baugh, C.M., Benson, A.J., Cole, S., Frenk, C.S., Lacey, C. 2001, ‘The Mass of Galaxies at Low and High Redshift’, Venice, eds. Bender, R., Renzini, A.
- [Becker et al. 2001] Becker R. H. et al., 2001, AJ, 122, 2850
- [Beckwith 2003] Beckwith, S., Somerville, R., Stiavelli, M. 2003, STScI Newsletter vol 20 issue 04
- [Berger 2006] Berger, E., et al. 2006, submitted to ApJ, astro-ph/0603689
- [Bertin 1996] Bertin, E., Arnouts, S. 1996, A & AS, 117, 393
- [Blanton 2003] Blanton, M.R., et al. 2003, ApJ, 592, 819
- [Bouwens 2004a] Bouwens, R.J., et al. 2004a, ApJL, 606, 25
- [Bouwens 2004b] Bouwens, R.J., et al. 2004b, ApJL, 616, 79
- [Bouwens 2005] Bouwens, R.J., Illingworth, G.D., Thompson, R.I., Franx, M. 2005, ApJL, 624, 5
- [Bouwens 2006] Bouwens, R.J., Illingworth, G.D. 2006, New Astron. Rev., 50, 152
- [Bower 2006] Bower, R.G., Benson, A.J., Malbon, R., Helly, J.C., Frenk, C.S., Baugh, C.M., Cole, S., Lacey, C.G. 2006, MNRAS, 370, 645
- [Brinchmann 2000] Brinchmann, J., Ellis, R.S. 2000, ApJ, 536, 77
- [Brinchmann 2004] Brinchmann, J., et al. 2004, MNRAS, 351, 1151
- [Bruzual 2003] Bruzual, G.A., Charlot, S. 2003, MNRAS, 344, 1000
- [Bunker 2003] Bunker, A.J., Stanway, E.R., Ellis, R.S., McMahon, R.G., McCarthy, P.J. 2003, MNRAS, 342, L47
- [BunkerStanway 2004] Bunker, A.J., Stanway, E.R., astro-ph/0407562
- [Bunker 2004] Bunker, A.J., Stanway, E.R., Ellis, R.S., McMahon, R.G. 2004, MNRAS, 355, 374
- [Bunker 2005] Bunker, A.J., Stanway, E.R., Ellis, R.S., McMahon, R.G., Eyles, L.P., Lacy, M. 2005, New Astron.Rev. 50, 94
- [Calzetti 1997] Calzetti, D. 1997, AJ, 113, 162
- [Chabrier 2003] Chabrier, G. 2003, PASP, 115, 763
- [Chary 2005] Chary, R., Stern, D., Eisenhardt, P. 2005, ApJL, 635, 5
- [Chen 2004] Chen, H.-W., Marzke, R.O. 2004, ApJ, 615, 603
- [Cimatti 2002] Cimatti, A., et al. 2002, A&A, 381, L68
- [Cole 2001] Cole, S., et al. 2001, MNRAS, 326, 255
- [Dickinson 2004] Dickinson, M.E., et al. 2004, ApJ, 600L, 99
- [Dickinson & Giavalisco 2003] Dickinson, M., Giavalisco, M. 2003, “Massive Galaxies at Low and High Redshift”, p3224, ESO, Springer
- [Doherty 2005] Doherty, M., Bunker, A.J., Ellis, R.S., McCarthy, P.J. 2005, MNRAS, 361, 525
- [Dressler 1999] Dressler, A., Smail, I., Poggianti, B.M., Butcher, H., Couch, W.J., Ellis, R.S., Oemler A. 1999, ApJS, 122, 51
- [Dunlop 2006] Dunlop, J.S., Cirasuolo, M., McLure, R.J. 2006, submitted to MNRAS, astro-ph/0606192
- [Egami 2005] Egami, E., et al. 2005, ApJL, 618, 5
- [Erb 2003] Erb, D.K., et al. 2003, ApJ, 591, 101
- [Erb 2006] Erb, D.K., Steidel, C.C., Shapley, A., Pettini, M., Reddy, N., Adelberger, K. 2006, ApJ, 647, 128
- [Eyles 2005] Eyles, L.P., Bunker, A.J., Stanway, E.R., Lacy, M., Ellis, R.S., Doherty, M. 2005, MNRAS, 364, 443
- [Fazio 2004] Fazio, G.G., et al. 2004, ApJS, 154, 10
- [Ferguson et al. 2004] Ferguson, H., et al. 2004, ApJL, 600, 107
- [Finlator 2006] Finlator, K., Davé, R., Oppenheimer, B.D. 2006, MNRAS (submitted) astro-ph/0607039
- [Ford 2003] Ford, H.C., et al. 2003, SPIE, 4854, 81
- [Giavalisco 2003] Giavalisco, M. 2003, AAS, 202, 1703
- [Giavalisco 2004] Giavalisco, M., et al. 2004, ApJL, 600, 103
- [Giacconi 2002] Giacconi, R., et al. 2002, ApJS, 139, 369
- [Gil de Paz 2000] Gil de Paz, A., Arágon-Salamanca, A., Gallego, J., Alonso-Herrero, A., Zamorano, J., Kauffmann, G. 2000, MNRAS, 316, 357
- [Gnedin 1997] Gnedin, O.Y., Ostriker, J.P. 1997, 474, 223
- [Grazian 2006] Grazian, A., et al. 2006, A&A, 449, 951
- [Hawley 2002] Hawley, S.L.,et al. 2002, AJ, 123, 3409
- [Inoue 2006] Inoue, A.K., Iwata, I., Deharveng, J-M. 2006, MNRAS, 371, 11
- [Kauffmann 2003] Kauffmann, G., et al. 2003, MNRAS, 341, 33
- [Kennicutt 1998] Kennicutt, R.C. 1998, ARA & A, 36, 189
- [Kneib et al. 2004] Kneib, J.-P., Ellis, R.S., Santos, M.R., Richard, J. 2004, ApJ, 607, 697
- [Koekemoer et al. 2002] Koekemoer A. M., Fruchter A. S., Hook R. N., Hack W. 2002, ‘HST Calibration Workshop’, eds. Arribas, S., Koekemoer, A.M., Whitmore, B. (STScI: Baltimore), p. 325
- [Kogut 2003] Kogut, A., et al. 2003, ApJS, 148, 161
- [Lacy 2005] Lacy, M., et al. 2005, ApJS, 161, 41
- [Le Borgne 2006] Le Borgne, D., et al. 2006, ApJ, 642, 48L
- [Leggett 2002] Leggett, S. K., Hauschildt, P.H., Allard, F., Geballe, T. R., Baron, E. 2002, MNRAS, 332, L78
- [Madau 1999] Madau, P., Haardt, F., Rees, M.J. 1999, ApJ, 514, 648
- [Madau 1998] Madau, P., Pozzetti, L., Dickinson, M. 1998, ApJ, 498, 106
- [Mobasher 2005] Mobasher, B., et al. 2005, ApJ, 635, 832
- [Night 2006] Night, C., Nagamine, K., Springel, V., Hernquist, L. 2006, MNRAS, 366, 705
- [Oke 1983] Oke, J.B., Gunn, J.E. 1983, ApJ, 266, 713
- [Patten 2006] Patten, B.M., et al. 2006, ApJ (in press), astro-ph/0606432
- [Peng 2002] Peng, C.Y., Ho, L.C., Impey, C.D., Rix, H.-W. 2002, AJ, 124, 266
- [Rudnick 2003] Rudnick, G. et al. 2003, ApJ, 599, 847
- [Sajina 2006] Sajina, A., Scott, D., Dennefeld, M., Dole, H., Lacy, M., Lagache, G. 2006, MNRAS, 369, 939
- [Salpeter 1955] Salpeter E.E., 1955, ApJ, 121, 161
- [Schaerer 2005] Schaerer, D., Pello, R. 2005, MNRAS, 362, 1054
- [Shankar 2006] Shankar, F., Lapi, A., Salucci, P., De Zotti, G., Danse, L. 2006, ApJ, 643, 14
- [Shapley 2003] Shapley, A., Steidel, C., Pettini, M., Adelberger, K. 2003, ApJ, 588, 65
- [Somerville 2004] Somerville, R.S., Lee, K., Ferguson, H.C., Gardner, J.P., Moustakas, L.A., Giavalisco, M. 2004, ApJ, 600, L171
- [Somerville 2001] Somerville, R.S., Primack, J.R., Faber, S.M. 2001, MNRAS, 320, 504
- [Spergel 2006] Spergel, D.N., et al. 2006, submitted to ApJ, astro-ph/0603449
- [Spergel 2003] Spergel, D.N., et al. 2003, ApJ, 148, 175
- [Stanway 2003] Stanway, E.R., Bunker, A.J., McMahon, R.G. 2003, MNRAS, 342, 439
- [Stanway 2004] Stanway, E.R. 2004, PhD thesis, Cambridge
- [Stanway 2004a] Stanway, E.R., Bunker, A.J., McMahon, R.G., Ellis, R.S., Treu, T., McCarthy, P.J. 2004a, ApJ, 607, 704
- [Stanway 2004b] Stanway, E.R., et al. 2004b, ApJL, 604, 13
- [Stanway 2005] Stanway, E.R., McMahon, R.G., Bunker, A.J. 2005, MNRAS, 359, 1184
- [Stark 2006] Stark, D.P., Bunker, A.J., Ellis, R.S., Eyles, L.P., Lacy, M. 2006, submitted to ApJ, astro-ph/0604250
- [Steidel 1995] Steidel, C.C., Pettini, M., Hamilton, D. 1995, AJ, 110, 2519
- [Steidel 1996] Steidel, C.C., Giavalisco, M., Pettini, M., Dickinson, M.E., Adelberger, K.L. 1996, ApJL, 462, 17
- [Steidel 1999] Steidel, C.C., Adelberger, K.L., Giavalisco, M., Dickinson, M.E., Pettini, M. 1999, ApJ, 519, 1
- [Steidel 2001] Steidel, C.C., Pettini, M., Adelberger, K.L. 2001, ApJ, 554, 981
- [Stiavelli 2004] Stiavelli, M., Fall, S.M., Panagia, N. 2004, ApJS, 600, 508
- [Tran 2003] Tran, K.H., Franx, M., Kelson, D.D., van Dokkum, P. 2003, ApJ, 599, 865
- [Vanzella 2005] Vanzella, E., et al. 2005, A&A, 434, 53
- [Vanzella 2006] Vanzella, E., et al. 2006, A&A, 454, 423
- [Yan 2004] Yan, H., Windhorst, R.A. 2004, ApJL, 612, 93
- [Yan 2004a] Yan, H., et al. 2004, ApJ, 616, 63
- [Yan 2005] Yan, H., et al. 2005, ApJ, 634, 109
- [Yan 2006] Yan, H., Dickinson, M., Giavalisco, M., Stern, D., Eisenhardt, P.R.M., Ferguson, H.C. 2006, ApJ (in press), astro-ph/0604554