Detection of a Far-Infrared Bow-Shock Nebula Around R Hya:
the First MIRIAD Results
Abstract
We present the first results of the MIRIAD (MIPS [Multiband Imaging Photometer for Spitzer] Infra-Red Imaging of AGB [asymptotic giant branch] Dustshells) project using the Spitzer Space Telescope. The primary aim of the project is to probe the material distribution in the extended circumstellar envelopes (CSE) of evolved stars and recover the fossil record of their mass loss history. Hence, we must map the whole of the CSEs plus the surrounding sky for background subtraction, while avoiding the central star that is brighter than the detector saturation limit. With our unique mapping strategy, we have achieved better than one MJy sensitivity in three hours of integration and successfully detected a faint ( MJy sr -1), extended () far-infrared nebula around the AGB star R Hya. Based on the parabolic structure of the nebula, the direction of the space motion of the star with respect to the nebula shape, and the presence of extended H emission co-spatial to the nebula, we suggest that the detected far-IR nebula is due to a bow shock at the interface of the interstellar medium and the AGB wind of this moving star. This is the first detection of the stellar-wind bow-shock interaction for an AGB star and exemplifies the potential of Spitzer as a tool to examine the detailed structure of extended far-IR nebulae around bright central sources.
1 Introduction
Evolved stars of intermediate initial mass ( to 8 M⊙) are major contributors to the interstellar medium (ISM). However, the mechanism by which the ISM is enriched is not well understood. The circumstellar envelopes (CSEs) of evolved stars, asymptotic giant branch (AGB) and post-AGB stars in particular, contain the fossil record of their mass loss history, and therefore, have the potential to verify many aspects of stellar evolution. IRAS and ISO data indicated that parsec-sized dusty CSEs exist around these infrared (IR) objects (e.g. Young, Phillips, & Knapp 1993). Moreover, these large CSEs show evidence for mass-loss variations that correlate with evolution of the star (e.g. Speck, Meixner, & Knapp 2000).
Previous observations lacked the sensitivity and spatial resolution to investigate the full extent and structure of these large dusty CSEs. Using the unique sensitivity and mapping capabilities of the Multiband Imaging Photometer for Spitzer (MIPS; Rieke et al. 2004) on-board the Spitzer Space Telescope (Werner et al., 2004), we have been conducting far-IR imaging observations to probe the material distribution in the extended CSEs around several evolved stars. Our maps are the deepest yet and have the most complete spatial coverage, allowing the most detailed study into the CSE structure to date.
In this letter, we report the first results of the MIPS IR Imaging of AGB Dustshells (MIRIAD) project (Program ID 20258) for the AGB star R Hya. This star is a Mira variable well-known for its decreasing period (Zijlstra, Bedding, & Mattei 2002) and the presence of a detached CSE (Young et al., 1993; Hashimoto & Izumiura, 1997; Hashimoto et al., 1998). Below, we will describe the observations (§2) and data reduction (§3), and present the results and discussion (§4).
2 Observations
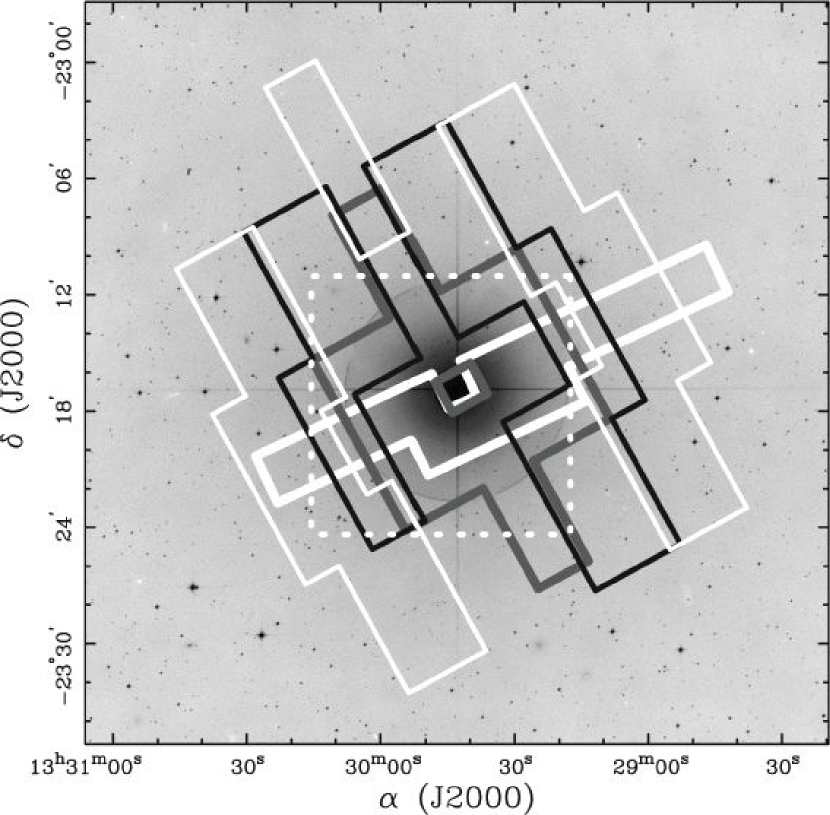
We observed R Hya at 70 and using Spitzer/MIPS on 2006 February 26 as part of the MIRIAD project. R Hya was the first target for which we obtained data in both of the MIPS Ge bands. We mapped a roughly square region () at and a nearly linear region () at , while avoiding the central region ( and at 70 and , respectively), using exposures in photometry/fixed-cluster-offset mode. The MIRIAD maps can cover the entire target CSEs plus enough surrounding sky for background subtraction. Care was taken to avoid the central star that is brighter than the saturation limit of the MIPS arrays. Fig. 1 visualizes the sky coverage.
The observations consisted of three Astronomical Observation Requests (AORs), which sequentially covered the outer, mid, and inner regions of the CSE. To maximize the dynamic range, we used progressively longer exposure times for regions further away from the central star: per-pixel, per-Data-Collection-Event (DCE) exposure times were 18.87, 62.91, and 251.66 s for the inner, mid, and outer regions, respectively. The “gap” in the sky coverage (along the in-scan direction towards the south of the central star; Fig. 1) is unavoidable because the central star would fall onto the array when the aperture covers this region.
The offsetting was done by a single AOR so that the linear map was swept in both the forward and backward directions along the cross-scan direction. To maximize the dynamic range, we repeated exposures at and near both ends of the linear map: per-pixel exposure times are 167.76, 251.56, and 335.52 s depending on the number of repeats. Our observing scheme is also summarized in Table 1.
3 Data Reduction
We initially constructed mosaicked maps from the pipeline-calibrated basic calibrated data (BCD) products using the Mosaicker software (Ver. 093005) provided by the Spitzer Science Center (SSC)111http://ssc.spitzer.caltech.edu/postbcd/. However, the BCD-mosaicked maps were affected by detector artifacts. The effects were especially severe in the map, in which the “streaking” (due to residual variations of the slow response of the detector as a function of time) was rampant and worsened increasingly towards the end of the observing sequence, probably because residual cosmic-ray charge slowly built up in the detector.
Hence, we performed a custom data reduction from the raw data. First, we used the latest Ge Reprocessing Tools (GeRT) software (Ver. 041506 of S14 processing)222http://ssc.spitzer.caltech.edu/mips/gert/ to create our own BCDs. The most important step in custom BCD generation is to do proper stimulator-flash (stim) calibration (Gordon et al., 2005). For the data from the mid and outer AORs at , for which most of the emission is of sky (the zodiacal light, ISM, and cosmic IR background), the best results were produced from stim calibrations with piece-wise linear fitting excluding stim frames on the nearby point sources. For the data from the inner region at , for which most of the field can be bright by the central star and CSE emission, the best outcome was yielded from calibrations with spline fitting using all the raw data. For the data, for which emission is of both sky and non-sky, the best results were obtained from stim calibrations with piece-wise linear fitting using all the raw data.
For each BCD pixel, we followed the time evolution of pixel values and performed a linear least-squares fit using only the “sky” values to determine the baseline for sky subtraction. We tested this baseline fitting on the pixel, column, and column-of-four-pixel (readout is done for four columns at a time) bases, and the pixel basis fitting yielded the best results. This process worked especially well in removing linear streakings in the maps which resulted from the column-dependent responsivity and the relatively linear way in which photometry-mode mapping scans across the sky.
However, the data obtained from the last offset position at showed some residual column-dependent artifacts. This probably occurred because the detector responsivity had been compromised by the brightest region of the field near the central star scanned immediately before the end of the observing sequence (i.e. the detector is due for annealing). The remaining artifacts were removed by flat-fielding all the frames taken at the last offset position using their median frame.
After the baseline fitting, we subtracted the derived sky value at the time of exposure from the entire dataset on pixel basis. The subtracted sky values were 13.9, 14.4, and 15.5 MJy respectively for the outer, mid and inner regions at and 19.0 MJy at . The increasing sky value with decreasing aperture at illustrates the need of baseline determination far enough away from the central object. We adopted 13.9 MJy as the sky emission, and the difference was added back to the BCDs for the mid and inner regions (0.5 and 1.6 MJy sr-1, respectively) to compensate for the over-subtraction. The expected sky emission, obtained by the Spot Software333http://ssc.spitzer.caltech.edu/propkit/spot/, is 11.5 and 14.2 MJy respectively at 70 and . This step was done by our own IDL script.
Finally, the custom-processed BCDs were mosaicked together using the Mosaicker while cosmic-rays were removed. The resulting maps still showed some structure intrinsic to the diffraction spikes of the point-spread-function (PSF), especially at . Thus, we used the Spitzer TinyTim (STinyTim) software444http://ssc.spitzer.caltech.edu/archanaly/contributed/ to create simulated point-response-function (PRF) maps (with the emissivity assumption), and subtracted them from the mosaicked maps by scaling flux within an annulus around the central unobserved region.
The resulting maps are in pix-1 and pix-1 (sub-pixelized from the nominal scale by a factor of two) with the average of seven and 15 sky coverages per pixel and the maximum of 45 and 80 sky coverages per pixel respectively at 70 and . At least four sky coverages are achieved in and of the mapped area respectively at 70 and to fulfill the minimum level of redundancy. The resulting one-sigma sensitivities are consistent with the performance estimates done by the SENS-PET tool555http://ssc.spitzer.caltech.edu/tools/senspet/: we have achieved the required sensitivity level of 1 MJy as planned. Characteristics of the resulting maps are listed in Table 2.
4 Results and Discussion
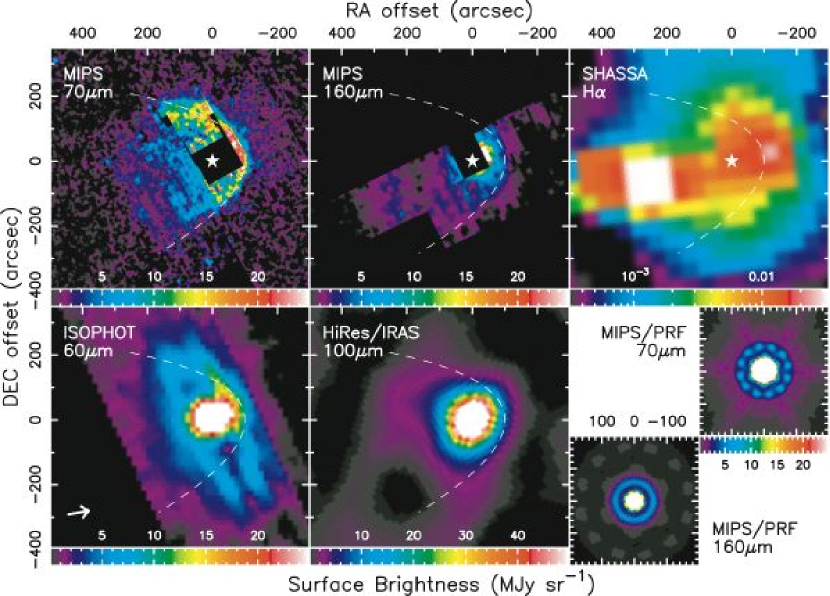
Fig. 2 shows the background/PRF-subtracted, mosaicked MIPS color maps of R Hya at (top left) and (top middle), which clearly display faint, extended emission. Also shown are a pipeline-processed ISOPHOT PHT32 map at (bottom left; Hashimoto & Izumiura 1997)666http://www.iso.vilspa.esa.es/, a HiRes-processed IRAS map at (bottom middle)777http://irsa.ipac.caltech.edu/IRASdocs/hires_over.html, an H map (top right) from the Southern H-Alpha Sky Survey Atlas888http://amundsen.swarthmore.edu/SHASSA/ (SHASSA; Gaustad et al. 2001) and STinyTim PRF maps at 70 and (bottom right).
The map shows an arc-like surface brightness distribution at MJy surrounded by even fainter emission ( MJy ) of diameter. The arc structure appears parabolic with the apex pointed towards the WNW direction: the distance to the apex from the central star is (see below). While the southern part of the arc remains physically thin (), the northern part becomes wider (). The width of the parabola at the tail end is about . The brightest region near the apex of the parabolic arc (of MJy ) can also be seen in the ISOPHOT map. In retrospect, the ISOPHOT map appears to have captured most of the arc to the north, in spite of the instrumental artifacts.
The map also displays an extended nebulosity along the arc ( MJy ), which appears consistent with the HiRes/IRAS map as well as the high-resolution IRAS map based on the pyramid maximum entropy method (Hashimoto et al., 1998). There is a bright spot near the NW edge of the central unobserved region (at from the star), which does not spatially correspond to the arc. It is probably caused by the near-IR light leak at (SSC 2005; For R Hya, m mag and F160µm/F).
The integrated flux over the entire nebula is and Jy respectively at 70 and . These values are the lower limits since there is no data in the central unobserved region. From the scaled PRFs, the stellar fluxes at 70 and are estimated to be 33.9 and 4.5 Jy, respectively.
Van Buren & McCray (1988) have found parabolic far-IR nebulae around hot stars and attributed some of them to bow shocks at the interface between the stellar wind and ISM around a moving star. R Hya is known to have the proper motion of (-60.73, 11.01) mas yr-1 (Perryman et al., 1997), towards the apex of the arc as indicated by the bottom left arrow in Fig. 2. Moreover, the shape of the far-IR arc closely follows the curve (where is the distance between the apex and star), which has been shown numerically to represent the apex shape of the stellar-wind bow-shock by Mac Low et al. (1991), as delineated by the dashed lines in Fig. 2. Furthermore, H emission is extended along the parabolic apex and axis, showing the presence of ionized gas in these regions.
Therefore, we attribute the parabolic far-IR nebula around R Hya to shock-excited line emission (such as [O I] 63 & 146µm) and locally heated dust emission arising from a stellar-wind bow-shock interface between the ISM and the swept-up AGB wind of this moving star. This is the first detection of the stellar-wind bow-shock interaction for an AGB star, and is a surprise discovery given our original aim of the study. Nevertheless, our results exemplify the potential of Spitzer as a tool to examine the far-IR structure of extended emission around the bright central object. A follow-up IR spectroscopy can determine the emission characteristics.
At 165 pc (Zijlstra et al., 2002) with the -10 km s-1 radial velocity (Knapp et al., 1998), the space velocity of R Hya is km s-1 into the direction 12∘ away (receding side) from the plane of the sky. The asymmetric CO profiles (Knapp et al., 1998; Teyssier et al., 2006) can then be explained by this inclined bow-shock, in which the receding and approaching shock fronts intersect with the line of sight at distinct angles.
The physical dimensions of the observed bow shock (0.03 pc thick located at pc ahead of the star) are consistent with the stellar-wind bow-shock models for AGB stars (Wareing et al., 2006a). Adopting the mass-loss rate of (Zijlstra et al., 2002), wind velocity of 10 km s-1 (e.g., Knapp et al. 1998), and formula for derived from the momentum conservation across the shock (eq.2 of Van Buren et al. 1990), the ambient H density is 0.4 cm-3 and the shock surface density is g cm-2. Thus, the estimated amount of matter contained in the bow-shock is about , assuming a paraboloidal bow-shock of with a opening radius.
The MIPS maps indicate the presence of matter in the downstream (emission at MJy up to away, which is corroborated by the H map). The downstream emission may arise from a tail of a steady-state bow shock that is formed by ram-pressure stripping from the head of the shock (Wareing et al., 2006a). The local emission peaks at away in the downstream may correspond to vortices that results from instabilities in the downstream flow shed off from the bow shock (C. J. Wareing, in preparation). Modeling of the bow shock nebula of R Hya will be presented by Wareing et al. (2006b).
References
- Gaustad et al. (2001) Gaustad, J. E., McCullough, P. R., Rosing, W. & Van Buren, D. 2001, PASP, 113, 1326
- Gordon et al. (2005) Gordon, K. D., et al. 2005, PASP, 117, 503
- Hashimoto & Izumiura (1997) Hashimoto, O., & Izumiura, H. 1997, Ap&SS, 255, 349
- Hashimoto et al. (1998) Hashimoto, O., Izumiura, H., Kester, D. J. M., & Bontekoe, Tj. R. 1998, A&A, 329, 213
- Knapp et al. (1998) Knapp, G. R., Young, K., Lee, E., & Jorissen, A. 1998, ApJS, 117, 209
- Mac Low et al. (1991) Mac Low, M.-M., Van Buren, D., Wood, D. O. S., & Churchwell, E. 1991, ApJ, 369, 395
- Perryman et al. (1997) Perryman, M. A. C., et al. 1997, A&A, 323, L49
- Rieke et al. (2004) Rieke, G., et al. 2004, ApJS, 154, 25
- Speck, Meixner, & Knapp (2000) Speck, A. K., Meixner, M., & Knapp, G. R. 2000, ApJ, 545, L145
- Spitzer Science Center (2005) Spitzer Science Center. 2005, Spitzer Observers’ Manual - Version 6.0 (Pasadena: SSC), http://ssc.spitzer.caltech.edu/documents/som/
- Teyssier et al. (2006) Teyssier, D., Hernandez, R., Bujarrabal, V., Yoshida, H., & Phillips, T. G. 2006, A&A, 450, 167
- Young et al. (1993) Young, K., Phillips, T. G., & Knapp, G. R. 1993, ApJS, 86, 517
- Van Buren et al. (1990) Van Buren, D., Mac Low, M.-M., Wood, D. O. S., & Churchwell, E. 1990, ApJ, 353, 570
- Van Buren & McCray (1988) Van Buren, D., & McCray, R. 1988, ApJ, 329, L93
- Wareing et al. (2006a) Wareing, C. J., et al. 2006a, MNRAS, 366, 387
- Wareing et al. (2006b) Wareing, C. J., et al. 2006b, MNRAS, submitted
- Werner et al. (2004) Werner, M. W. et al. 2004, ApJS, 154, 1
- Zijlstra et al. (2002) Zijlstra, A. A., Bedding, T. R., & Mattei, J. A. 2002, MNRAS, 334, 498
| Image Scale | Field | Exposure | IntegrationaaIntegration times are per-pixel per-DCE in “real” second. | DCE | Total Duration | |||||
|---|---|---|---|---|---|---|---|---|---|---|
| Band | AOR KEY | Start Time | (arcsec) | Size | (sec) | Cycle | (sec) | Offsets | Counts | (sec) |
| (outer) | 14472448 | 2006 Feb 26 07:15:03 | 9.84 | Large | 10 | 2 | 125.83 | 13 | 418 | 6493 |
| (mid) | 14472704 | 2006 Feb 26 08:59:52 | 9.84 | Large | 10 | 1 | 62.91 | 8 | 145 | 2625 |
| (inner) | 14472960 | 2006 Feb 26 09:40:12 | 9.84 | Large | 3 | 1 | 18.87 | 6 | 109 | 1204 |
| 14472192 | 2006 Feb 26 04:20:36 | 16.0 | Small | 10 | 2 | 83.88 | 22 | 792 | 10256 |
| Flux (Jy) | Sky, (MJy sr-1) | Coverage (pix-1) | ||||||||
|---|---|---|---|---|---|---|---|---|---|---|
| Band | CSEaaLower-limit. | StarbbBased on the scaled PSF/PRF maps. | Sky | ccOne-sigma sensitivity estimated with the SENS-PET tool. | Avg | Best | ||||
| (mosaic) | 33.9 | 13.9 | 0.47 | 0.15 | … | 7 | 45 | |||
| (outer) | … | … | 13.9 | 0.56 | 0.16 | 0.26 | 5 | 45 | ||
| (mid) | … | … | 14.4 | 0.68 | 0.21 | 0.37 | 3 | 24 | ||
| (inner) | … | … | 15.5 | 0.86 | 0.28 | 0.68 | 2 | 17 | ||
| 4.5 | 19.0 | 0.31 | 0.12 | 0.38 | 15 | 80 | ||||