22institutetext: INAF-IASF Bologna, via P. Gobetti, 101, I-40129 Bologna, Italy
An angular power spectrum analysis of the DRAO 1.4 GHz polarization survey: implications for CMB observations
Abstract
Aims. The aim of the present analysis is to improve the knowledge of the statistical properties of the Galactic diffuse synchrotron emission, which constrains sensitive CMB anisotropy measurements.
Methods. We have analysed the new DRAO 1.4 GHz polarization survey together with the Stockert 1.4 GHz total intensity survey and derived the angular power spectra (APSs) of the total intensity, the polarized emission, and their cross-correlation for the entire surveys and for three low-intensity regions.
Results. The APSs of the diffuse synchrotron emission are modelled by power laws. For the and modes, a slope of for the multipole range is found. By the extrapolation of these results to 70 GHz, we can estimate the Galactic synchrotron contamination of CMB anisotropies, and we find results that are compatible with the ones coming from WMAP 3-yr data. In the low-intensity regions, the cosmological primordial B mode peak at should be clearly observable for a tensor-to-scalar ratio and a synchrotron temperature spectral index . Its detection is also possible for and , in case a separation of the foreground from the CMB signal could be achieved with an accuracy of . For the TE mode, a mask excluding (for ) or (for ) from the surveys is sufficient to render the foreground contamination negligible, thus confirming the ability of WMAP to have a clear view of the temperature-polarization correlation peak and antipeak series.
Key Words.:
Polarization – Galaxy: general – Cosmology: cosmic microwave background – Methods: data analysis.1 Introduction
The polarized Galactic diffuse synchrotron radiation is expected to be the major foreground at GHz on intermediate and large angular scales () at medium and high Galactic latitudes. At about 1 GHz, the synchrotron emission is the most important radiative mechanism out of the Galactic plane. Consequently, radio frequencies are the natural range for studying it, though it might be affected by Faraday rotation and depolarization. Before the DRAO survey became available, the Leiden polarization surveys (Brouw & Spoelstra (1976)) provided a sky coverage, allowing to estimate the Galactic synchrotron APS on intermediate and large scales (La Porta & Burigana (2006)). However, these surveys have sparse sampling, low sensitivity, and a good signal-to-noise ratio only for the brightest regions in the sky. A new linear polarization survey of the northern celestial hemisphere at 1.42 GHz with an angular resolution has recently been completed using the DRAO 26 m telescope (Wolleben et al. (2006)). The survey has a spacing, , of in right ascension and from to in declination, which requires interpolation to construct equidistant cylindrical (ECP) maps with (Wolleben (2005)). The final map has an rms-noise of about 12 mK, which is unique so far in terms of sensitivity. The polarized intensity map appears cold and patchy at high Galactic latitudes, except for the “North Polar Spur” (NPS), extending far out of the plane at about 111The NPS has been extensively studied (see Egger & Aschenbach (1995) and references therein) and is interpreted as the shock front of an evolved local supernova remnant.. We used the polarization data in combination with the Stockert total intensity map at 1.42 GHz (Reich 1982; Reich & Reich 1986), having the same angular resolution, similar sensitivity, and , to investigate the statistical properties of the Galactic diffuse synchrotron emission. The major purpose of the analysis is the comparison of the foreground fluctuation properties with those of the CMB anisotropy field, as drawn in standard cosmologies. Therefore, we described the anisotropy field statistical properties in terms of its angular power spectrum (APS)222 The angular scale and the angular power spectrum multipole are related by . (see Peebles (1993); Kamionkowski et al. (1997); Zaldarriaga (2001)) and adopted HEALPix333http://healpix.jpl.nasa.gov/ (Górski et al. (2005)) as the tessellation scheme for the sphere. A detailed description of the algorithm to convert the original ECP maps into HEALPix maps was given by La Porta et al. (2005).
 |
 |
 |
 |
 |
 |
2 Selected areas and data analysis
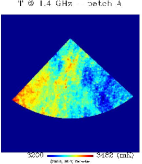
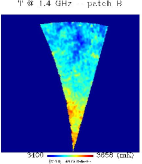
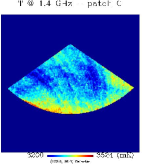
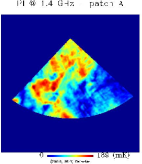
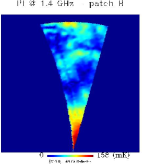
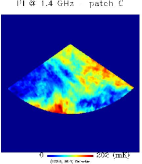
We selected three areas with low polarized intensities
(see Fig. 1), which are
identified by the following Galactic coordinates:
Patch A - , ;
Patch B - , ;
Patch C - , .
Being interested in the diffuse Galactic
synchrotron emission at 1.4 GHz, we
subtracted discrete sources (DSs) from the total
intensity map (very few sources are visible
in polarization out of the plane).
We
performed a 2-dimensional Gaussian fitting using the NOD2-software library (Haslam (1974)),
which also allowed us to estimate the diffuse background.
We are confident that at DSs with peak flux densities
exceeding Jy have been removed that way
(see Burigana et al. 2006 for a map of the subtracted DSs).
We then derived the APSs of the
fluctuation fields (i.e., after subtraction of the mean value
from the maps) for the three selected areas and the whole survey coverage
using the HEALPix facility
anafast.
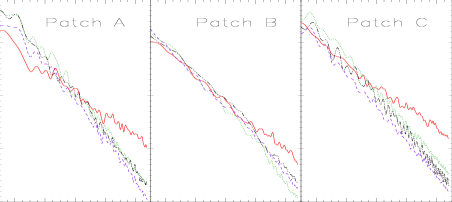
Figure 2 shows the APSs obtained
for the selected areas in both temperature and polarization.
| Coverage | Best-fit parameters | |||
|---|---|---|---|---|
| (mK2) | (mK2) | |||
| A | ||||
| B | ||||
| C | ||||
In all cases, the polarization APSs are rather similar444 In particular, . We then introduce the quantity , which will be used in the following best-fit analysis. On the contrary, the and modes of the primordial CMB anisotropies differ largely as they are induced by different mechanisms (e.g., Seljak & Zaldarriaga 1997; Kosowsky 1999).. This fact might indicate that depolarization due to differential Faraday rotation should not be relevant in such sky regions at the investigated angular scales. In fact, rotation measure (RM) maps (Johnston-Hollitt et al. (2004); Dineen & Coles (2005)) obtained interpolating RM data of extragalactic sources show very low values in correspondence to such areas. However, the degree of polarization is on average a few percent, well below the maximum theoretical value of (Ginzburg & Syrovatskii (1965)). The reason for the low fractional polarization is not clear. One possibility is that depolarization other than differential depolarization is present (e.g., Sokoloff et al. (1998)).
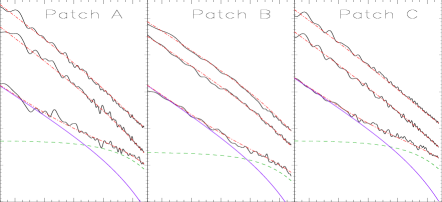
The maps show the Galactic synchrotron emission and non-subtracted DSs convolved with the telescope beam and contaminated by noise. We then fitted the APSs of both total intensity and polarization (namely , , and ) by modelling them as . We exploited the power law approximation and assumed a symmetric Gaussian beam, i.e., a window function , where . The contribution of non-subtracted DSs has been simply modelled with a constant term according to the formalism of Poisson fluctuations from extragalactic point sources (Toffolatti et al. (1998)), expected to represent the largest fraction of the non-subtracted DSs. From extragalactic source counts at 1.4 GHz (Prandoni et al. (2001)) we estimate mK2 for (adding or subtracting quoted errors to the best-fit number counts we (conservatively) get mK2). A guess of the noise contribution is given by , where is the number of pixels in the HEALPix map and , being the number of the ECP pixels corresponding to each HEALPix pixel at a given latitude (for the total intensity maps of the selected areas, mK corresponding to mK2). The best-fit results for all patches are listed in Table 1 and shown in Fig. 3. For temperature, the parameter range for the Galactic synchrotron emission APS is for the slope and ( in mK2) for the amplitude. The DS contribution is in the range mK2, which is consistent with the above source counts estimate, within the errors555The bulk of the factor of discrepancy between the value of recovered by our fit and that predicted from best-fit number counts can in fact be produced by the survey sky sampling () of . For example, considering a lower limit corresponding to (instead of 0) in the integral over in Eq. (2) of Toffolatti et al. (1998), decreases by a factor .. For polarization, the derived slopes are generally steeper, varying in the interval for and for . The DS contribution is on average much lower than in temperature, since it is compatible with zero666The best-fit results may suggest a polarization degree (obtained considering the contribution of the subtracted DSs, mK2, to the temperature APS also) considerably higher than %, the value found for NVSS extragalactic (mainly steep spectrum) sources (Mesa et al. 2002; Tucci et al. 2004). It may imply a presence (or a combination) of spurious instrumental polarization at small scales, of a significant contribution from highly polarized Galactic sources (Manchester et al. (1998)) non-subtracted in the maps, or of a flattening of the diffuse synchrotron polarized emission APS at in higher resolution data on smaller sky areas (Baccigalupi et al. 2001; Carretti et al. 2006)..
3 Discussion: implications for CMB observations
We have extrapolated the recovered APS of the and modes to 70 GHz and compared it with the APS of the CMB polarization anisotropy777We used the CMBFAST code (version 4.5.1) for the computation of the CMB APS (http://www.cmbfast.org/). for a CDM model including scalar and tensor perturbations compatible with the recent WMAP 3-yr results888http://lambda.gsfc.nasa.gov/ (Spergel et al. 2006). The frequency range between 60 GHz and 80 GHz seems the less contaminated by Galactic synchrotron and dust foregrounds in both temperature (Bennett et al. 2003) and polarization (Page et al. 2006) at angular scales . The accurate measure of the mode is of particular relevance for breaking the existing degeneracy in cosmological parameter estimation, when only temperature anisotropy data are available (e.g., Bond et al. 1995, Efstathiou & Bond 1999). The detection of the primordial mode is of fundamental importance for testing the existence of a stochastic cosmological background of gravitational waves (e.g., Knox & Turner 1994). The results of our comparison have been displayed in Fig. 4 for two choices of the temperature spectral index (). The APS extrapolated from the entire DRAO survey is also shown. It exceeds the CMB mode even at the peak at for . For , the two APSs are almost comparable. Figure 4 also shows the APS extrapolated from the DRAO survey excluding the region and adopting 999This APS is consistent with the WMAP foreground polarization APS at 63 GHz (see Fig. 17 in Page et al. 2006), thus supporting an effective GHz polarization spectral index far out of the Galactic plane.. Such a sky mask reduces the Galactic APS below the CMB mode for . In this case, the CMB mode peak at is comparable to (or exceeds) the synchrotron signal for tensor-to-scalar ratios . For the three patches and , the cosmological mode peak at is comparable to (or exceeds) the Galactic synchrotron signal extrapolated with , while it is larger by a factor (in terms of ) for . Furthermore, a separation of the Galactic synchrotron polarized signal from the CMB one with a % accuracy (in terms of ) would allow to detect the CMB mode peak at even for if . Similar results for the detection of the B mode peak at have been inferred from 1.4 GHz polarization observations of a small region with exceptionally low Galactic foreground contamination (Carretti et al. (2006)), though at the CMB B mode is expected to be dominated by the B mode generated by lensing (Zaldarriaga & Seljak 1998). Finally, we note that for a sky coverage comparable with those of the considered patches (%), the cosmic and sampling variance does not significantly limit the accuracy of the CMB mode recovery at larger than some tens.
The CMB correlation constrains the reionization history from the power at low multipoles and the nature of primordial fluctuations from the series of peaks and antipeaks (e.g., Kogut 2003; Page et al. 2006). In Fig. 5 we compare the mode APS of the Galactic emission extrapolated to 70 GHz with the CMB one. The APS of the whole DRAO survey indicates a significant Galactic contamination at , even for . The use of suitable Galactic masks (e.g., excluding regions at for or for ) greatly reduces the Galactic foreground contamination even at low multipoles. For the three cold patches, the Galactic mode is negligible compared to the CMB one, independently of the adopted . The mode antipeak at turns out to be very weakly affected by Galactic synchrotron contamination in all cases.


Acknowledgements.
We warmly thank G. De Zotti and L. Toffolatti for useful discussions. We are grateful to R. Wielebinski for a careful reading of the original manuscript. We warmly thank the anonymous referee for constructive comments. Some of the results in this paper have been derived using HEALPix (Górski et al. 2005). The use of the CMBFAST code (version 4.5.1) is acknowledged. L.L.P. was supported for this research through a stipend from the International Max Planck Research School (IMPRS) for Radio and Infrared Astronomy at the Universities of Bonn and Cologne.References
- Baccigalupi et al. (2001) Baccigalupi, C., Burigana, C., Perrotta, F. et al. 2001, A&A, 372, 8
- Bennett et al. (2003) Bennett, C. L., Hill, R. S., Hinshaw, G. et al. 2003, ApJS, 148, 97
- Bond et al. (1995) Bond, J. R., Davis, R. L., & Steinhardt, P. J. 1995, ApL&C, 32, 53
- Brouw & Spoelstra (1976) Brouw, W. N., & Spoelstra, T. A. T. 1976, A&AS, 26, 129
- Burigana et al. (2004) Burigana, C., La Porta, L., Reich, P., & Reich, W. 2006, AN, 327, 5/6, 491
- Carretti et al. (2006) Carretti, E., Poppi, S., Reich, W., et al. 2006, MNRAS, 367, 132
- Dineen & Coles (2005) Dineen, P., & Coles, P. 2005, MNRAS, 362, 403
- (8) Efstathiou, G., & Bond, J. R. 1999, MNRAS, 304, 75
- Egger & Aschenbach (1995) Egger, R. J., & Aschenbach, B. 1995, A&A, 294, L25
- Ginzburg & Syrovatskii (1965) Ginzburg, V. L., & Syrovatskii, S. I. 1965, ARA&A, 3, 297
- Górski et al. (2005) Górski, K. M., Hivon, E., Banday, A. J. et al. 2005, ApJ, 622, 759
- Haslam (1974) Haslam, C. G. T. 1974, A&AS, 15, 333
- Johnston-Hollitt et al. (2004) Johnston-Hollitt, M., Hollitt, C. P., & Ekers, R. D. 2004, in The Magnetized Interstellar Medium, ed. B. Uyaniker et al. (Copernicus GmbH), 13
- Kamionkowski et al. (1997) Kamionkowski, M., Kosowsky, A., & Stebbins, A. 1997, Phys. Rev. D, 55, 7368
- Knox & Turner (1994) Knox, L., & Turner, M. S. 1994, Phys. Rev. Lett., 73, 3347
- Kosowski (1999) Kosowsky, A. 1999, NewAR, 43, 157
- Kogut (2003) Kogut, A. 2003, NewAR, 47, 977
- La Porta & Burigana (2006) La Porta, L., & Burigana, C. 2006, A&A, accepted, astro-ph/0601371
- La Porta et al. (2005) La Porta, L., Reich, P., Burigana, C., & Reich, W. 2005, MPIfR-Memo,1
- Manchester et al. (1998) Manchester, R. N., Han, J. L., Qiao, G. J. 1998, MNRAS, 295, 280
- Mesa et al. (2002) Mesa, D., Baccigalupi, C., De Zotti, G. et al. 2002, A&A, 396, 463
- Page et al. (2006) Page, L., Hinshaw, G., Komatsu, E. et al. 2006, ApJ, submitted, astro-ph/0603450
- Peebles (1993) Peebles, P. J. E. 1993, Principles of Physical Cosmology, Princeton University Press
- Peiris et a. (2003) Peiris, H. V., Komatsu, E., Verde, L. et al. 2003, ApJS, 148, 213
- Prandoni et al. (2001) Prandoni, I., Gregorini, L., Parma, P. et al. 2001, A&A, 365, 392
- Reich & Reich (1986) Reich, P., & Reich, W. 1986, A&AS, 63, 205
- Reich (1982) Reich, W. 1982, A&AS, 48, 219
- Seljak& Zaldarriaga (1997) Seljak, U., & Zaldarriaga, M. 1997, Phys. Rev. Lett., 78, 2054
- Sokoloff et al. (1998) Sokoloff, D. D., Bykov, A. A., Shukurov, A. et al. 1998, MNRAS, 299, 1985
- Spergel et al. (2006) Spergel, D. N., Bean, R., Dore, O. et al. 2006, ApJ, submitted, astro-ph/0603449
- Toffolatti et al. (1998) Toffolatti, L., Argüeso Gómez, F., De Zotti, G. et al. 1998, MNRAS, 297, 117
- Tucci et al. (2004) Tucci, M., Martínez-González, E., Toffolatti, L. et al. 2004, MNRAS, 349, 1267
- Wolleben (2005) Wolleben, M. 2005, PhD Thesis, Bonn University, Germany
- Wolleben et al. (2006) Wolleben, M., Landecker, T. L., Reich, W., & Wielebinski, R. 2006, A&A, 448, 411
- Zaldarriaga & Seljak (1998) Zaldarriaga, M., & Seljak, U. 1998, Phys. Rev. D, 58, 3003
- Zaldarriaga (2001) Zaldarriaga, M. 2001, Phys. Rev. D, 64, 15