TIRAVEL - Template Independent RAdial VELocity measurement
Abstract
We propose a new approach to measure differential radial velocities, mainly for single-lined spectroscopic binaries. The proposed procedure – TIRAVEL (Template Independent RAdial VELocities) – does not rely on a prior theoretical or observed template, but instead looks for a set of relative Doppler shifts that simultaneously optimizes the alignment of all the observed spectra. We suggest a simple measure to quantify this overall alignment and use its maximum to measure the relative radial velocities. As a demonstration, we apply TIRAVEL to the observed spectra of three known spectroscopic binaries, and show that in two cases TIRAVEL performs as good as the commonly used approach, while in one case TIRAVEL yielded a better orbital solution.
keywords:
methods: data analysis – methods: statistical – techniques: radial velocities – techniques: spectroscopic – binaries: spectroscopic1 Introduction
Since the seminal works of Simkin (1974) and Tonry & Davis (1979), the cross-correlation technique to measure astronomical Doppler shifts has become extremely popular. The advent of digitized spectra and computers rendered it the preferred method in astronomical fields that require measurement of radial velocities (RVs) from observed spectra, ranging from binary and multiple stellar systems to cosmology. In recent years, improvements in the precision of RVs measured through cross-correlation opened the way to the detection of many extrasolar planets (e.g., Mayor & Queloz 1995).
The cross-correlation technique is conceptually simple and can be presented in an intuitive manner. It searches for the velocity shift of the observed stellar spectrum which maximizes the correlation with a predetermined template. The template is assumed to adequately represent the object spectrum with no Doppler shift. The properties of the cross-correlation technique have been studied extensively, in an effort to improve its precision and overcome its few limitations, and various methods have been suggested to estimate its precision (e.g., Tonry & Davis 1979; Connes 1985; Murdoch & Hearnshaw 1991; Bouchy et al. 2001).
The precision of the individual RVs depends on several factors, mainly on the amount of spectral information and the signal-to-noise ratio () of the spectra. Another crucial factor is the quality of the template spectrum, and the extent to which it represents the actual stellar spectrum. Common practice is to use a theoretically calculated spectrum as template (e.g., Latham et al. 2002), a high exposure of another similar star or the observed star itself (e.g., Howarth et al. 1997).
The theoretical synthetic spectrum might have some systematic differences relative to the actual stellar spectrum. This happens not only because the theory of stellar atmospheres is still not perfect and the spectral line lists are not complete, but also because every star is somewhat different from other stars, by its distinct abundances of the various atoms and ions in particular. Similar problems occur when an observed spectrum is used as template. An observed spectrum, either of the same star or of a different star, introduces random noise to the template, thus alienating it again from the true stellar spectrum.
We present here a new approach, TIRAVEL, to derive the relative velocity of stellar spectra without using any template. The approach is based on the simple idea that when two spectra of the same star are available, one can use cross-correlation to measure a relative Doppler shift between the two spectra, each spectrum effectively acting as a template for the other one. TIRAVEL is a generalization of this approach for more than two spectra. We will show that for large number of spectra, this approach is equivalent to having a high- effective template. Section 2 introduces the approach, while Section 3 applies it to three real test cases. We discuss the test results and the applicability of TIRAVEL in Section 4.
2 TIRAVEL
TIRAVEL is basically a multi-spectral generalization of the conventional cross-correlation technique. When we cross correlate two spectra we scan a set of potential shifts between the spectra and score them by the degree of mutual similarity between the two shifted spectra. This score is based on the correlation coefficient, which has been shown to be an optimal similarity measure under various assumptions (e.g., Zucker 2003).
Suppose we wish to estimate the relative Doppler shift between two spectra and . The two spectra are described as functions of the pixel number – , where Thus, the Doppler shift results in a uniform linear shift of the spectrum (Tonry & Davis 1979). For simplicity we assume the spectra were already ’continuum-subtracted’ and normalized, i.e.:
| (1) | |||||
| (2) |
The cross-correlation function is then defined as:
This expression is essentially the correlation coefficient between the two spectra after they have been shifted according to the trial relative shift . A higher value of corresponds to better agreement between the two sequences. Furthermore, it is well known that .
TIRAVEL generalizes the cross-correlation procedure to the case of a set of spectra by considering the correlation matrix . The entry is the cross-correlation between the -th and -th spectrum, as a function of their relative shift . In order to measure the overall agreement for a given set of shifts we propose to use – the largest eigenvalue of the matrix . We will show that this estimate reduces to the correlation coefficient for
The rationale behind this measure is simple and intuitive. At the correct alignment, all the spectra are supposed to be easily modeled by one principal component, or template. The highest eigenvalue of the correlation matrix measures the degree to which we can describe the spectra by one single principal component, as is well known from Principal Component Analysis (PCA) theory (e.g., Murtagh & Heck 1987). The eigenvector of , corresponding to the eigenvalue , can be used to produce the principal component itself, or in other words, the effective template TIRAVEL ’used’ in order to produce the RVs. The elements of this eigenvector, with proper normalization, are the optimal weights with which the indvidual spectra should be summed to produce this ’template’. This is especially important in cases where the ratios are varying considerably among the observed spectra.
The value of the pairwise correlation coefficient can be interpreted easily and intuitively, since values closer to unity mean better agreement between the two sequences, and values close to zero mean poorer agreement. We suggest to transform to obtain a similar behaviour:
TIRAVEL essentially seeks the maximum of as a function of the relative shifts . Each trial set of the relative shifts requires the calculation of the corresponding correlation matrix . Therefore, an important preliminary step in the computation should be the calculation of the cross-correlation functions, corresponding to all the pairs of different spectra. The matrix elements are then simply sampled from the pre-calculated cross-correlation functions.
Note also that the elements of the correlation matrix depend only on pairwise differences of shifts, i.e., relative shifts. It is therefore insensitive to zero-point shifts which are common to all the observed spectra. In that respect, the shifts derived by TIRAVEL are only relative shifts, with effective degrees of freedom instead of .
After optimizing over , which can be done by any optimization procedure (e.g., Press et al. 1992), we obtained the final velocities by fitting parabolas to the peak, similarly to the common practice in regular cross-correlation.
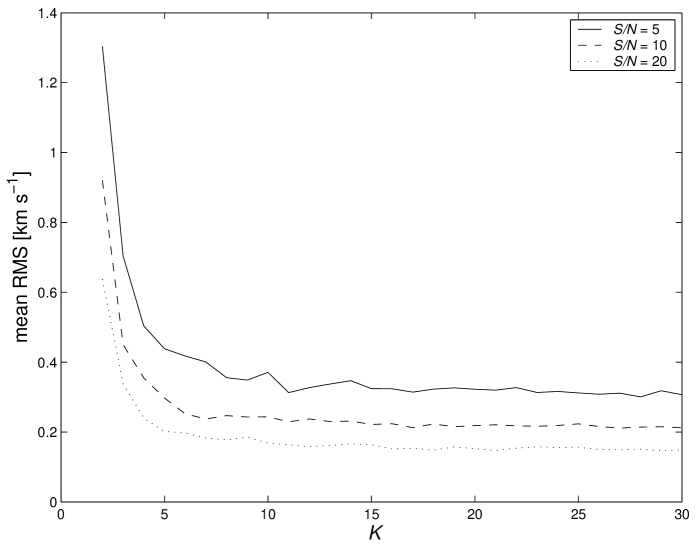
Since the new procedure yields also an effective ’template’, produced by summing all the individual exposures at the right shifts with optimal weights, we expect the quality of this effective template to improve as the number of observed spectra increases. Better template should yield more accurate individual velocities. We therefore expect the precision of the TIRAVEL velocities to improve as a function of the number of spectra. To test this we ran TIRAVEL on different sets of simulated spectra and checked the resulting velocities. We generated spectra by using a synthetic spectrum of a G star to which we added normal noise at a specified . No shift was implemented in producing the spectra, and therefore the scatter of the velocities derived by TIRAVEL can serve as a measure of the precision of the approach. We repeated the procedure times for each and .
Figure 1 displays the results of these simulations. The plot shows the mean RMS of the velocities obtained by TIRAVEL as a function of the number of spectra analysed, for three different -ratios. As expected, the RMS converges to a constant value, when the ’effective template’ becomes similar to the true template. It seems that the convergence rate is not very sensitive to the , and that when – spectra are available, the ultimate performance is already achieved (assuming they all share about the same ). This behaviour is easily understood, since once the template is significantly less noisier than the individual spectra, the main factor which determines the velocity precision is the of the observed spectrum. This happens already when a moderate number of spectra are co-added to produce the template.
The simulations also indicate the computational burden of TIRAVEL. Using a very naïve optimization scheme, on average about iterations were needed to reach the stopping criterion of less than RMS change in the velocities, for . We wrote our code in MATLAB and ran it on a Pentium Pro Linux machine, where those iterations, including the pre-calculation step, lasted about seconds.
3 Real Test Cases
We chose to demonstrate the potential of the new approach on three single-lined spectroscopic binaries (SB1s) which were already solved and published (Latham et al. 2002) as part of a survey of high-proper-motion SB1s. The radial velocities in Latham et al. (2002) were derived from spectra obtained using the CfA Digital Speedometers (Latham 1985, 1992). In order to obtain the radial velocities Latham et al. used an extensive grid of spectra computed using the model atmospheres of the ATLAS9 code, developed by Kurucz .
The spectra we used for the TIRAVEL analysis were the same observed spectra that Latham et al. used for their analysis. Using the velocities produced by TIRAVEL we have recalculated a least-square best-fitting orbital solution. The RMS of the residuals of the new orbit serves as a criterion to compare with the previously published orbit. Furthermore, the effective template derived by TIRAVEL indicates the amount of spectral information that can be extracted from the spectra without using a template.
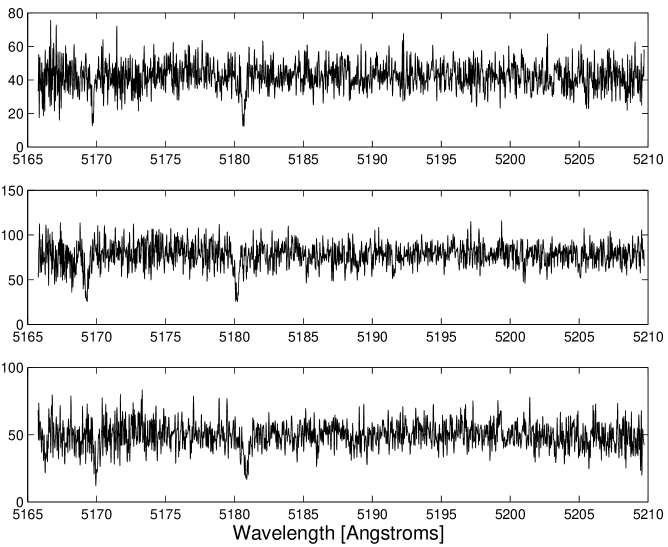
3.1 G72–59
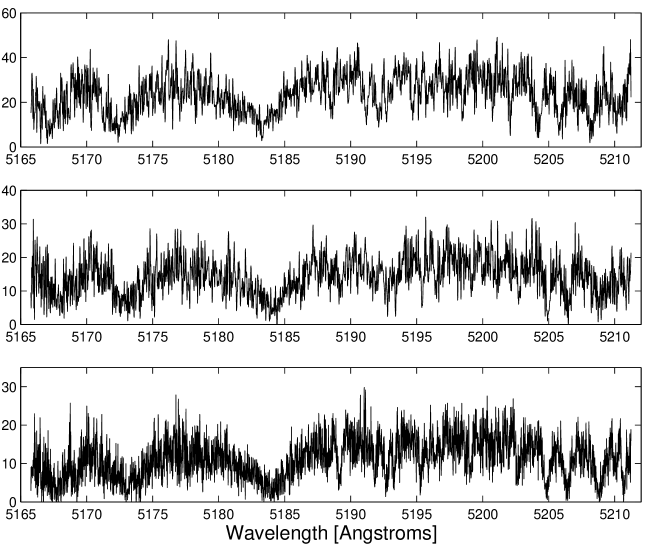
Latham et al. (2002) solved G72–59 with 32 spectra and derived a period of about days with a small eccentricity. Figure 2 shows three of the 32 spectra, to demonstrate their S/N. Table 1 lists both the orbital elements that appear in Latham et al. (2002) and the orbital elements obtained from the TIRAVEL velocities. Note that the TIRAVEL analysis reveals no information about absolute radial velocities, and the value of the center-of-mass velocity obtained in analysing TIRAVEL velocities is not very informative. Nevertheless we list it for completeness.
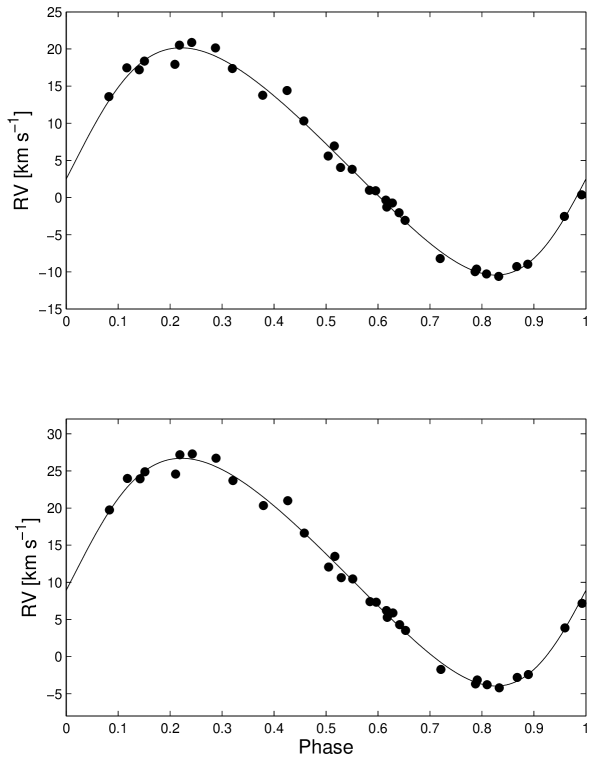
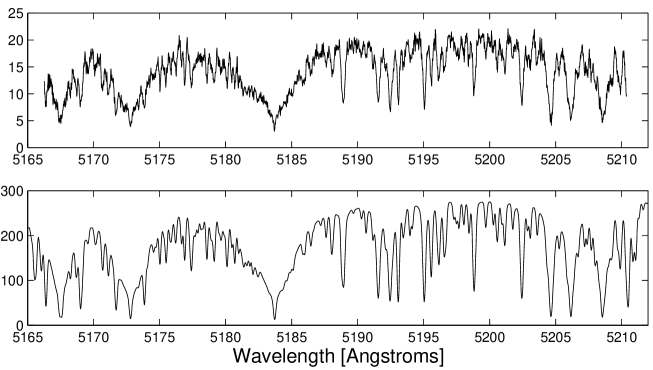
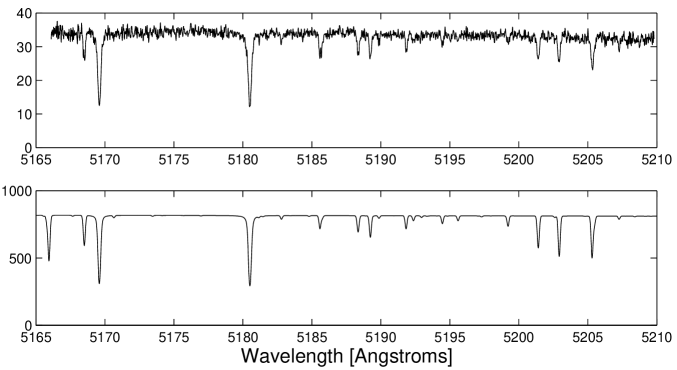
Table 1 shows that the two solutions are consistent. The residual RMS of the TIRAVEL solution is somewhat larger than the old one, and so are the errors of the elements. This is one of the cases where the TIRAVEL solution is a little worse than Latham et al. (2002) solution. The two orbital solutions can be visually compared in Figure 3. Indeed, the differences between the two orbits are completely negligible. Figure 4 presents the new effective template that is built by TIRAVEL, together with the synthetic template used in the original analysis.
The synthetic template shown in Figure 4 was shifted according to the difference between the two derived center-of-mass velocities, in order to match the derived TIRAVEL template. The similarity is striking, although the synthetic template evidently has a much higher than the derived one. It is somewhat surprising and gratifying that the TIRAVEL results are almost as good as the results of the calculated spectrum, despite the fact that the effective spectrum of TIRAVEL looks so much noisier.
| Parameter | Latham et al. 2002 | TIRAVEL | |||
| [days] | |||||
| [JD] | |||||
| [] | |||||
| [km s-1] | |||||
| [km s-1] | |||||
| [km s-1] | 0.96 | ||||
3.2 G178–27
According to Latham et al. (2002), G178–27 has a low amplitude orbit ( km s-1), with an eccentricity of about . Its period is about days, and the orbital solution was obtained using exposures. Latham et al. derived very low metallicity for G178–27, of . Figure 5 presents three sample spectra of G178–27. One can see the relative scarcity of the spectral information compared with G72–59, due to the very low metallicity.
The two orbital solutions are listed in Table 2, and shown on Figure 6. Once again, the new solution is very similar and consistent with the previous one, while its residuals are slightly smaller. The good choice of synthetic template by Latham et al. is clearly seen once the TIRAVEL effective template is derived, as shown in Figure 7.
| Parameter | Latham et al. 2002 | TIRAVEL | |||
| [days] | |||||
| [JD] | |||||
| [] | |||||
| [km s-1] | |||||
| [km s-1] | |||||
| [km s-1] | 0.56 | ||||
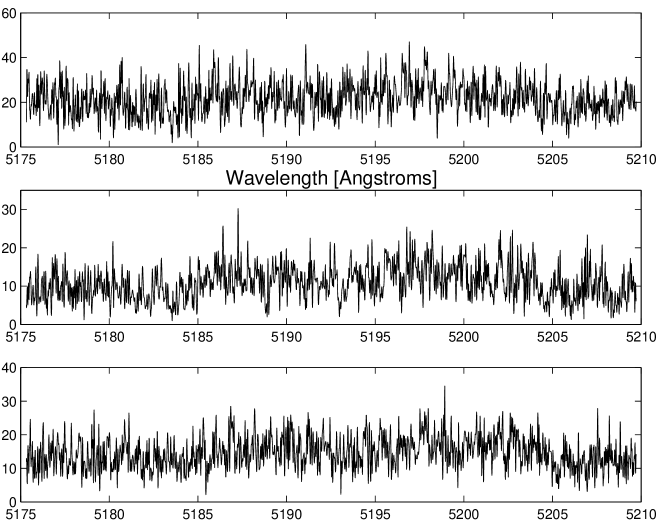
3.3 G48–54
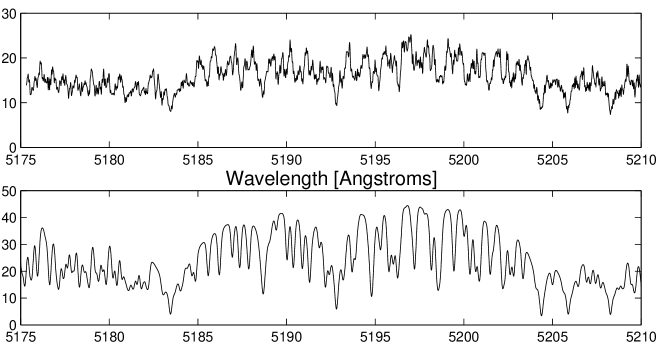
The star G48–54 is the best case considered here to demonstrate the potential of TIRAVEL. The previous solution by Latham et al. has a period of days and an eccentricity of , obtained with exposures. The star G48–54 is the star with the latest spectral type presented in Latham et al. (2002), with an estimated temperature of . Figure 8 presents three sample spectra of G48–54.
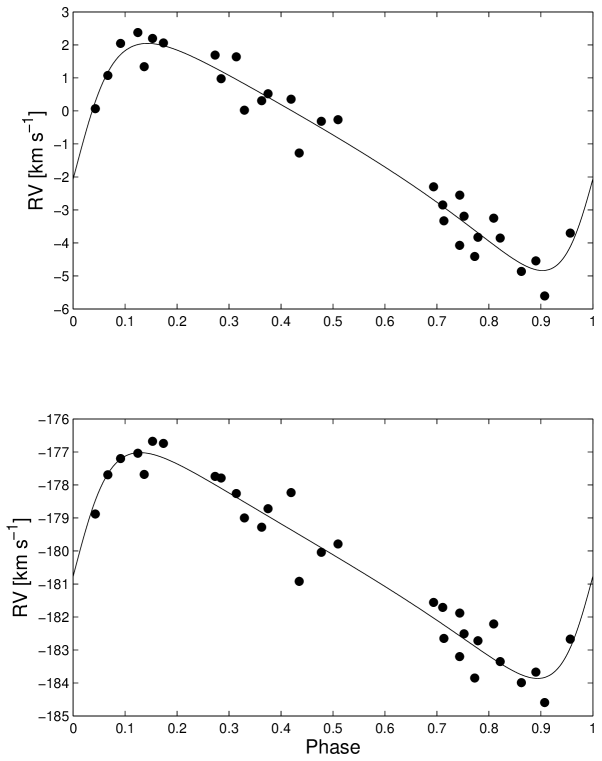
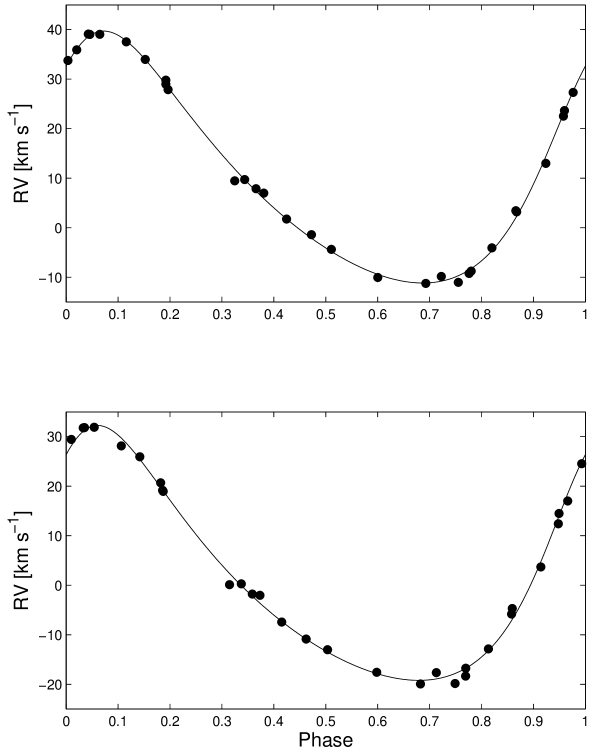
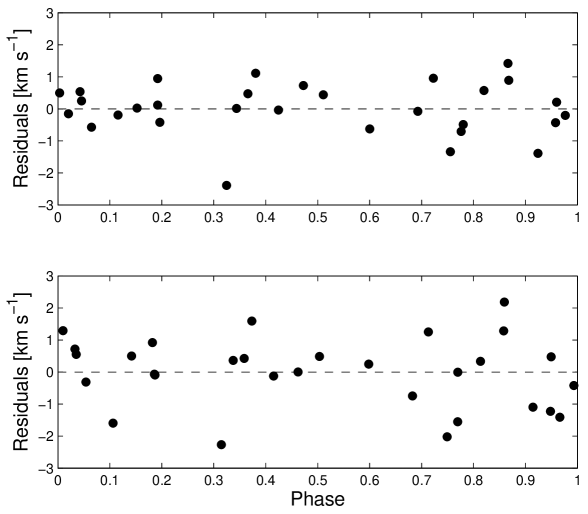
As can be seen in Table 3, the TIRAVEL solution is better than the old published solution. Because of the large RV amplitude, the differences between the two solutions can hardly be seen in the phase-folded RV curve (Figure 9). We therefore present in Figure 10 the residuals after subtracting the orbital solution in the two cases, on the same scale. The improvement is easily seen. Figure 11 suggests the reason for the improvement. The spectrum of this late-type star is more complex than most of the other stars in the sample, because of its lower temperature. We suggest that the spectral modeling of this star is not complete, probably due to the notorious difficulties associated with modeling later-type stars.
Close examination of Figures 9 and 10 suggests that a single measurement, at a phase of about , may be ’pulled’ by the secondary spectrum, at a phase where the primary and secondary velocities are very close. This outlying velocity stands out even better in the TIRAVEL velocities, because of the smaller RMS. Maybe a somewhat better procedure would exclude this point from the analysis.
| Parameter | Latham et al. 2002 | TIRAVEL | |||
| [days] | |||||
| [JD] | |||||
| [] | |||||
| [km s-1] | |||||
| [km s-1] | |||||
| [km s-1] | 0.89 | ||||
4 Discussion
We have presented here a new technique to analyse the spectra of SB1 systems. TIRAVEL is independent of any assumption about the primary spectrum, which is not included in the actual observed data. Instead, TIRAVEL makes use of the observed spectra to derive the radial velocities of the primary. This approach assumes that there is only one component in the observed spectra and that they are free of atmospherical or mechanical systematic features. Such features might reduce the efficiency of the technique, in particular compared to the use of theoretically calculated templates.
We have applied TIRAVEL to three SB1 cases, where a satisfactory solution had already obtained with theoretically calculated templates. TIRAVEL improved significantly the quality of one of the three solutions, in terms of the precision of the orbital elements and the RMS residuals. Obviously, the advantages of TIRAVEL will be most pronounced when there is no good theoretically calculated template available. In the presented cases, the template grid that Latham et al. (2002) used was very extensive, and we could not expect to obtain very large improvements, except at the low-temperature frontier of the grid. One immediate implication of TIRAVEL is the analysis of the spectra of cataclysmic variables or some T Tauri stars, where the high-temperature accretion disc has an emission spectrum which in not easy to model.
The version of TIRAVEL we presented here is specifically tailored for SB1s, where there is only one RV to be measured in each exposure, resulting in a simple shift of the spectrum. In the case of double-lined spectroscopic binaries (SB2), a more elaborate scheme is needed, one that has to separate the effects of the orbit on the two component spectra. Such a scheme may make use of ideas related to Doppler tomography (Bagnuolo et al. 1992) or two-dimensional correlation (TODCOR;Zucker & Mazeh (1994)). One possible generalization of TIRAVEL may simply apply it iteratively - first solving for the primary component, subtracting the resulting template from the spectra, then applying TIRAVEL to the subtracted spectra again to retrieve the information related to the secondary component, and repeat the process iteratively. Similar procedures were applied by Marchenko et al. (1998) and González & Levato (2006).
Note that spectral disentangling codes, like KOREL (Hadrava 1995, 1997) can be applied also to SB1s (e.g., Saad et al. 2005). However, they usually impose an orbital model, treating any deviation from the model as noise. TIRAVEL does not incorporate any orbital model (or any other source of RV variation), and produces the best relative RV estimates one can get without a template. Therefore, the TIRAVEL approach enables us to detect any additional source for RV variation, a third companion in particular.
In order to be applicable to spectra obtained by the modern echelle spectrographs and other multi-order spectra, TIRAVEL has to be generalized, probably along lines similar to the ones that were used to generalize TODCOR to multi-order spectra (Zucker 2003). This modification was crucial in detecting the planet in HD 41004 (Zucker et al. 2003, 2004).
In principle, improvements in RV precision, like the one offered by TIRAVEL, may lead to the detection of small finite eccentricities or additional stellar components. One area where the precision of radial velocities and orbital solution is of utmost importance is the search for extrasolar planets, where the orbital RV amplitude is usually extremely small, of the order of tens of meters per second. Effective improvements in the precision of radial velocities may lead to an improved planet-detection capability. In general, the improved precision also means a better utilization of the instrumental potential and thus a more efficient observing time usage.
Acknowledgments
We are deeply indebted to Dave Latham for his most useful assistance in accessing and analysing the CfA spectra.
References
- Bagnuolo et al. (1992) Bagnuolo W. G., Gies D. R., Wiggs M. S., 1992, ApJ, 385, 708
- Bouchy et al. (2001) Bouchy F., Pepe F., Queloz D., 2001, A&A, 374, 733
- Connes (1985) Connes P., 1985, AP&SS, 110, 211
- González & Levato (2006) González J. F., Levato H., 2006, A&A, 448, 283
- Hadrava (1995) Hadrava P., 1995, A&AS, 114, 393
- Hadrava (1997) Hadrava P., 1997, A&AS, 122, 581
- Howarth et al. (1997) Howarth I. D., Siebert K. W., Hussain G. A. J., Prinja R. K., 1997, MNRAS, 284, 265
- Latham (1985) Latham D. W., 1985, in Philip A. G. D., Latham D. W., eds, IAU Colloq. 88: Stellar Radial Velocities Digital Stellar Speedometry. p. 5
- Latham (1992) Latham D. W., 1992, in McAlister H. A., Hartkopf W. I., eds, ASP Conf. Ser. 32: IAU Colloq. 135: Complementary Approaches to Double and Multiple Star Research Surveys of Spectroscopic Binaries at the Center for Astrophysics. p. 110
- Latham et al. (2002) Latham D. W., Stefanik R. P., Torres G., Davis R. J., Mazeh T., Carney B. W., Laird J. B., Morse J. A., 2002, AJ, 124, 1144
- Marchenko et al. (1998) Marchenko S. V., Moffat A. F. J., Eenens P. R. J., 1998, PASP, 110, 1416
- Mayor & Queloz (1995) Mayor M., Queloz D., 1995, Nature, 378, 355
- Murdoch & Hearnshaw (1991) Murdoch K., Hearnshaw J. B., 1991, Ap&SS, 186, 137
- Murtagh & Heck (1987) Murtagh F., Heck A., 1987, Multivariate data analysis. Astrophysics and Space Science Library, Dordrecht: Reidel, 1987
- Press et al. (1992) Press W. H., Teukolsky S. A., Vetterling W. T., Flannery B. P., 1992, Numerical recipes in C. The art of scientific computing, 2nd edn.. Cambridge: University Press
- Saad et al. (2005) Saad S. M., Kubát J., Hadrava P., Harmanec P., Koubský P., Škoda P., Šlechta M., Korčáková D., Yang S., 2005, Ap&SS, 296, 173
- Simkin (1974) Simkin S. M., 1974, A&A, 31, 129
- Tonry & Davis (1979) Tonry J., Davis M., 1979, AJ, 84, 1511
- Zucker (2003) Zucker S., 2003, MNRAS, 342, 1291
- Zucker & Mazeh (1994) Zucker S., Mazeh T., 1994, ApJ, 420, 806
- Zucker et al. (2003) Zucker S., Mazeh T., Santos N. C., Udry S., Mayor M., 2003, A&A, 404, 775
- Zucker et al. (2004) Zucker S., Mazeh T., Santos N. C., Udry S., Mayor M., 2004, A&A, 426, 695