New age estimates of M31 globular clusters from multi-colour photometry
Abstract
The large majority of extragalactic star cluster studies performed to date essentially use multi-colour photometry, combined with theoretical stellar synthesis models, to derive ages, masses, extinction estimates, and metallicities. M31 offers a unique laboratory for studies of globular cluster (GC) systems. In this paper, we obtain new age estimates for 91 M31 globular clusters, based on improved photometric data, updated theoretical stellar synthesis models and sophisticated new fitting methods. In particular, we used photometric measurements from the Two Micron All Sky Survey (2MASS), which, in combination with optical photometry, can partially break the well-known age-metallicity degeneracy operating at ages in excess of a few Gyr. We show robustly that previous age determinations based on photometric data were affected significantly by this age-metallicity degeneracy. Except for one cluster, the ages of our other sample GCs are all older than 1 Gyr. Their age distribution shows populations of young and intermediate-age GCs, peaking at and 8 Gyr respectively, as well as the “usual” complement of well-known old GCs, i.e., GCs of similar age as the majority of the Galactic GCs. Our results also show that although there is significant scatter in metallicity at any age, there is a noticeable lack of young metal-poor and old metal-rich GCs, which might be indicative of an underlying age-metallicity relationship among the M31 GC population.
keywords:
galaxies: individual (M31) – galaxies: star clusters – globular clusters: general1 Introduction
M31 is the nearest large spiral galaxy, at a distance of about 780 pc (Stanek & Garnavich, 1998; Macri, 2001). It contains more than 337 confirmed globular clusters (GCs) and about 688 GC candidates (Galleti et al., 2004), i.e., significantly more than in our own Galaxy. Thus, M31 provides an excellent opportunity to study the properties of a large sample of GCs. From the observational evidence collected thus far (see, e.g., Rich et al., 2005), the M31 GCs and their Galactic counterparts reveal some striking similarities (Fusi Pecci et al., 1994; Djorgovski et al., 1997; Barmby et al., 2002). For example, both GC systems seem to have similar mass-to-light ratios, structural parameters, and velocity dispersion – luminosity relations (see also de Grijs et al., 2005b). Studies of GCs in M31 can not only throw light on lots of questions about the formation, evolution and properties of M31 itself, including its mass, dynamics and chemical composition, they can also improve our understanding of the formation and structure of galaxies in general (Battistini et al., 1980). In addition, GCs can provide us with good samples of Population II stars characterised by homogeneous abundances and histories, and with unique stellar dynamical conditions for our study (Barmby & Huchra, 2001). Therefore, GCs are so important that they are considered as the fossils of the earliest stages of galaxy formation (Barmby et al., 2000). However, at the distance of M31, construction of colour-magnitude diagrams (CMDs) below the main sequence turn-off, the most reliable method for age determinations of stellar populations, is extremely challenging for current state-of-the-art instrumentation. Here, one suffers from the dual effects of crowding and the intrinsic faintness of the cluster stars (Rich et al., 1996, 2005; Stephens et al., 2001; Beasley et al., 2004), although we note that Brown et al. (2004) presented a CMD down to the turn-off for a Gyr-old M31 GC.
Since the pioneering work of Tinsley (1968, 1972) and Searle et al. (1973), evolutionary population synthesis modeling has become a powerful tool to interpret integrated spectrophotometric observations of galaxies as well as their components (see, e.g., Anders et al., 2004). Comprehensive compilations of relevant current model sets, such as e.g. developed by Bruzual & Charlot (1993, 1996, henceforth BC93, BC96), Leitherer & Heckman (1995), and Fioc & Rocca-Volmerange (1997), were provided by Leitherer et al. (1996) and Kennicutt (1998). The evolution of star clusters is usually modeled based on the “simple stellar population” (SSP) approximation111An SSP is defined as a single generation of coeval stars formed from the same progenitor molecular cloud (thus implying a single metallicity), and governed by a given initial mass function (IMF)., which is a highly robust approximation for old GCs in particular (e.g. Barmby & Huchra, 2000).
Ma et al. (2001, 2002a, 2002b, 2002c) and Jiang et al. (2003) estimated the ages of, respectively, 180 star clusters in M33 and 172 GC candidates in M31 by comparing the SSP synthesis models of BC96 with the clusters’ integrated photometric measurements in the Beijing-Arizona-Taiwan-Connecticut (BATC) photometric system. Ma et al. (2006a) also determined the ages and metallicities of 33 M31 GCs and candidates using the updated method and updated SSP synthesis models of Bruzual & Charlot (2003, henceforth BC03), and Ma et al. (2006b) estimated the age and reddening value of the M31 GC 037-B327 based on photometric measurements in a large number of broad-band passbands from the optical to the near-infrared.
From an observational point of view, the study of M31 GCs is complicated, since in most cases we only have access to their integrated spectra and photometry, and cannot study the resolved stellar population. Therefore, we can only obtain the key physical parameters, such as the age and metallicity, by analysis of the integrated spectra or photometry. However, a large body of evidence suggests that there is a strong age-metallicity degeneracy if only optical photometry is used (Arimoto, 1996; Worthey, 1994; Kaviraj et al., 2006). A very useful method to break this degeneracy is through the application of particular spectral diagnostics based on the occurrence of individual stellar absorption-line features (e.g., Faber, 1973; Rose, 1984, 1985; Díaz, Terlevich & Terlevich, 1989; Worthey et al., 1994; Jones & Worthey, 1995; Vazdekis & Arimoto, 1999; Bruzual & Charlot, 2003).
At the same time, observational GC spectral energy distributions (SEDs) are affected by reddening, an effect that is also difficult to separate from the combined effects of age and metallicity (Calzetti, 1997; Vazdekis et al., 1997; Origlia et al., 1999). However, if the metallicity and reddening are derived accurately (and, ideally, independently), these degeneracies are largely (if not entirely) reduced, and ages can then also be estimated accurately based on a comparison of multi-colour photometry spanning a significant wavelength range (de Grijs et al., 2003b; Anders et al., 2004) with theoretical stellar population synthesis models.
In this paper, we present new age estimates for 91 GCs of the Jiang et al. (2003) sample, based on their 13 intermediate-band photometry in the BATC system, combined with additional broad-band optical and 2MASS near-infrared photometry, and on the updated SSP synthesis models of BC03. Section 2 describes the intermediate-band, broad-band and 2MASS photometry of our GC sample. In Section 3, we describe the metallicity and reddening data of the sample GCs; Section 4 includes a description of the SSP models used, and of our method to estimate the ages of the sample GCs. The main results and a discussion are also presented in this section. We summarise and conclude the paper in Section 5.
2 Intermediate-band, Broad-band and 2MASS Photometry of our GC Sample
2.1 Selection of the GC Sample
The GC sample used in this paper was selected from that of Jiang et al. (2003), who published their intermediate-band photometry in 13 passbands taken from the BATC Multi-colour Survey of the Sky. They estimated the ages using BC96 for 172 M31 GCs, selected from the Bologna catalogue (Battistini et al., 1987). This catalogue, which includes a total of 827 GC candidates, is the most comprehensive list of M31 GCs. Of these objects, 353 are considered class A (254) and class B (99) objects, i.e., probable GCs (or candidates) to a very high and high level of confidence, respectively; 152 sources are listed as class C, and the others fall into the lower-confidence classes D and E. Jiang et al. (2003) took all candidates in classes A and B as their original GC sample. However, only 223 objects overlapped in position with the BATC CCD field222The BATC field of view covers most of the visible disc of M31; the consequence of the limited field of view for the present paper is that we may have missed a number of GCs in the extreme outer disc regions along the galaxy’s major axis, and that the fraction of outer halo GCs is underrepresented (see aslo Fig. 1).. Four of these are most likely stars rather than GCs (Barmby et al., 2000). An additional 47 GCs were saturated in some of the BATC filters, and were therefore not included in the final Jiang et al. sample. As a consequence, there are 172 GCs in their final sample (see details from Jiang et al., 2003). For the purpose of estimating accurate GC ages, we selected GCs from the Jiang et al. (2003) sample for which the metallicity and reddening values had been estimated accurately and homogeneously in previous studies. Barmby et al. (2000) and Perrett et al. (2002) derived metallicities of, respectively 61 and more than 200 GCs and GC candidates in M31. Barmby et al. (2000, P. Barmby, priv. comm.) determined the reddening values for 223 GC candidates. Based on cross-identification of the Jiang et al. (2003) sample and that of Barmby et al. (2000) and Perrett et al. (2002), we selected 93 objects as our initial M31 GC cluster sample. We refer the reader to Section 3 for more technical details. When we compared the multi-colour photometry of our sample GCs with theoretical stellar synthesis models, we could not obtain a reasonable fit to the SED of one GC, Bo131. A detailed investigation of the M31 images of BATC Multi-colour Survey of the Sky reveals that this GC is superimposed onto a very high and variable background, so that the resulting photometry is highly uncertain. Therefore, we discarded this object from our final sample. In addition, 037-B327 has been studied in detail by Ma et al. (2006b), and is therefore also excluded from the present sample. Our final sample in this paper thus contains 91 GCs.

Since Jiang et al. (2003)’s GC sample selection was only limited by the size of their field of view, their GC sample constitutes a random selection of M31 GCs, provided that there are no significant positional biases present in the M31 GC sample as a whole between the disc and the outer halo. In order to illustrate this limitation, Fig. 1 shows the map of all known bona fide M31 GCs from Galleti et al. (2004) and the subsample of GCs discussed in this paper. It is clear that our sample GCs are indeed limited to the central region of M31, as determined solely by the BATC observational field of view, and without further selection criteria imposed that might jeopardise the random nature of our sample selection. However, we point out that our sample may be affected by an underrepresentation of young ( Gyr-old) blue luminous compact clusters (BLCCs). Fusi Pecci et al. (2005) found that such BLCCs seem to avoid the inner regions of the M31 disc, and appear to be clearly projected onto the spiral-arm structure in the outer disc (predominantly along the major-axis direction; see their Fig. 5), with which they also share kinematic properties (see also Puzia et al., 2005). In addition, there is evidence for a roughly 25 to 50 per cent solar-metallicity ([Fe/H] to dex) population of older GCs in the M31 halo (e.g. Puzia et al., 2005, and references therein), while the more metal-poor clusters appear to be scattered throughout the entire disc-halo system (e.g. Barmby et al., 2000; Perrett et al., 2002; Puzia et al., 2005).

Fig. 2 compares the colour distributions of the Galleti et al. (2004) M31 GCs with that of our subsample. In order to show any differences as clearly as possible, we use the normalised number of GCs in each sample. Fig. 2 shows that the colour distribution of our subsample of M31 GCs is similar to that of the full Galleti et al. (2004) sample. If anything, the disc GCs, by which our subsample is dominated, may be somewhat redder than the mean of the entire M31 GC sample. This is not surprising in view of the possible selection biases discussed above, while the main galactic disc of M31 may also give rise to redder GC colours owing to the presence of fairly significant dust lanes (particularly closer to the galactic centre).
In Section 4.4, we will further consider to which extent our GC sample represents that of Jiang et al. (2003). We also note that although most present catalogues of M31 GCs are not complete, Fusi Pecci et al. (1993) have shown that the M31 GC population (including the sample in the Bologna catalogue on which the present sample is based) is currently fairly complete down to mag ( mag). As such, we believe that we have not introduced additional photometric biases into our sample selection by using the Bologna catalogue as our master list of M31 GCs.
2.2 Intermediate-band Photometry of Our Sample GCs
The large-field multi-colour observations of M31 were obtained in the BATC photometric system, obtained with the cm f/3 Schmidt telescope at the Xinglong Station of the National Astronomical Observatories of China. A Ford Aerospace 20482048 CCD camera, with a 15 m pixel size is mounted at the Schmidt focus. This set-up provides a CCD field of view of , with a pixel size of . The filters were designed specifically to avoid contamination from the brightest and most variable night sky emission lines. Jiang et al. (2003) extracted 123 images of M31 from the BATC survey archive, taken in 13 BATC filters at wavelengths from 4,000 to 10,000Å between 1995 September and 1999 December. They combined multiple images through the same filter to improve the image quality, and determined the magnitudes of 172 GCs in the 13 BATC filters based on the combined images using standard aperture photometry, i.e., in essence by employing the PHOT routine in daophot (Stetson, 1987). The BATC photometric system calibrates the zero-magnitude level in a similar fashion to the spectrophotometric AB magnitude system. For flux calibration, the Oke-Gunn primary flux standard stars HD 19445, HD 84937, BD +26∘2606, and BD +17∘4708 (Oke & Gunn, 1983) were observed on photometric nights (Yan et al., 2000). Table 2 of Jiang et al. (2003) lists the resulting BATC photometry of their 172 GCs, including the 91 GCs in this paper.
2.3 Broad-band Photometry of Our Sample GCs
In order to estimate the ages of our sample GCs accurately, we try to use as many photometric data points covering as large a wavelength range as possible (cf. de Grijs et al., 2003b; Anders et al., 2004). Using the 4-Shooter CCD mosaic camera and the SAO infrared imager on the 1.2m telescope at the Fred Lawrence Whipple Observatory, Barmby et al. (2000) presented optical and infrared photometric data for 285 M31 GCs (see Table 3 of Barmby et al., 2000). For most of our sample GCs, photometric measurements in the bands were published by Barmby et al. (2000). For the remaining GCs, we refer to Galleti et al. (2004), who updated the Bologna Catalogue with the homogenised optical () photometry collected from the most recent photometric references available in the literature. In this revised Bologna Catalogue of M31 globular clusters, Galleti et al. (2004) did not include the photometric uncertainties. Therefore, we refer to the original works as indicated in Galleti et al. (2004). For a number of GCs, for which -band photometric uncertainties were not presented in the original references, a photometric uncertainty of 0.08 mag was adopted (see Galleti et al., 2004). Galleti et al. (2004) took the photometry in the bands from Barmby et al. (2000) as a reference to obtain a Master Catalogue of photometric measurements compiled in as homogeneously a fashion as possible. All other catalogues containing photometry were transformed to this reference by applying the offsets derived from objects in common between the relevant catalogue and the list of Barmby et al. (2000). Therefore, the measurements are internally consistent.
2.4 2MASS Photometry of Our Sample GCs
As pointed out by Worthey (1994), the age-metallicity degeneracy in optical broad-band colours is . This implies that the composite spectrum of an old stellar population is indistinguishable from that of a younger but more metal-rich population (and vice versa) (see also MacArthur et al., 2004). de Jong (1996) and Anders et al. (2004) showed that this degeneracy can be partially broken by adding infrared photometry to the optical colours, depending on the age of the stellar population. Cardiel et al. (2003) found that the inclusion of an infrared band can improve the predictive power of the stellar population diagnostics by times compared to using optical photometry alone. Wu et al. (2005) also showed that the use of near-infrared colours can greatly contribute to break the age-metallicity degeneracy. In this paper we add 2MASS photometry to our broad and intermediate-band optical photometry to estimate the GC ages to the highest possible accuracy.
Using the 2MASS database, Galleti et al. (2004) identified 693 known and candidate GCs in M31, and listed their 2MASS s magnitudes. Galleti et al. (2004) transformed all 2MASS magnitudes to the CIT photometric system (Elias et al., 1982, 1983) using the colour transformations in Carpenter (2001). However, we need the original 2MASS s magnitudes for our sample GCs in order to compare our observational SED to the SSP models, so we reversed this transformation using the same procedures. Since Galleti et al. (2004) did not give the photometric 2MASS s uncertainties, we obtained photometric uncertainties by comparing the photometric magnitudes with Fig. 2 of Carpenter et al. (2001), who plot the observed photometric rms uncertainties in the time series as a function of magnitude for stars brighter than their observational completeness limits. In fact, the photometric uncertainties adopted do not affect our results significantly, as we will show below (see section 4.3 for details).
Finally, we point out that because of the very long wavelength coverage from to the near-infrared, and the large number of photometric data points for each GC, our age estimates, and in particular the associated uncertainties are highly robust. In fact, depending on the (internal) extinction curve adopted, they are competitive with respect to spectroscopic age determinations based on either a short wavelength range or a limited number of age diagnostics (where small-scale differences in the continuum level may have significant consequences for the age determinations), as discussed extensively in de Grijs et al. (2003b) and de Grijs et al. (2005a). Schweizer et al. (2004) provide convincing support for this statement by showing that spectroscopic age determinations are not necessarily better or more accurate than ages obtained from photometry.
3 Metallicities and Reddening
To estimate the ages of our sample GCs accurately, we required that our GC sample have both independently determined spectroscopic metallicities, and reddening values. We used two homogeneous reference sources of spectroscopic metallicities, Barmby et al. (2000) and Perrett et al. (2002).
Barmby et al. (2000) present metallicities of 61 GC candidates, using the Keck LRIS and the MMT Blue Channel spectrographs. With the Keck LRIS, they used a 600 mm-1 grating with a 1.2 Å pixel-1 dispersion from 3670–6200 Å, and a resolution of 4-5 Å. With the MMT Blue Channel, they used a 300 mm-1 grating with a 3.2 Å pixel-1 dispersion from 3400–7200 Å, and a resolution of 9-11 Å. Barmby et al. (2000) computed the absorption-line indices following Brodie & Huchra (1990); subsequently, they used the Brodie & Huchra (1990) spectral index – metallicity calibration. Brodie & Huchra (1990)’s metallicity calibration is based on six absorption-line indices measured from integrated cluster spectra, which provides an [Fe/H] estimate accurate to about 15 per cent.
Perrett et al. (2002) list metallicities for more than 200 GCs in M31 using the Wide Field Fibre Optic Spectrograph at the 4.2 m William Herschel Telescope, which provides a total spectral coverage of 3700–5600 Å with two gratings. One grating (H2400B, 2400 mm-1) yields a dispersion of 0.8 Å pixel-1 and a spectral resolution of 2.5 Å over the range 3700–4500 Å, and the other grating (R1200R, 1200 mm-1) is characterised by a dispersion of 1.5 Å pixel-1 and a spectral resolution of 5.1 Å over the range 4400–5600 Å. Perrett et al. (2002) then calculated 12 absorption-line indices following Brodie & Huchra (1990). By comparison of the line indices with published M31 GC [Fe/H] values from previous studies (Bònoli et al., 1987; Brodie & Huchra, 1990; Barmby et al., 2000), they applied a linear least-squares minimisation. Final cluster metallicities were determined from an unweighted mean of the [Fe/H] values calculated from the CH (G band), Mg, and Fe53 line strengths.
We draw the reader’s attention to the fact that the M31 GC metallicities thus obtained were based on the [Fe/H] calibration of Brodie & Huchra (1990), who included only old GCs in their calibration sample. Since in this paper we estimate the ages of our M31 GC sample, and find that some of them are young or of intermediate age, our age determination may be somewhat biased. However, we point out that (i) the main features in the M31 GC age distribution that we will derive in Section(s) 4.5 (and 4.6) are similar to those derived by authors who do not rely on the Brodie & Huchra (1990) metallicity calibration (e.g. Beasley et al., 2005) – on a one-to-one basis, the ages of most of the GCs we have in common with these authors do not differ by more than , and (ii) we do not have the spectroscopic data required to quantify this effect in detail; instead, we refer to Beasley et al. (2005) for an in-depth discussion on this issue.
For the reddening values of the sample GCs we refer to Barmby et al. (2000), who determined the reddening for each individual cluster using correlations between optical and infrared colours and metallicity and by defining various “reddening-free” parameters using their large database of multi-colour photometry. Barmby et al. (2000) found that the M31 and Galactic GC extinction laws, and the M31 and Galactic GC colour-metallicity relations are similar to each other. They then estimated the reddening to M31 objects with spectroscopic data using the relation between intrinsic optical colours and metallicity for Galactic clusters. For objects without spectroscopic data, they used the relationships between the reddening-free parameters and certain intrinsic colours based on the Galactic GC data. Barmby et al. (2000) compared their results with those in the literature and confirmed that their estimated reddening values are reasonable, and quantitatively consistent with previous determinations for GCs across the entire M31 disc. In particular, Barmby et al. (2000) showed that the distribution of reddening values as a function of position appears reasonable in that the objects with the smallest reddening are spread across the disk and halo, while the objects with the largest reddening are concentrated in the galactic disk. Therefore, we adopted the reddening values from Barmby et al. (2000, also P. Barmby, priv. comm.) for our GC sample.
4 Age determinations of the sample GCs
4.1 Stellar Populations and Synthetic Photometry
In evolutionary synthesis models, SSPs are modeled by a collection of evolutionary tracks of stars with different initial masses and chemical compositions, and a set of stellar spectra at different evolutionary stages. To estimate the ages of our sample GCs we compare their SEDs with the updated SSP models of BC03. BC03 provide the evolution of the spectra and photometric properties of SSPs for a wide range of stellar metallicities. The model set includes 26 SSP models (both of high and low resolution) based on the 1994 Padova evolutionary tracks, 13 of which were computed using the Chabrier (2003) IMF assuming lower and upper mass cut-offs of M⊙ and M⊙, respectively, while the other 13 were computed using the Salpeter (1955) IMF with the same mass cut-offs. In addition, BC03 provide 26 SSP models using the 2000 Padova evolutionary tracks. However, as they point out, the 2000 Padova models tend to produce worse agreement with observed galaxy colours. These SSP models contain 221 spectra describing the spectral evolution of SSPs from yr to 20 Gyr. The evolving spectra include the contribution of the stellar component at wavelengths from 91Å to m. In this paper, we adopt the high-resolution SSP models computed using the 1994 Padova evolutionary tracks and a Salpeter (1955) IMF333We note that because of the slow SED evolution of SSPs at ages in excess of a few Gyr, all of the most commonly used spectral synthesis models agree very well at these ages. Therefore, the choice of IMF is only important for estimating the photometric mass of the cluster, and does not affect the determination of the ages of old GCs.. We note that although the current best estimate of the age of the Universe is of order 13.7 Gyr, the SSP models and the stellar evolutionary tracks that form their basis have been calculated for ages up to 20 Gyr. It is not straightforward to correct for this discrepancy; one would need to recalculate all stellar evolutionary tracks for all metallicities. This situation is exacerbated by the fact that (i) young open clusters, up to Gyr, have been used to properly and robustly constrain the stellar evolution at younger ages, and (ii) at older ages the observational diagnostics are less sensitive to changes in age, resulting in significantly greater uncertainties at those ages. These are therefore issues that one needs to keep in mind in the context of physical parameters derived for the older GCs.
Since our observational data are integrated luminosities through our set of filters, we convolved the BC03 SSP SEDs with the BATC intermediate-band, broad-band and 2MASS filter response curves to obtain synthetic optical and near-infrared photometry for comparison. The synthetic filter magnitude can be computed as
| (1) |
where is the theoretical SED and the response curve of the filter of the BATC, and 2MASS photometric systems. Here, varies with age and metallicity.
4.2 Fit Results
We use a minimisation test to examine which BC03 SSP models are most compatible with the observed SED, following
| (2) |
where is the integrated magnitude in the filter of a theoretical SSP at age , presents the observed integrated magnitude in the same filter, and
| (3) |
Here, is the observational uncertainty, and is the uncertainty associated with the model itself, for the filter. Charlot et al. (1996) estimated the uncertainty associated with the term by comparing the colours obtained from different stellar evolutionary tracks and spectral libraries. Following Wu et al. (2005) and Ma et al. (2006b), we adopt .
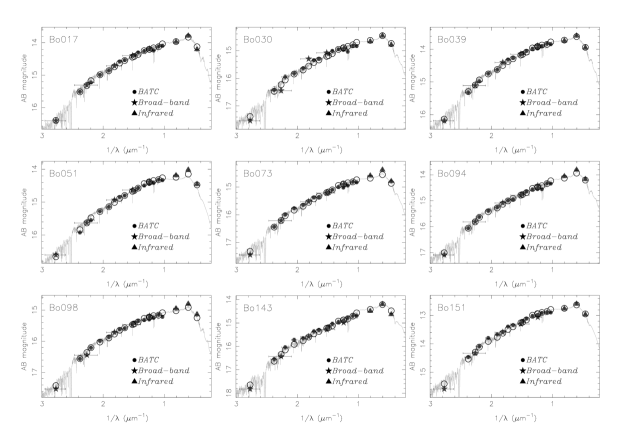
The BC03 SSP models include six initial metallicities, 0.0001, 0.0004, 0.004, 0.008, 0.02 (= solar), and 0.05. Spectra for other metallicities can be obtained by linear interpolation of the appropriate spectra for any of these metallicities. For our sample GCs, whose metallicity and reddening values were published by other authors, the cluster age is the sole parameter to be estimated (for a given IMF and extinction law, which we assume to be universal among our GC sample and for the main calibrators). The values for the extinction coefficient, , are obtained by interpolating the interstellar extinction curve of Cardelli et al. (1989). In Fig. 3 we show the observational SEDs of a representative, randomly selected subsample of M31 GCs, and the SEDs of the best-fitting models. The fit results for our entire sample are listed in Tables 1 and 2.
| ID | Age | Metallicity | |
|---|---|---|---|
| (Gyr) | [Fe/H] | (per degree of freedom) | |
| Bo009 | 16.754.90 | -1.570.26 | 2.87 |
| Bo015 | 1.430.04 | -0.350.96 | 1.86 |
| Bo017 | 2.300.07 | -0.420.45 | 0.59 |
| Bo023 | 20.004.94 | -0.920.10 | 2.69 |
| Bo025 | 8.252.08 | -1.460.13 | 1.62 |
| Bo027 | 17.502.95 | -1.640.32 | 3.80 |
| Bo029 | 14.254.25 | -0.320.14 | 5.51 |
| Bo030 | 5.251.30 | -0.390.36 | 3.81 |
| Bo031 | 2.600.92 | -1.220.40 | 4.56 |
| Bo034 | 20.004.69 | -1.010.22 | 3.46 |
| Bo036 | 20.004.34 | -0.990.25 | 2.13 |
| Bo038 | 6.000.82 | -1.660.44 | 0.43 |
| Bo039 | 4.750.47 | -0.700.32 | 0.61 |
| Bo041 | 19.505.03 | -1.220.23 | 0.76 |
| Bo042 | 2.600.14 | -0.780.31 | 2.11 |
| Bo044 | 8.252.26 | -1.140.37 | 1.51 |
| Bo051 | 11.252.51 | -1.000.13 | 1.14 |
| Bo054 | 1.280.03 | -0.450.17 | 3.00 |
| Bo056 | 3.500.78 | -0.060.10 | 3.54 |
| Bo057 | 6.751.95 | -2.120.32 | 1.23 |
| Bo059 | 20.001.01 | -1.360.52 | 1.83 |
| Bo061 | 7.250.87 | -0.730.28 | 1.73 |
| Bo063 | 9.752.58 | -0.870.33 | 1.43 |
| Bo064 | 18.002.47 | -1.550.30 | 1.85 |
| Bo068 | 1.800.04 | -0.290.59 | 1.33 |
| Bo073 | 7.250.87 | -0.640.46 | 1.78 |
| Bo076 | 1.680.10 | -0.720.06 | 1.78 |
| Bo082 | 6.000.87 | -0.800.18 | 3.35 |
| Bo086 | 15.252.72 | -1.740.17 | 1.25 |
| Bo088 | 7.750.84 | -1.810.06 | 0.60 |
| Bo093 | 20.005.44 | -1.030.12 | 1.64 |
| Bo094 | 3.250.30 | -0.170.45 | 1.34 |
| Bo096 | 9.001.65 | -0.260.43 | 1.81 |
| Bo097 | 2.300.23 | -1.210.13 | 1.19 |
| Bo098 | 3.000.11 | -0.670.58 | 1.41 |
| Bo102 | 1.800.24 | -1.570.10 | 2.05 |
| Bo103 | 7.751.15 | -0.560.62 | 1.17 |
| Bo105 | 10.251.82 | -1.130.32 | 0.56 |
| Bo106 | 20.007.11 | -0.860.68 | 2.18 |
| Bo107 | 5.251.84 | -1.180.30 | 2.25 |
| Bo110 | 8.002.43 | -1.060.12 | 2.00 |
| Bo116 | 7.500.76 | -0.880.12 | 0.67 |
| Bo125 | 4.000.71 | -1.520.08 | 1.62 |
| Bo127 | 9.753.03 | -0.800.14 | 3.88 |
| Bo130 | 6.501.74 | -1.280.19 | 1.71 |
| Bo134 | 5.502.28 | -0.640.08 | 5.47 |
| Bo135 | 20.002.10 | -1.620.04 | 1.18 |
| Bo137 | 5.501.08 | -1.210.29 | 1.39 |
| Bo143 | 4.750.76 | 0.090.42 | 1.99 |
| Bo148 | 7.502.34 | -1.150.34 | 3.07 |
| Bo149 | 4.251.11 | -1.350.25 | 3.38 |
| Bo151 | 12.502.61 | -0.750.18 | 2.05 |
| Bo152 | 17.504.76 | -0.870.49 | 2.12 |
| Bo153 | 8.000.83 | -0.080.33 | 1.10 |
| Bo154 | 1.610.17 | -0.450.63 | 4.36 |
| Bo158 | 20.005.57 | -1.020.02 | 3.06 |
| Bo161 | 20.001.00 | -1.600.48 | 3.64 |
| Bo163 | 11.751.60 | -0.360.27 | 1.87 |
| Bo164 | 1.610.18 | -0.090.40 | 1.88 |
| Bo165 | 11.503.08 | -1.800.32 | 1.49 |
| ID | Age | Metallicity | |
|---|---|---|---|
| (Gyr) | [Fe/H] | (per degree of freedom) | |
| Bo167 | 5.501.12 | -0.420.23 | 1.15 |
| Bo171 | 10.751.87 | -0.410.04 | 2.49 |
| Bo174 | 18.501.88 | -1.670.27 | 1.27 |
| Bo178 | 15.502.37 | -1.510.12 | 1.03 |
| Bo179 | 9.752.17 | -1.100.02 | 0.97 |
| Bo180 | 6.251.37 | -1.190.07 | 1.67 |
| Bo182 | 16.752.93 | -1.240.12 | 1.33 |
| Bo183 | 3.000.09 | -0.190.31 | 1.05 |
| Bo184 | 1.680.08 | -0.370.40 | 1.63 |
| Bo185 | 9.753.24 | -0.760.08 | 2.67 |
| Bo190 | 12.752.24 | -1.030.09 | 0.57 |
| Bo193 | 15.503.92 | -0.440.17 | 1.49 |
| Bo197 | 0.250.03 | -0.430.36 | 2.67 |
| Bo201 | 10.754.26 | -1.060.21 | 2.64 |
| Bo203 | 6.250.86 | -0.900.32 | 1.45 |
| Bo204 | 7.000.93 | -0.800.17 | 2.02 |
| Bo205 | 20.002.29 | -1.340.13 | 1.85 |
| Bo206 | 20.002.50 | -1.450.10 | 3.30 |
| Bo209 | 20.000.74 | -1.370.13 | 1.78 |
| Bo211 | 19.001.68 | -1.670.52 | 1.03 |
| Bo213 | 7.501.61 | -1.020.11 | 1.89 |
| Bo214 | 4.001.50 | -1.000.61 | 2.63 |
| Bo217 | 10.252.15 | -0.930.14 | 1.05 |
| Bo218 | 19.002.30 | -1.190.07 | 2.06 |
| Bo220 | 6.000.83 | -1.210.09 | 0.96 |
| Bo221 | 16.753.57 | -1.290.04 | 1.47 |
| Bo222 | 7.751.46 | -0.930.95 | 5.09 |
| Bo224 | 5.501.00 | -1.800.05 | 0.45 |
| Bo225 | 15.504.89 | -0.670.12 | 2.52 |
| Bo228 | 10.001.86 | -0.650.66 | 0.98 |
| Bo235 | 4.000.59 | -0.720.26 | 1.65 |
| Bo037a | 12.43.2 | 1.070.20 | 1.43 |
Note: a values taken from Ma et al. (2006b).
| Name | Best-fitting age (Gyr) | ||
|---|---|---|---|
| (original errors) | ( original) | ( original) | |
| Bo015 | 1.430.04 | 1.430.04 | 1.430.05 |
| Bo137 | 5.501.08 | 5.751.09 | 4.751.09 |
| Bo228 | 10.001.86 | 10.501.72 | 9.752.11 |
| Bo178 | 15.502.37 | 16.752.36 | 14.502.32 |
| Bo135 | 20.002.10 | 20.001.34 | 18.501.89 |
4.3 Check of the importance of the photometric uncertainties
We will explore and quantify to what extent the photometric uncertainties affect our results. To this end, we randomly selected a number of GCs, while making sure that they spanned our entire age range. The results for a small subsample of our GCs are listed in Table 3. From the left to the right column on the same line, the photometric uncertainties vary from their original values (1), half the original (2), and twice the original (3). From this initial comparison it is clear that the photometric uncertainties adopted do not affect our results significantly, in view of the large uncertainties in the derived ages, but we note small differences in the best-fitting ages towards the high-age end. In Fig. 4 we show the results for the entire sample. The subscripts, 1, 2 and 3, refer to conditions (1), (2) and (3) above, respectively. A comparison of Figs. 4a and c on the one hand, and b and d on the other show that (i) the best-fitting age estimates are essentially independent of the photometric uncertainty assumed for ages up to about 8 Gyr; (ii) for older ages, the best-fitting ages tend to be overestimated by Gyr, in the majority of cases, if the photometric uncertainties are halved, and (iii) underestimated by Gyr, for most objects, if the photometric uncertainties are doubled. We also note, however, that the actual uncertainties on the derived ages are well in excess of these small systematic effects at old age; for this reason (and for improved clarity) we have omitted the error bars in Figs. 4c and d. Nevertheless, we will need to keep these small systematic offsets in mind when assessing the absolute uncertainties in our best-fitting age estimates, which we will do in the next section.

4.4 Comparison of age determinations

Jiang et al. (2003) estimated the ages of their 172 M31 GCs, based on only the BATC data and on the SSP models of BC96; the reddening values adopted by Jiang et al. (2003) were also from Barmby et al. (2000). However, Jiang et al. (2003) only used the BC96 models for three metallicities, i.e., 0.0004, 0.004 and 0.02, and did not linearly interpolate to find the best-fitting metallicities. For old GCs, the age/metallicity degeneracy becomes important, so it is reasonable to postulate that Jiang et al. (2003) did not estimate the ages of their GC sample as accurately as we have done in this paper. Figure 5 shows a comparison of the age determination for the M31 GCs in common between Jiang et al. (2003) and this paper. It is immediately clear that there is a significant difference between Jiang et al. (2003) and our results.
In order to have confidence in our age determinations in this paper, we must make an effort to understand the main cause of these significant differences between the age estimates presented here and those of Jiang et al. (2003). Since we suspected that the age-metallicity degeneracy may be the principal culprit in this regard, we used Table 3 in Jiang et al. (2003) to produce Fig. 6. Here, we show the difference in age versus the difference in metallicity for the M31 GCs in common between our samples; we used a straightforward conversion from , as listed in Jiang et al. (2003), and [Fe/H], assuming for the sake of simplicity that these parameters are one and the same. The error bars along the age axis are a combination of the uncertainties in age from both the present paper and the 20 per cent uncertainties quoted in Jiang et al. (2003); the error bars along the metallicity axis represent the uncertainties in [Fe/H] from Table 2 only. From Fig. 6 it is immediately obvious that there is indeed a very strong age-metallicity degeneracy present among our GC sample; this is also (and just as significantly so) the case if we had used “Age” instead of “log(Age)” as our horizontal axis (not shown). The correlation shown in this figure is excellent, and in the sense expected if our new age estimates are indeed more accurate444We note that the tight correlation is predominantly driven by the age-metallicity degeneracy evident in the Jiang et al. (2003) results: the distribution of data points in the versus [Fe/H] (Jiang et al., 2003) plane shows a clear general trend of decreasing metallicity with increasingly large ages in the Jiang et al. (2003) results; such a clear correlation is not evident in the versus [Fe/H] plane defined by our new data.; the scatter is likely partially owing to the discrete steps in metallicity adopted by Jiang et al. (2003), as well as to the intrinsic uncertainties in the metallicity determination and possibly to a residual (but small; see footnote 4) age-metallicity degeneracy in the age determinations presented here. In any case, the scatter in the relationship is well inside the level. Thus, here we have shown that we fully understand the significant differences between our age determinations and those of Jiang et al. (2003). We believe to have presented significant improvements in the present paper, as well as clear evidence that the previous age determinations of statistically large samples of M31 GCs were more significantly affected by the age-metallicity degeneracy affecting old GCs than our new age estimates.

We will now explore whether our GC sample constitutes a random subsample of the Jiang et al. (2003) GC sample. Fig. 7 shows the age distribution for the full Jiang et al. (2003) GC sample, as well as for the full GC sample selected in this paper. Both distributions are based on the age determinations of Jiang et al. (2003). In Fig. 7, the numbers have been normalized, i.e., in each bin the number of objects is divided by the total number of objects. To first order, Fig. 7 shows that our sample constitutes a randomly selected subsample of the Jiang et al. (2003) GC sample; the main features of the age distribution are apparent in both distributions. Any apparent differences, such as the relative ratio of the two age peaks at ages below 10 Gyr, can be attributed to Poissonian uncertainties at the level. To quantify the similarities and differences between both age distributions, we employed a Kolmogorov-Smirnov (KS) test. The maximum value of the absolute difference is for these two samples, containing 91 and 172 data points, respectively. The probability of obtaining this value for is 28.3 per cent, which means that there is a small, 28.3 per cent probability that the two distributions are different.

4.5 The M31 GC age distribution
Fig. 8 shows the (newly determined) age distribution of our sample GCs. It shows that there exist young and intermediate-age subpopulations among the M31 GC population, peaking at ages of and Gyr, respectively. The “usual” complement of GCs of similar age as the old Galactic GCs, previously discussed by Barmby et al. (2000), Beasley et al. (2004), Burstein et al. (2004), and Puzia et al. (2005), is – of course – present as well. Assuming Poissonian statistical errors, the two (young and intermediate-age) subpopulations are indeed significant at the level. In order to assess the robustness of these features in the newly derived age distribution of our M31 GC sample, we need to take into account the corresponding uncertainties in age, as well as the bin size (in Gyr) used to construct the age distribution.

A comparison of the uncertainties in our derived GC ages (obtained from our SED fitting routine) as a function of age (not shown), reveals that the errors increase significantly with increasing age. This is simply owing to the reduced age resolution of older broad-band SEDs, since SSP colours are not as sensitive to age variations at old ages (i.e., in excess of a few Gyr) compared to their earlier evolution. For GC ages up to Gyr, the uncertainties in our derived cluster ages are generally Gyr, in most cases significantly so. Both the spread and the upper limit of the age uncertainties increase, the upper limit roughly linearly. The latter reaches Gyr at an age of Gyr. This is, in fact, the age range of interest for our assessment of the robustness of the doubly-peaked M31 GC age distribution. Fortunately, as we discussed in Section 4.3, the derived ages are insensitive to the photometric uncertainties assumed at these young and intermediate ages. We therefore adopt the uncertainties on the derived ages as the basis for our bin sizes; the doubly-peaked age distribution remains a significant feature at the level for age bins of up to 1.5 Gyr. We conclude, therefore, that this feature is real and robustly detected. In addition, in Fig. 9 we plot the relative uncertainties in our derived GC ages as a function of age. It is clear that, although the absolute age errors increase significantly with increasing age, the relative uncertainties are rather similar over the full range of derived ages, with a mean of (1 spread).
The age peak at Gyr appears to roughly coincide with the intermediate-age GC population aged between and 8 Gyr discussed by Puzia et al. (2005), which they found to have a mean metallicity of [Z/H] dex (although they also note that their sample is biased towards high-metallicity objects). It is worth noting that a similar intermediate-age star-forming event may have affected the resolved stellar population, at least along M31’s minor axis: Brown et al. (2003) found indications of an intermediate-age resolved stellar population, of Gyr and with [Fe/H] dex, from their HST/ACS observations.

The young-age peak at Gyr we detect in this paper has not been discussed before; in view of the small age uncertainties (see above) at young ages, it is unlikely that this population represents the Gyr-old population of BLCCs of Fusi Pecci et al. (2005). Instead, we argue that there may have been an additional violent star-forming event that triggered the formation of a GC subpopulation in the disc of M31 some 3 Gyr ago.
It is well-known that the abundance distributions of GCs in many galaxies are bimodal, including that of the M31 GC system (e.g. Barmby et al., 2000; Perrett et al., 2002). Forbes et al. (1997) found that the metal-rich GCs in elliptical and cD galaxies are closely coupled to the resolved stellar populations of their parent galaxies, but the metal-poor GCs are largely independent of the galaxies. They concluded that the metal-poor GCs were formed at the time of galaxy formation, and the metal-rich GCs at a later stage. If so, this may imply that the age distribution of GCs should be bi- or multi-modal. Despite our incomplete coverage of the M31 halo and the extreme outer disc regions along the galaxy’s major axis, based on Fig. 8 we can confirm that, in general, the age distribution of the M31 GCs is unlikely to be best described by a monomodal distribution (see also Puzia et al., 2005, for an extensive discussion, based on their high-metallicity biased GC sample).
The age distributions of both the full M31 GC sample and of the field stars, combined with the detection of a metal-poor GC population obeying thin-disc kinematics (Morrison et al., 2004), poses serious problems for our understanding of the formation and evolution of the galaxy’s disc. On the one hand, the tightly constrained kinematics argue for a relatively quiescent thin-disc evolution since early times (but see Abadi et al., 2003), while on the other hand the formation of massive star clusters requires violent conditions (such as galaxy mergers) rather than in situ formation (see Fusi Pecci et al., 2005; Puzia et al., 2005, for a discussion).
4.6 A Relationship between Age and Metallicity?
The Galactic GC system is well-known to obey a clear age-metallicity relationship, in the sense of older GCs being characterised by generally lower metallicities (e.g. Sarajedini & Christopher, 1989; Chaboyer et al., 1996). Ma et al. (2006b) simultaneously obtained ages and metallicities for 33 M31 GCs and GC candidates, based on the BC03 SSP models, but did not find any significant relationship between their ages and metallicities. However, because of the age-metallicity degeneracy affecting the analysis done to the Ma et al. (2006b) GC sample, the ages and metallicities could not be obtained sufficiently accurately. Therefore, using the ages and metallicities of the M31 GCs discussed in this paper, we re-analysed the M31 GC sample. Fig. 10 shows the metallicity as a function of age for the GC sample discussed in this paper. It appears that a general trend between GC age and metallicity may exist, in the sense that the metal-poorer clusters are older, although the scatter in metallicity at a given age is significant. It may be better to postulate instead that there is a general lack of both low-metallicity younger GCs and of the highest-metallicity clusters at the oldest ages. Error bars have been omitted for reasons of clarity.

In order to assess the robustness of these statements, we produce the run of the mean of the data points across the age range, shown by the filled circles with the error bars. The error bars indicate the Gaussian ’s of the data points in each age range, indicated by the horizontal bars at the bottom of the figure. Table 4 is a compilation of the data points obtained for the mean values shown in Fig. 10. The trend outlined by these mean data points confirms the statements made here regarding the possible existence of an age-metallicity relation among the M31 GC sample. In view of our carefully validated random sampling of our M31 GCs, we believe that this age-metallicity relation is representative of the entire M31 GC population, providing that our positional (field of view) restrictions did not invalidate the random sampling (see Section 2.1). In view of the latter concern, we point out that our GC sample may be affected by an underrepresentation of BLCCs; these objects are mostly aged between Myr and Gyr, and may in fact have metallicities in the range (Fusi Pecci et al., 2005). If BLCCs are indeed underrepresented in our sample, their additional inclusion would, in fact, strengthen the age-metallicity relationship revealed in this paper.
A similar, although somewhat less robust result was found by Jiang et al. (2003), who reported to have determined that the more metal-poor M31 GCs appear to be older than their more metal-rich counterparts. This is, in essence, a similar conclusion as reached by Barmby & Huchra (2000) and Puzia et al. (2005), while the combination of positional information and the age-metallicity relationship found here is supportive of the existence of a small radial metallicity gradient in M31, discussed by Barmby et al. (2000); Perrett et al. (2002); Puzia et al. (2005) and references therein.
In Section 4.2, we estimated the ages for our 91 GCs using a minimisation method, in which we included the (systematic) model uncertainties following Charlot et al. (1996). We added these in quadrature to the observational uncertainties, in a similar fashion as Wu et al. (2005) and Ma et al. (2006b). However, we should be aware that this procedure could potentially somewhat confuse our statistical results, since the model uncertainties might introduce biases in the age-metallicity correlation, while the observational uncertainties smooth and puff-up such correlations. On the other hand, we point out that the model uncertainties are of the same order as the measurement uncertainties quoted by Jiang et al. (2003), at least for a large fraction of their measurements, so that the effect of adding the model uncertainties in quadrature implies, in essence, less than a doubling of the uncertainties, similar to what we did in Section 4.3. As such, we are confident that we have not introduced major biases into our fitting routine by taking into account the uncertainties inherent in the models (note that we only increase the uncertainties following this procedure; we did not add a systematic offset to the measurements.
| Age range | Mean age | Mean [Fe/H] | ||
|---|---|---|---|---|
| (Gyr) | (Gyr) | (Gyr) | (dex) | (dex) |
| 1.46 | 0.48 | 0.52 | 0.43 | |
| 2.82 | 0.44 | 0.59 | 0.46 | |
| 4.85 | 0.64 | 0.90 | 0.54 | |
| 6.94 | 0.68 | 1.11 | 0.44 | |
| 8.94 | 0.82 | 0.84 | 0.43 | |
| 11.18 | 0.95 | 0.91 | 0.41 | |
| 18.34 | 1.91 | 1.23 | 0.38 |
5 Summary and Conclusions
In this paper, we accurately re-determined the ages of 91 M31 GCs, based on improved data, updated theoretical stellar synthesis models and sophisticated fitting methods. In particular, we used photometric measurements of the 2MASS, which can partially break the age-metallicity degeneracy, in combination with optical photometry. We showed robustly that previous age determinations based on photometric data were affected significantly by this age-metallicity degeneracy.
Except for one cluster, the ages of our other sample GCs are all older than 1 Gyr. Their age distribution shows populations of young and intermediate-age GCs, peaking at Gyr and Gyr respectively, as well as the “usual” complement of well-known old GCs, of similar age as the majority of the Galactic GCs. The young-age peak at Gyr we detect in this paper has not been discussed before; in view of the small age uncertainties at young ages, it is unlikely that this population represents the Gyr-old population of BLCCs of Fusi Pecci et al. (2005). Instead, we argue that there may have been an additional violent star-forming event that triggered the formation of a GC subpopulation in the disc of M31 some 3 Gyr ago.
The distributions of the ages of both the GCs and the field stars, combined with the existence of a metal-poor GC population in M31 obeying thin-disc kinematics, poses serious problems for our understanding of the formation and evolution of the galaxy’s disc. While the tightly constrained kinematics argue for a relatively quiescent thin-disc evolution since early times, the formation of massive star clusters requires violent conditions (such as galaxy mergers) rather than in situ formation.
Our results also show that although there is significant scatter in metallicity at any age, there is a noticeable lack of young metal-poor and old metal-rich GCs, which might be indicative of an underlying age-metallicity relationship among the M31 GC population.
Acknowledgments
We thank Uta Fritze and Simon Goodwin for useful comments on aspects of this paper; we are also indebted to the referee for his/her thoughtful comments and insightful suggestions that improved this paper greatly. This work has been supported by the Chinese National Key Basic Research Science Foundation (NKBRSF TG199075402) and by the Chinese National Natural Science Foundation, No. 10473012 and 10333060.
References
- Abadi et al. (2003) Abadi M. G., Navarro J. F., Steinmetz M., Eke V. R., 2003, ApJ, 597, 21
- Anders et al. (2004) Anders P., Bissantz N., Fritze-v. Alvensleben U., de Grijs R., 2004, MNRAS, 347, 196
- Arimoto (1996) Arimoto N., 1996, From Stars to Galaxies, Leitherer C., Fritze–v. Alvensleben U., Huchra J., eds., ASP Conf. Ser., (ASP: San Francisco), 98, p. 287
- Barmby & Huchra (2000) Barmby P., Huchra J.P., 2000, ApJ, 531, L29
- Barmby et al. (2000) Barmby P., Huchra J., Brodie J., Forbes D., Schroder L., Grillmair C., 2000, AJ, 119, 727
- Barmby & Huchra (2001) Barmby P., Huchra J. P., 2001, AJ, 122, 2458
- Barmby & Huchra (2000) Barmby P., Huchra J. P., 2000, ApJ, 531, L29
- Barmby et al. (2002) Barmby P., Holland S., Huchra J. P., 2002, AJ, 123, 1937
- Battistini et al. (1980) Battistini P., Bònoli F., Braccesi A., Fusi Pecci F., Malagnini M. L., Marano B., 1980, A&AS, 42, 357
- Battistini et al. (1987) Battistini P., Bònoli F., Braccesi A., Federici L., Fusi Pecci F., Marano B., Börngen F., 1987, A&AS, 67, 447
- Beasley et al. (2004) Beasley M. A., Brodie J. P., Strader J., Forbes D. A., Proctor R. N., Barmby P., Huchra J. P., 2004, AJ, 128, 1623
- Beasley et al. (2005) Beasley M. A., Brodie J. P., Strader J., Forbes D. A., Proctor R. N., Barmby P., Huchra J. P., 2005, AJ, 129, 1412
- Bònoli et al. (1987) Bònoli F., Delpino F., Federici L., Fusi Pecci F, 1987, A&A, 185, 25
- Brodie & Huchra (1990) Brodie J. P., Huchra J. P., 1990, ApJ, 362, 503
- Brown et al. (2003) Brown T. M., Ferguson H. C., Smith E., Kimble R. A., Sweigart A. V., Renzini A., Rich R. M., VandenBerg D. A., 2004, ApJ, 592, L17
- Brown et al. (2004) Brown T. M., Ferguson H. C., Smith E., Kimble R. A., Sweigart A. V., Renzini A., Rich R. M., VandenBerg D. A., 2004, ApJ, 613, L125
- Bruzual & Charlot (1993) Bruzual A. G., Charlot S., 1993, ApJ, 405, 538 (BC93)
- Bruzual & Charlot (1996) Bruzual A. G., Charlot S., 1996, unpublished (BC96)
- Bruzual & Charlot (2003) Bruzual G., Charlot S., 2003, MNRAS, 344, 1000 (BC03)
- Burstein et al. (2004) Burstein D., et al., 2004, ApJ, 614, 158
- Calzetti (1997) Calzetti D., 1997, AJ, 113, 162
- Chabrier (2003) Chabrier G., 2003, PASP, 115, 763
- Cardiel et al. (2003) Cardiel N., Gorgas J., Sánchez-Blázquez P., Cenarro A. J., Pedraz S., Bruzual A. G., Klement J., 2003, A&A, 409, 511
- Cardelli et al. (1989) Cardelli J. A., Clayton G. C., Mathis J. S., 1989, ApJ, 345, 245
- Carpenter (2001) Carpenter J. M., 2001, AJ, 121, 2851
- Carpenter et al. (2001) Carpenter J. M., Hillenbrand L. A., Skrutskie M. F., 2001, AJ, 121, 3160
- Charlot et al. (1996) Charlot S., Worthey G., Bressan A., 1996, ApJ, 457, 625
- Chaboyer et al. (1996) Chaboyer B., Demarque P., Sarajedini A. A., 1996, ApJ, 459, 558
- Díaz, Terlevich & Terlevich (1989) Díaz A. I., Terlevich E., Terlevich R., 1989, MNRAS, 239, 325
- Djorgovski et al. (1997) Djorgovski S. G., Gal R. R., McCarthy J. K., Cohen J. G., de Carvalho R. R., Meylan G., Bendinelli O., Parmeggiani G., 1997, ApJ, 474, L19
- de Grijs et al. (2003b) de Grijs R., Fritze–v. Alvensleben U., Anders P., Gallagher J. S., Bastian N., Taylor V. A., Windhorst R. A., 2003b, MNRAS, 342, 259
- de Grijs et al. (2005a) de Grijs R., Anders P., Lamers H.J.G.L.M., Bastian N., Parmentier G., Sharina M.E., Yi S., 2005a, MNRAS, 359, 874
- de Grijs et al. (2005b) de Grijs R., Wilkinson M. I., Tadhunter C. N., 2005b, MNRAS, 361, 311
- de Jong (1996) de Jong R. S., 1996, A&A, 313, 377
- Elias et al. (1982) Elias J. H., Frogel J. A., Matthews K., Neugebauer G., 1982, AJ, 87, 1029
- Elias et al. (1983) Elias J. H., Frogel J. A., Hyland A. R., Jones T. J., 1983, AJ, 88, 1027
- Faber (1973) Faber S. M., 1973, ApJ, 179, 731
- Fioc & Rocca-Volmerange (1997) Fioc M., Rocca-Volmerange B., 1997, A&A, 326, 950
- Forbes et al. (1997) Forbes D. A., Brodie J. P., Grillmair C. J., 1997, AJ, 113, 1652
- Fusi Pecci et al. (1993) Fusi Pecci F., Cacciari C., Frederici L., Pasquali A., 1993, in: The Globular Cluster–Galaxy Connection, Smith G.H., Brodie J.P., eds., ASP Conf. Ser., (ASP: San Francisco), 48, p. 410
- Fusi Pecci et al. (1994) Fusi Pecci F., et al., 1994, A&A, 284, 349
- Fusi Pecci et al. (2005) Fusi Pecci F., Bellazzini M., Buzzoni A., De Simone E., Federici L., Galleti S., 2005, AJ, 130, 554
- Galleti et al. (2004) Galleti S., Federici L., Bellazzini M., Fusi Pecci F., Macrina S., 2004, A&A, 426, 917
- Jiang et al. (2003) Jiang L., Ma J., Zhou X., Chen J., Wu H., Jiang Z., 2003, AJ, 125, 727
- Jones & Worthey (1995) Jones L. A., Worthey G., 1995, ApJ, 446, L31
- Kaviraj et al. (2006) Kaviraj S., Rey S.-C., Rich R. M., Lee Y.-W., Yoon S.-J., Yi S. K., 2006, MNRAS, submitted (astro-ph/0601050)
- Kennicutt (1998) Kennicutt R. C., 1998, ARA&A, 36, 189
- Leitherer & Heckman (1995) Leitherer C., Heckman T. M., 1995, ApJS, 96, 9
- Leitherer et al. (1996) Leitherer C., et al., 1996, PASP, 108, 996
- Ma et al. (2001) Ma J., Zhou X., Kong X., Wu H., Chen J., Jiang Z., Zhu J., Xue S., 2001, AJ, 122, 1796
- Ma et al. (2002a) Ma J., Zhou X., Chen J., Wu H., Jiang Z., Xue S., Zhu J., 2002a, A&A, 385, 404
- Ma et al. (2002b) Ma J., Zhou X., Chen J., Wu H., Jiang Z., Xue S., Zhu J., 2002b, AJ, 123, 3141
- Ma et al. (2002c) Ma J., Zhou X., Chen J., Wu H., Kong X., Jiang Z., Zhu J., Xue S., 2002c, AcA, 52, 453
- Ma et al. (2006a) Ma J., et al., 2006a, A&A, 449, 143
- Ma et al. (2006b) Ma J., de Grijs R., Yang Y., Zhou X., Chen J., Jiang Z., Wu Z., Wu J., 2006b, MNRAS, 368, 1443
- MacArthur et al. (2004) MacArthur L. A., Courteau S., Bell E., Holtzman J. A., 2004, ApJS, 152, 175
- Macri (2001) Macri L. M., 2001, ApJ, 549, 721
- Mollà, Ferrini & Diaz (1997) Mollà M., Ferrini F., Díaz A. I., 1997, ApJ, 475, 519
- Morrison et al. (2004) Morrison H., Harding P., Perrett K.M., Hurley-Keller D., 2004, ApJ, 603, 87
- Oke & Gunn (1983) Oke J. B., Gunn J. E., 1983, ApJ, 266, 713
- Origlia et al. (1999) Origlia L., Goldader J. D., Leitherer C., Schaerer D., Oliva E., 1999, ApJ, 514, 96
- Perrett et al. (2002) Perrett K. M., Bridges T. J., Hanes D. A., Irwin M. J., Brodie J. P., Carter D., Huchra J. P., Watson F. G., 2002, AJ ,123, 2490
- Puzia et al. (2005) Puzia T. H., Perrett K. M., Bridges T. J., 2005, A&A, 434, 909
- Rich et al. (1996) Rich R. M., Mighell K. J., Freedman W. L., Neill J. D., 1996, AJ, 111, 768
- Rich et al. (2005) Rich R. M., Corsi C. E., Cacciari C., Federici L., Fusi Pecci F., Djorgovski S. G., Freedman W. L., 2005, AJ, 129, 2670
- Rose (1984) Rose J. A., 1984, AJ, 89, 1238
- Rose (1985) Rose J. A., 1985, AJ, 90, 1927
- Salpeter (1955) Salpeter E. E., 1955, ApJ, 121, 161
- Sarajedini & Christopher (1989) Sarajedini A., King C. R., 1989, AJ, 98, 1624
- Schweizer et al. (2004) Schweizer F., Seitzer P., Brodie J.P., 2004, AJ, 128, 202
- Searle et al. (1973) Searle L., Sargent W. L. W., Bagnuolo W. G., 1973, ApJ, 179, 427
- Stanek & Garnavich (1998) Stanek K. Z., Garnavich P. M., 1998, ApJ, 503, 131
- Stephens et al. (2001) Stephens A. W., et al., 2001, AJ, 121, 2597
- Stetson (1987) Stetson P. B., 1987, PASP, 99, 191
- Tinsley (1968) Tinsley B. M., 1968, ApJ, 151, 547
- Tinsley (1972) Tinsley B. M., 1972, ApJ, 178, 319
- Vazdekis et al. (1997) Vazdekis A., Peletier R. F., Beckman J. E., Casuso E., 1997, ApJS, 111, 203
- Vazdekis & Arimoto (1999) Vazdekis A., Arimoto N., 1999, ApJ, 525, 144
- Worthey (1994) Worthey G., 1994, ApJS, 95, 107
- Worthey et al. (1994) Worthey G., Faber S. M., González J., Burstein D., 1994, ApJS, 94, 687
- Wu et al. (2005) Wu H., Shao Z. Y., Mo H. J., Xia X. Y., Deng Z. G., 2005, ApJ, 622, 244
- Yan et al. (2000) Yan H. J., et al., 2000, PASP, 112, 691