Testing General Relativity with High-Resolution Imaging of Sgr A*
Abstract
Submilliarcsecond astrometry and imaging of the black hole Sgr A* at the Galactic Center may become possible in the near future at infrared and submillimetre wavelengths. This resolution is sufficient to observe the silhouette the supermassive black hole in the Galactic center casts upon background emission. However, more exciting is the prospect of observing “hot spots” in the accretion flow. Here we discuss how such measurements may be used to test not only the consistency of General Relativity, but also the validity of the Kerr metric in particular.
1 Introduction
Testing strong field gravity remains one of the primary objectives of observational astronomy. Due to their compact nature, black holes provide an ideal environment to do this. Nevertheless, an unambiguous confirmation of strong field relativity has been elusive thus far.
There have been a number of attempts to probe the strong gravity regime, including observations of the relativistically broadened Fe K line (see, e.g., Pari-Brom-Mill:01 ; Reyn-Nowa:03 ), interpretations of quasi-periodic oscillations (QPOs) (see, e.g., Remi:05 ; Genz_etal:03 ), and multiwavelength spectropolarimetric observations (see, e.g., Conn-Star-Pira:80 ; Laor-Netz-Pira:90 ; Brod-Loeb:06 ). However, the interpretation of each of these are dependent upon unknown accretion physics, making the implications for general relativity ambiguous.
For example, the failure to find an expected correlation between the variability in the Fe K line emission and the soft X-ray continuum implies that the simplest emission models for the Fe K observations are incomplete (see, e.g., Wang_etal:99 ; Chia_etal:00 ; Lee_etal:00 ; Wang-Wang-Zhou:01 ; Weav-Gelb-Yaqo:01 ), though attempts to rectify this with the inclusion of strong gravitational lensing have been made Matt-Fabi-Reyn:97 . In addition, alternative explanations for the formation of the broad iron lines exist (see, e.g., Elvi:00 ; You-Liu-Chen-Chen-Zhan:03 ), further complicating their interpretation.
The most commonly discussed black hole QPO’s are those observed in the X-ray spectra of stellar-mass black hole candidates. These typically have ’s of – and are at kilohertz frequencies. Unfortunately, in the absence of a definitive theory for how these are produced, the identification of these with the epicycles of black hole spacetimes is tenuous at best. A second class of QPO’s are those observed in supermassive black holes. In the context of Sgr A*, these are observed in the near-infrared (NIR) and X-ray bands, have ’s of , (though see Bela_etal:06 ), and periods on the order of 20 minutes. If these are interpreted as the Keplerian orbital periods of the innermost stable circular orbit (ISCO), they imply black hole spins as high as .
More recently, arguments based upon the lack of a thermal peak in the spectra have been used to infer the absence of a surface in stellar-mass black hole candidates (see, e.g., Garcia_etal:01 ) and Sgr A* Brod-Nara:06 . In the latter case, where the putative thermal emission due to the small accretion rate peaks in the near infrared (NIR), this result appears especially robust. However, these arguments present only a qualitative confirmation of the observational consistency of general relativity.
In contrast, it is now technologically feasible to image a black hole directly. A background illuminated black hole will appear in silhouette, with an angular size of roughly twice that of the horizon Bard:73 , and may be directly observed. With an expected resolution of , submillimeter very-long baseline interferometry (VLBI) would be able to image the silhouette cast upon the accretion flow by Sgr A* (with an angular scale of ), and M87 () Falc-Meli-Agol:00 ; Brod-Loeb:05b . In principle, detailed measurements of the size and shape of the silhouette could yield information about the mass and spin of the central black hole. In practice, the interpretation of such an image will likely depend upon the accretion flow model employed (this is discussed in more detail in §2).
Sgr A* has exhibited strong flares in the NIR and X-ray Ghez_etal:04 ; Ecka_etal:04 ; Genz_etal:03 ; Baga_etal:01 , and more recently in the submillimeter Marr:06 , implying that the innermost portions of the emitting region are strongly variable. A simple model for the flares, motivated by the evidence of periodicity, is that of transient orbiting bright regions, hot spots, which dominate the flaring luminosity. Such hot spots appear inevitable, the product of shocks and magnetic reconnection events within the accretion flow. Due to its dynamical and compact nature, images of such a spot will contain significantly more information about the spacetime. Each imaged spot will allow the measurement of both, the mass and spin of the black hole. Combining observations of many hot spots orbiting at different radii provides a way to test not only the consistency of general relativity, but the validity of the Kerr metric generally, and the no-hair theorems specifically.
2 Silhouettes
For a truly back-lit black hole, strong gravitational lensing produces a silhouette with radius , roughly twice the size of the horizon of a non-rotating black hole. The size and shape are nearly independent of the black hole spin, though the position of the silhouette relative to the black hole changes substantially (see, e.g., taka:04 ).
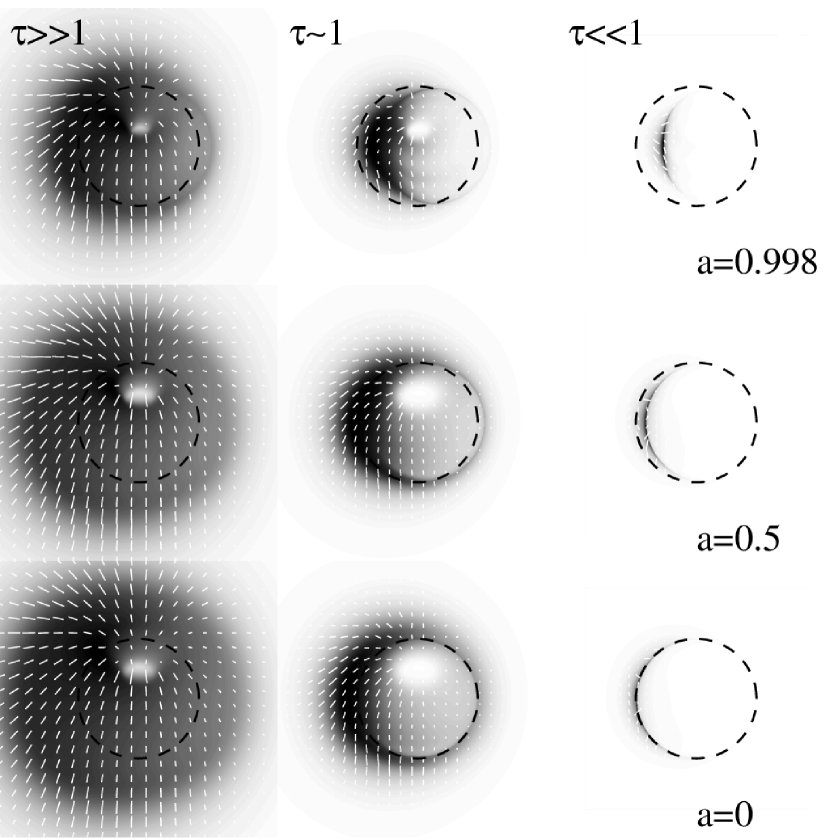

However, for a black hole embedded in an accretion flow the silhouette will generally be asymmetric regardless of black hole spin. Even in an optically thin accretion flow asymmetry will result from special-relativistic effects (aberration and Doppler shifting). The degree of asymmetry will be strongly dependent upon the spectral index, vanishing for (i.e., a thermally emitting, optically thin disk). For , the asymmetry can be quite large, as seen in left column of images in Figure 2.
When the opacity of the disk cannot be ignored, as is likely to be the case in Sgr A* at submillimeter wavelengths, this to will alter the shape and position of the silhouette. Indeed, as can be seen in the left two columns of Figure 2, the shape of the photosphere itself is asymmetric, again due to special relativity. Hence, it appears unlikely that it will be possible to completely disentangle the effects of strong gravity from the accretion disk physics. Nonetheless, comparisons of the image centroid positions between the optically thick (where the photosphere is large, and thus unaffected by the spin of the black hole) and thin limits (where the emission is dominated by the inner disk edge, presumably at the ISCO) provides a rough measure of the black hole spin, independent of the details of the accretion flow Brod-Loeb:05b .
A second discriminant between low and high spin may be found in the net polarization. In the optically thin limit the emission is restricted to a small arc, and thus the polarimetric properties of the source are dominated by the magnetic field in that region. Conversely, as the optical depth increases the emission is more distributed and thus the net polarization is an average over a wide variety of magnetic field directions (compounded with position angle rotations due to both, the relativistic motion of the disk, and gravitational lensing). As a result, quite generally, the polarization fraction will increase with increasing frequency, plateauing at a value set by the optically thin spectral index and the spin of the black hole. Low asymptotic polarization fractions are then indicative of high spin, as a consequence of frame dragging. This is shown for two magnetic field geometries in Figure 2.
Unfortunately, due to the underlying uncertainty in the accretion model, it will be difficult to make precise measurements of the black hole spin with these observations. Alternatively, these measurements will provide invaluable information on the nature of the accretion flows in low-luminosity active galactic nuclei.
3 Hot Spots
Observations of Sgr A* show strong variability, with the possibility of periodicity, thus suggesting hot spots in the accretion flow. This is not unexpected theoretically as strong inhomogeneities develop in the innermost regions of general-relativistic magnetohydrodynamic simulations (see, e.g., DeVi-Hawl-Krol:03 ), although mapping these into inhomogeneities in the emission is non-trivial. This is likely to happen via particle acceleration at strong shocks and/or magnetic reconnection events. Both mechanisms will produce a distribution of compact, non-thermally emitting regions111Note that due to the high radiative efficiency of non-thermal electrons in this environment, this is unlikely to have a significant effect upon the accretion flow structure..
There are a number of advantages to imaging these “hot spots” as opposed to the underlying quiescent accretion flow. Firstly, due to their compact, and essentially local nature, they are likely to be considerably simpler to model than the global structure of the accretion flow. Hence, the primary difficulty in using the black hole silhouettes to measure the mass and spin is naturally solved in this case. Secondly, encoded in the images of the hot spot is significantly more information. This is because at each instant, the light rays which connect the spot to the observer fill, and thus are sensitive to, a far smaller region of the spacetime. Therefore, as the hot spot orbits the black hole, the observed image is continually sampling new regions of the spacetime. Observing multiple hot spots at different orbital radii completes the sampling of the spacetime.
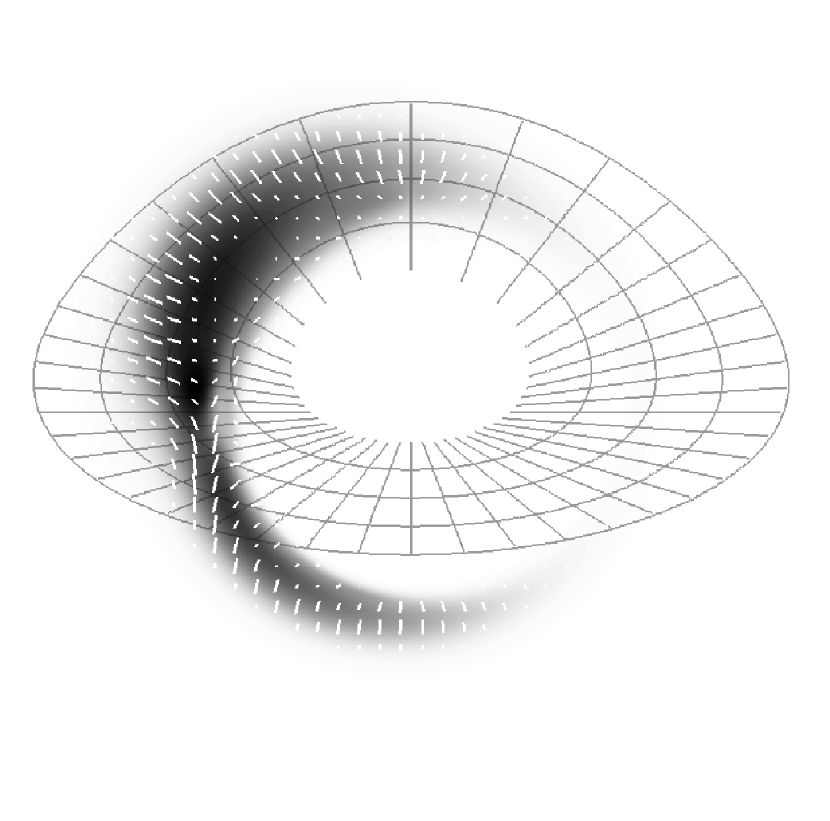

Figure 4 shows the instantaneous image of a spherically symmetric, synchrotron emitting hot spot (see Brod-Loeb:06 for details regarding the spot model and the generation of the image). Immediately visible is the fact that two, albeit merging, images of the hot spot are present. Within each image the polarization angles are roughly uniform. However, the polarization angles of the two images are significantly different. The result is that strong lensing is typically associated with a decrease in the polarized flux. This is indeed apparent in the light curve shown in Figure 6. Thus, the polarized flux is sensitive to the presence of higher order images. Since the light rays which produce these images are more strongly lensed than those that produce the primary, and consequently spend more time in the strongly gravitating region, they are more sensitive the spacetime. Therefore, as mentioned earlier, the polarization evolution is diagnostic of the black hole parameters.
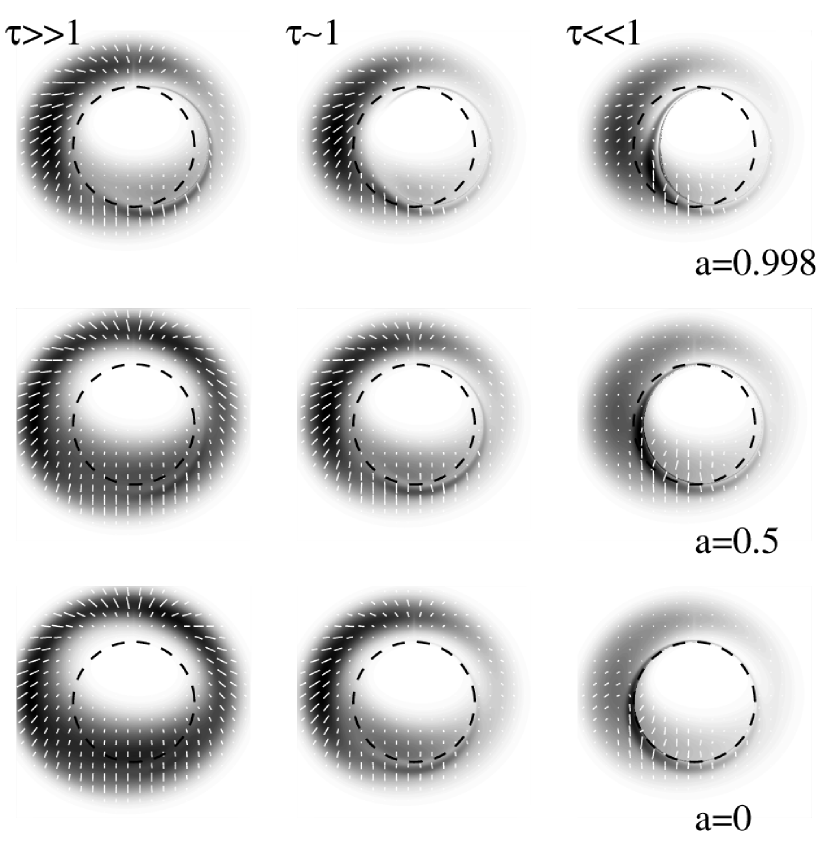

Images of the hot spots are likely to be averaged over many orbits. Figure 6 shows background subtracted orbit-averaged hot-spot images for the same cases presented in Figure 2. As with the accretion disk, the hot-spot images are generally asymmetric, becoming more so as the optical depth decreases. However, in this case the images form sets of rings, one for each hot-spot image. As spin increases, these rings are displaced, with those formed by higher order images naturally being displaced further. Therefore, if the hot-spot parameters (orbital parameters, size, density and spectral index) are known, then the spin of the black hole may be determined by measuring the relative shift between the primary and secondary images. Since this involves relative astrometry, this is an ideal problem for submillimeter VLBI.
In addition to the submillimeter imaging, the proposed GRAVITY instrument at the very-large telescope interferometer promises to provide phase-referenced astrometry on few minute timescales in the NIR Boug_etal:06 ; Eise_etal:05 . Therefore, it will be possible to track the image centroid path taken by a hot spot. A seen in Figure 6, deviations due to strong lensing do occur. These are, in general, functions of the black hole spin. However, the dominant effect is due to the orbital parameters (inclination and radius). Hence, at the least, monitoring the centroid motion provides a method by which to determine the hot-spot orbit.

Despite its simplicity, the toy hot spot model we have employed here fits actual flare intensity and polarization light curves remarkably well. Two fits to submillimeter observations are shown in Figure 7, differing in the time region over which the fits were attempted. Clearly, the flare is evolving on orbital timescales, with the period decreasing as expected for infall. This was not taken into account in the light curve modeling, and thus the fit was restricted to a single period. Nevertheless, the hot spot model is capable of fitting the total intensity, polarized flux and position angle simultaneously, with a reduce- of order unity. While a claim to have measured the flare orbit and/or black hole spin would be premature, the fact that even the simplest model fits implies that such hot spots are indeed simple.
Combining spectopolarimetric observations, imaging, and the centroid paths, it is possible in principle to determine simultaneously the hot-spot orbit and size in physical units, and thus the black hole mass and spin Brod-Loeb:06 ; Brod-Loeb:05 . Because they are compact, the rays connecting the hot spot and an observer at infinity sample only a small portion of the spacetime around the black hole. Thus, the measured mass and spin are actually indicative of the spacetime in a small region. Observations of multiple spots, presumably at different orbital radii, will consequently provide a way in which to measure the mass and spin at a number of distinct points near the black hole. These may then be compared to the general relatavistic prediction that the spacetime is fully described by a mass and spin alone, thus providing a way in which to quantitatively test the Kerr metric.
4 Conclusions
Despite their putative size, imaging the black hole horizons at submillimeter wavelengths is now technologically feasible. In addition, phase-referenced astrometry will be available in the NIR in the coming decade. These capabilities will allow, for the first time, direct observations of gravity in the strongly non-linear regime.
Observations of the size, shape and location of the silhouette cast by the black hole on the surrounding accretion flow may be used in principle to determine its mass and spin. However, in practice this is unlikely to be simple due to uncertainties in accretion physics. Nevertheless, at the very least it will provide a means to learn about accretion onto compact objects.
Of more interest will likely be observations of hot spots. Due to their compact and dynamical nature their images contain more information than those of the underlying quiescent accretion flow. It appears to be possible, even with the simplest models, to constrain the hot spot parameters (e.g., orbit, size and spectral index). If this is indeed the case, then hot-spot observations will provide a method for quantitatively testing general relativity.
A.E.B. gratefully acknowledges the support of an ITC Fellowship from Harvard College Observatory. A. L. was supported in part by NASA grants NAG 5-1329 and NNG05GH54G and by the Clark/Cooke fund of Harvard University.
References
- [1] Pariev V I, Bromley B C and Miller W A 2001 ApJ 547 649–666
- [2] Reynolds C S and Nowak M A 2003 Phys. Rep. 377 389–466
- [3] Remillard R A 2005 in L Burderi et al., eds, AIP Conf. Proc. 797: Interacting Binaries: Accretion, Evolution, and Outcomes pp 231–240
- [4] Genzel R et al. 2003 Nature 425 934–937
- [5] Connors P A, Stark R F and Piran T 1980 ApJ 235 224–244
- [6] Laor A, Netzer H and Piran T 1990 MNRAS 242 560–569
- [7] Broderick A E and Loeb A 2006 MNRAS 367 905–916
- [8] Wang J X et al. 1999 ApJL 516 L65–L68
- [9] Chiang J et al. 2000 ApJ 528 292–305
- [10] Lee J C, Fabian A C, Reynolds C S, Brandt W N and Iwasawa K 2000 MNRAS 318 857–874
- [11] Wang J, Wang T and Zhou Y 2001 ApJ 549 891–895
- [12] Weaver K A, Gelbord J and Yaqoob T 2001 ApJ 550 261–279
- [13] Matt G, Fabian A C and Reynolds C S 1997 MNRAS 289 175–184
- [14] Elvis M 2000 ApJ 545 63–76
- [15] You J H, Liu D B, Chen W P, Chen L and Zhang S N 2003 ApJ 599 164–172
- [16] Belanger G et al. 2006 (Preprint astro-ph/0604337)
- [17] Garcia M R et al. 2001 ApJL 553 L47–L50
- [18] Broderick A E and Narayan R 2006 ApJL 638 L21–L24
- [19] Bardeen J M 1973 in C Dewitt and B S Dewitt, eds, Black Holes (New York: Gordon and Breach, 1973.)
- [20] Falcke H, Melia F and Agol E 2000 ApJL 528 L13–L16
- [21] Broderick A E and Loeb A 2006 ApJL 636 L109–L112
- [22] Ghez A M, Wright S A, Matthews K, Thompson D, Le Mignant D, Tanner A, Hornstein S D, Morris M, Becklin E E and Soifer B T 2004 ApJL 601 L159–L162
- [23] Eckart A, Baganoff F K, Morris M, Bautz M W, Brandt W N, Garmire G P, Genzel R, Ott T, Ricker G R, Straubmeier C, Viehmann T, Schödel R, Bower G C and Goldston J E 2004 A&A 427 1–11
- [24] Baganoff F K, Bautz M W, Brandt W N, Chartas G, Feigelson E D, Garmire G P, Maeda Y, Morris M, Ricker G R, Townsley L K and Walter F 2001 Nature 413 45–48
- [25] Marrone D 2006 in R Schc̈hodel et al., eds, From the Center of the Milky Way to Nearby Low-Luminosity Galactic Nuclei (Institute of Physics Publishing)
- [26] Takahashi R 2004 ApJ 611 996–1004
- [27] Aitken D K et al. 2000 ApJL 534 L173–LL176
- [28] Bower G C et al. 2002 ApJ 571 843–855
- [29] Yuan F, Quataert E and Narayan R 2004 ApJ 606 894–899
- [30] De Villiers J, Hawley J F and Krolik J H 2003 ApJ 599 1238–1253
- [31] Bougeret J L et al. 2006 Phase-A proposal for GRAVITY: An infrared wavefront sensor assisted beam combiner instrument for narrow angle astrometry and phase referenced faint imaging at the VLTI
- [32] Eisenhauer F et al. 2005 Astronomische Nachrichten 326 561–562
- [33] Broderick A E and Loeb A 2005 MNRAS 363 353–362