Discovery of an X-ray Jet and Extended Jet Structure in the Quasar PKS 1055+201
Abstract
This letter reports rich X-ray jet structures found in the Chandra observation of PKS 1055+201. In addition to an X-ray jet coincident with the radio jet we detect a region of extended X-ray emission surrounding the jet as far from the core as the radio hotspot to the North, and a similar extended X-ray region along the presumed path of the unseen counterjet to the Southern radio lobe. Both X-ray regions show a similar curvature to the west, relative to the quasar. We interpret this as the first example where we separately detect the X-ray emission from a narrow jet and extended, residual jet plasma over the entire length of a powerful FRII jet.
1 INTRODUCTION
The surprising discovery of a luminous, 100-kpc-scale X-ray jet in the initial observations of PKS 0637–752 (Schwartz et al., 2000; Chartas et al., 2000) demonstrated that Chandra had opened a new channel of data for the study of extragalactic jets. One of the extreme cases discovered in our survey for X-ray emission from radio-bright quasar jets (Marshall et al., 2005; Gelbord et al., 2005) is the FR II radio source PKS 1055+201 (catalog PKSB1055+201) (Shimmins & Day, 1968). Those authors associated it with the previously discovered 4C20.24 (Pilkington & Scott, 1965). Bolton, Kinman, & Wall (1968) identified the object as a quasar at redshift z=1.11. We proposed Chandra followup observations based on our initial 4.7 ks image (obsid 4889 (catalog ADS/Sa.CXO#obs/04889)) which showed that the X-ray jet followed the 21″ length of the radio jet. At the redshift of the quasar, 1″=8.24 kpc in the plane of the sky111We use a flat, accelerating cosmology, with H0=71 km s-1 Mpc-1, , and .. Since we infer that the jet is in relativistic motion with Doppler factor 6 (Schwartz et al., 2006b), the jet must be at an angle no more than 9° from our line of sight, so that its total deprojected length is of order 1 Mpc.
In this letter we discuss the extended X-ray emission surrounding the prominent radio and X-ray jet and the inferred, invisible counter-jet. The ability to observe both the jet and X-ray tube222We use tube rather than lobe or cocoon to avoid pre-judging the nature of this region. may help constrain such problems as how the energy of a jet is dissipated and the jet decelerated (e.g., Georganopoulos & Kazanas, 2003, 2004; Tavecchio et al., 2006), or how the radio lobes relate to the X-ray jet. Details of the structure of the narrow jet (Schwartz et al., 2006b), and of our HST observations of the system, will be presented elsewhere.
2 IMAGES OF PKS 1055+201
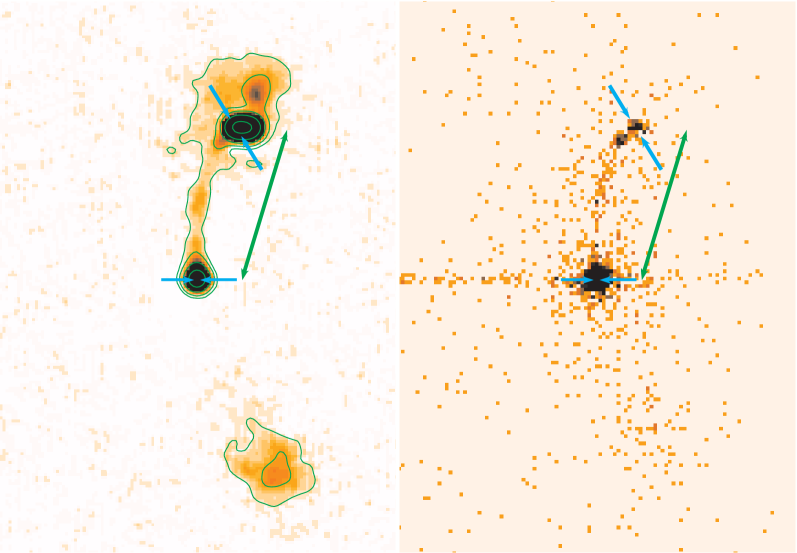
Chandra obsid 5733 (catalog ADS/Sa.CXO#obs/05733) yielded a 31.595 ks live-time observation of PKS 1055+201. Figure 1 presents radio and X-ray images of the system PKS 1055+201. The radio jet to the north closely resembles the X-ray jet up to the terminal X-ray hotspot about 21″ from the quasar. That hotspot is associated with the eastern peak of a bright, resolved radio hotspot. A radio extension to the north of this hotspot is not reproduced in the X-ray image. Both the radio and X-ray jet start out at a position angle within a few degrees of North, close to the VLBA jet direction of -5° reported by Kellerman et al. (2004). They reported superluminal motion with an apparent velocity , for a component 3 mas from the core.
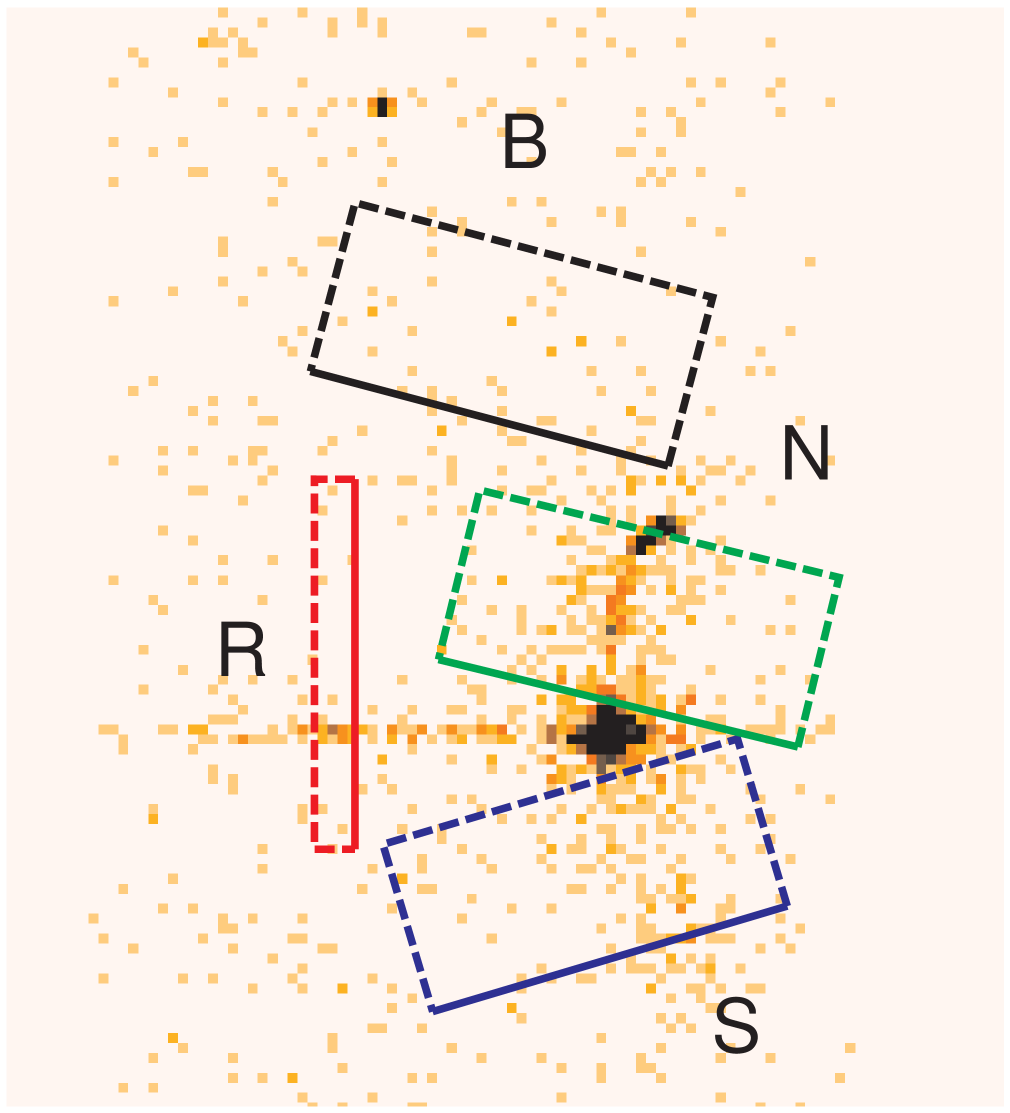
Binning the X-ray data (0.5 to 7 keV) into 1″ bins shows enhanced X-ray emission from a region about 16″ wide and parallel to the radio and X-ray jet to the North (Figure 2). A roughly symmetric region of enhanced X-rays also appears to the south. Its position suggests that it surrounds the unseen counterjet, which powers the southern radio lobe.
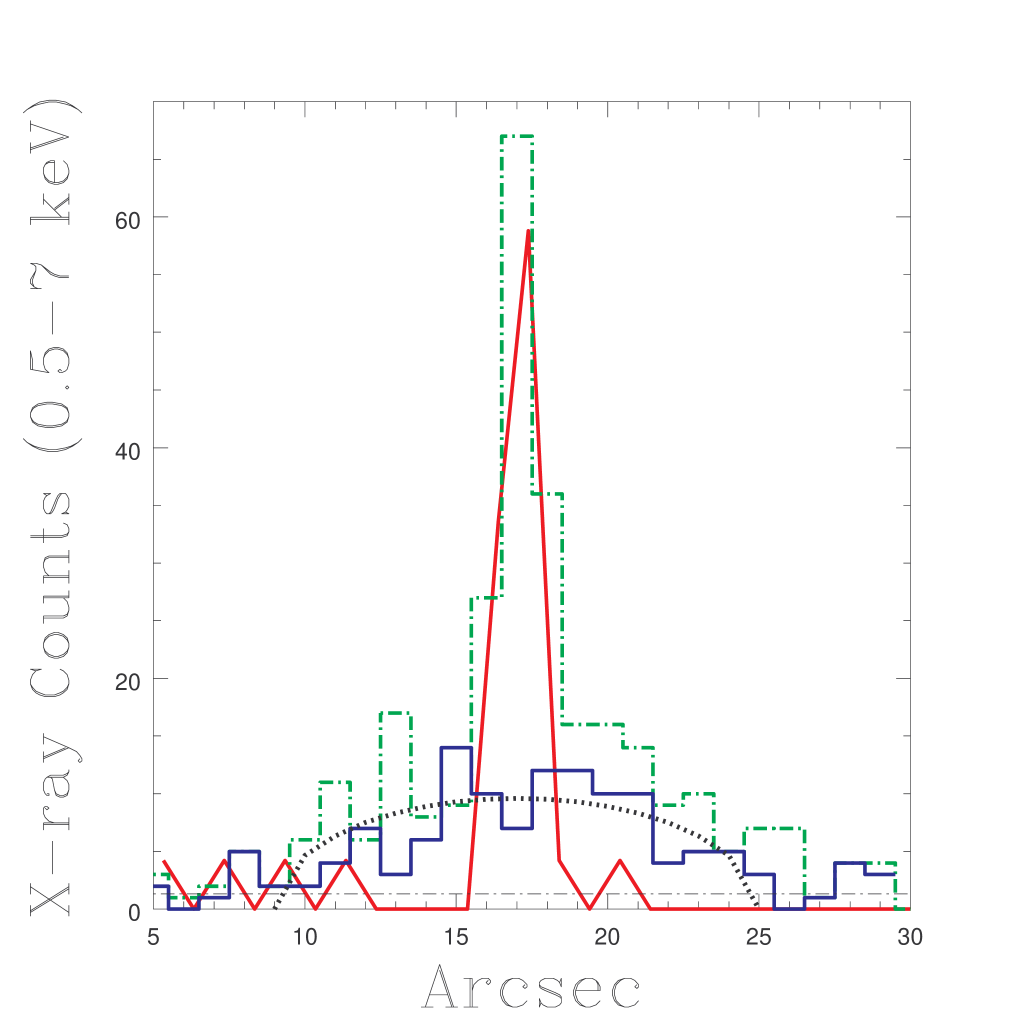
We quantify the extended X-ray emission by considering the profiles in Figure 3. The top panel gives the profiles across the corresponding regions shown in the bottom panel. The X-ray counts are the sum of the data projected into bins 1 arcsec wide along the solid lines in the bottom panel. The abscissae are arbitrarily offset to line up the centroids of the emission in each case. The dashed line gives the background rate expected, 1.31 counts per bin, based on the region marked B. The red line gives the profile across the ACIS readout streak from the bright quasar core. This represents the undersampled profile of an unresolved line source. The actual counts in the streak profile are multiplied by 4.2 to give the number of counts which the narrow jet is expected to contribute to the profile (green histogram) from the North region333Since the jet curves a small amount, its contribution to the profile is slightly broader than the line response function given by the readout streak.. The South region profile is given by the blue histogram. Errors on the tube region profiles are the square root of the number of counts in the bin. The dotted curve is the profile predicted for a uniformly emitting cylinder of diameter 16″.
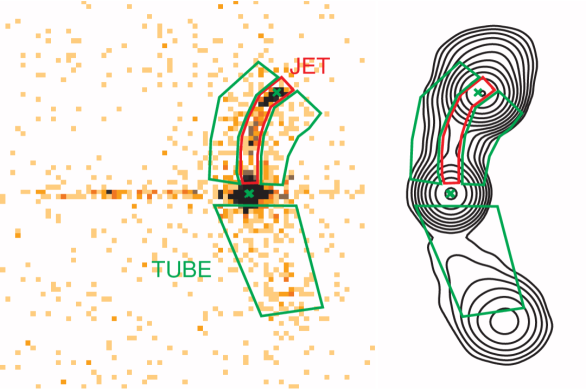
We can make some simple estimates by modeling the extended X-ray brightness as from a uniformly emitting cylinder. We consider the observed energy range 0.5 to 7 keV, and subtract 0.0685 counts arcsec-2 background to derive all the numbers quoted. From the measured counts in the regions outside the jet (green areas in Figure 2) we estimate that 47.5 of the 243.8 background-subtracted counts in the jet region (red area in in Figure 2) are due to projection of the extended tube region in front and behind the jet. We then infer that there are 196.3 14.1 counts intrinsic to the jet, and 175.6 14.0 and 145.2 13.7 counts in the North and South tube regions, respectively. Using the spectral models described in the next section, we estimate rest frame 2–10 keV luminosities of approximately 1.8 1044 ergs s-1 for the jet, and 1.8 1044 ergs s-1 and 1.5 1044 ergs s-1 for the North and South tube regions, respectively.
3 X-RAY SPECTRA
We use XSPEC (Arnaud, 1996) to fit the X-ray spectra of the extended X-ray tube emission and of the jet, where those two regions are defined in Figure 2. In all cases we fix the Galactic absorption to column density Ncm-2 (Stark et al., 1992). We take the energy regions 0.5–5 keV, (since there are few counts between 5 and 7 keV), bin the data into 25 counts or more, and use a goodness of fit estimator. We first fitted the spectrum of the background to a power law. Then we fitted the spectrum of the extended X-ray emission to the sum of the normalized, fixed background fit plus either an absorbed power law, or absorbed thermal (MEKAL) model. Then we fitted the spectrum of the jet to the sum of the normalized, fixed background fit plus the normalized, fixed fit to the extended region for each of the two cases, plus an absorbed power law. We quote 90% confidence error regions for one interesting parameter, either a temperature or power-law photon index, .
The background is fitted by a power-law =0.54 0.23. Background contributes an estimated 12% of the extended-region spectrum, and 2% of the jet-region spectrum. The MEKAL fit to the extended region gives keV with a of 14.05 for 8 degrees of freedom, where we have fixed the abundances at cosmic values. The power-law fit for this region gives with a of 9.4. The power law is clearly a better fit to the extended region, with a probability =0.31, but the thermal fit cannot be rejected since =0.08, and it is interesting to interpret both models. The jet power-law index is 0.33 with of 2.33 for 6 degrees of freedom if the MEKAL fit is assumed for the extended region, and 0.33 with of 2.38 if the power-law fit is assumed. The spectral shape deduced for the jet is not sensitive to the model of the extended region, and we shall consider only the parameters obtained from assuming the power-law fit to the extended emission. Such a fit for the jet region has an =0.88.
The values for the jet and tube regions are consistent at the 90% confidence level. A joint absorbed power-law fit of the extended and jet regions, forcing the photon index to be the same in both, results in an acceptable of 13.81 for 15 degrees of freedom, with =1.920.19, to 90% confidence.
4 DISCUSSION
We model the jet assuming minimum energy conditions between the magnetic field and relativistic particles, with equal electron and proton energy densities. We assume the X-ray emission is inverse Compton (IC) scattering from the cosmic microwave background (CMB), which requires that the jet be relativistically beamed near to our line of sight (Tavecchio et al., 2000; Celotti et al., 2001). Details of these assumptions are the same as in Schwartz et al. (2006a). We derive mean jet parameters (Schwartz et al., 2006b) which are roughly as follows: Magnetic field in the rest frame 10G (1 nT = 10G); electron density in the rest frame (between Lorentz factors from 80 to 105 and with an assumed radio energy index of =0.7); Doppler factor 6; kinetic flux 2 ergs s-1; angle to the line of sight 9°; and deprojected length 1 Mpc when we assume the maximum =9°. These quantities become G, 10, and 4.5 at the terminal X-ray hotspot.
We consider two mechanisms for the extended X-ray emission: thermal bremsstrahlung from gas heated by the jet or IC/CMB from relativistic electrons whose ultimate energy source is from the jet. We consider the total volume, V, of two cylinders, each 16″ = 130 kpc in diameter by 1 Mpc in length, and emitting a total 3.3 ergs s-1 in the rest frame 2–10 keV band. We assume that the cylinder is not moving relativistically with respect to the CMB, since the two sides of the source are of similar length, and that the X-ray emissivity is apparently uniform throughout the cylinder volumes.
If the extended X-ray emission is thermal and uniform, then keV and cm-3. The cooling time would be yr, much longer than the age of the universe at , yr. The total energy would be erg. Assuming that there is a counterjet of similar power, the jets supply a kinetic flux of erg/s, requiring yr to supply the total energy. A duty cycle of 25% seems high but could be reduced if the gas is non-uniform. Then the and could be smaller while maintaining cm-6 in order to produce the observed X- ray luminosity. Alternatively, one might infer that previous outbursts of the jet averaged a kinetic flux which was a factor of several more luminous than the jet we presently observe, or that the present jet has a ratio of proton to electron energy a factor of several higher than the value unity which we assume. The confinement of such a gas is problematical in the absence of a rich cluster medium, for whose presence we have no indication. Nonetheless, we could be observing a system similar to Cyg A (Wilson, Smith & Young, 2006), but tilted closer to our line of sight and substantially larger. Measurement of the rotation measure might test for the presence of a thermal tube, or of a hot cluster medium. If magnetic fields of the order of 0.1 G were present in such an extended medium, we would expect a rotation measure RM 20 (B∥/0.1G).
In the case of non-thermal emission of X-rays from the extended region, the low level of 1.4 GHz radio emission implies that the magnetic field is much lower than 14 G, which is the field which would have the same energy density as the CMB at the redshift z=1.11. With an upper limit of 10mJy for the radio emission, the equipartition field would be about 6 G. We will assume the X-ray emission is IC/CMB from a region not in bulk relativistic motion with respect to the microwave background. Under those conditions, we deduce a density of electrons with Lorentz factor above =80 of 2.2 , comparable to the density within most of the length of the jet. The electron lifetimes are limited by scattering on the CMB, and are of order 108 years for electrons producing inverse Compton radiation at 1 keV, but less than 107 years for the higher energy electrons emitting 1.46 GHz synchrotron radiation.
The non-thermal scenario is consistent with an interpretation wherein the jet is generating X-ray emitting lobes throughout a lifetime of several times 107 years, and these lobes are decelerated to substantially less than the speed of light, while the jet continues to propagate with a large Lorentz factor. To diffuse laterally to the observed radial extent of 65 kpc in the 108 year lifetime of the X-ray emitting electrons implies a transverse velocity of order 600 km s-1. While radio lobes are ubiquitous, and while X-ray emission has been detected from radio lobes (e.g., Croston et al., 2005, and references therein), the present observation of PKS 1055+201 is unique in that both a prominent X-ray jet and a surrounding X-ray tube region are seen, and that the latter does not correlate morphologically with the weak, extended radio emission at 1.46 GHz.
References
- Arnaud (1996) Arnaud, K. A. 1996, in A.S.P. Conference Series, Vol. 101, “Astronomical Data Analysis Software and Systems V”, eds. Jacoby, George H. & Barnes, Jeannette 17
- Bolton, Kinman, & Wall (1968) Bolton, J. G., Kinman, T. D., & Wall, J. V. 1968, ApJ, 154, L105
- Celotti et al. (2001) Celotti, A., Ghisellini, G., & Chiaberge, M. 2001, MNRAS, 321, L1, astro-ph/0008021
- Chartas et al. (2000) Chartas, G., et al. 2000, ApJ, 542, 655, astro-ph/0005227
- Croston et al. (2005) Croston, J. H., Hardcastle, M. J., Harris, D. E., Belsole, E., Birkinshaw, M., & Worrall, D. M. 2005, ApJ, 626, 733, astro-ph/0503203
- Gelbord et al. (2005) Gelbord, J., et al. 2005, in “X-Ray and Radio Connections ”, eds. L.O. Sjouwerman and K.K Dyer, (NRAO: http://www.aoc.nrao.edu/events/xraydio), astro-ph/0411804
- Georganopoulos & Kazanas (2003) Georganopoulos, M. & Kazanas, D. 2003, ApJ, 589, L5
- Georganopoulos & Kazanas (2004) Georganopoulos, M. & Kazanas, D. 2004, ApJ, 604, L81
- Kellerman et al. (2004) Kellerman, K. I., et al. 2004, ApJ, 609, 539
- Marshall et al. (2005) Marshall, H. L., et al. 2005, ApJS, 156, 13
- Pilkington & Scott (1965) Pilkington, J. D. H., & Scott, J. F. 1965, MmRAS, 69, 183
- Schwartz et al. (2000) Schwartz, D. A., et al. 2000,ApJ, 540, L69
- Schwartz et al. (2006a) Schwartz, D. A., et al. 2006a, ApJ, 640, 592
- Schwartz et al. (2006b) Schwartz, D. A. et al. 2006b, in Proc. ”The X-ray Universe 2005”, San Lorenzo de El Escorial, Spain, September 2005, 579
- Shimmins & Day (1968) Shimmins, A. J., & Day, G. A. 1968, Australian Journal of Physics, 21, 377
- Stark et al. (1992) Stark, A. A., et al 1992, ApJS 79. 77
- Tavecchio et al. (2000) Tavecchio, F.,Maraschi, L., Sambruna, R. M., Urry, C. M. 2000, ApJ, 544, L23
- Tavecchio et al. (2006) Tavecchio, F., Maraschi, L., Sambruna, R. M., Gliozzi, M., Cheung, C. C., Wardle, J. F. C., Urry, & C. Megan 2006, ApJ, 641, 732
- Wilson, Smith & Young (2006) Wilson, A. S., Smith, David A., & Young, A. J. 2006, ApJ, 644, L9