Smooth Boundaries to Cosmological HII regions from Galaxy Clustering
Abstract
The HII regions around quasars and galaxies at redshifts beyond the epoch of reionisation will provide prime targets for upcoming 21cm campaigns using a new generation of low-frequency radio observatories. Here we show that the boundaries of these HII regions will not be sharp. Rather, the clustering of sources near massive galaxies results in a neutral fraction that rises gradually towards large radii from an interior value near zero. A neutral fraction corresponding to the global background value is typically reached at a distance of 2–5 times the radius of the HII region around the central massive galaxy.
keywords:
cosmology–theory–quasars–high redshift1 Introduction
The identification of a Gunn-Peterson trough and ionised bubbles in the spectra of quasars at redshifts of – (Fan et al. 2004) hints that the reionisation of cosmic hydrogen was completed only around that time, about a billion years after the big bang (White et al. 2003; Wyithe & Loeb 2004). In the near future, the best probe of the epoch beyond reionisation will be provided by a new generation of low-frequency radio arrays that will image the redshifted 21cm emission from the neutral hydrogen in the intergalactic medium (IGM)111See http://www.haystack.mit.edu/ast/arrays/mwa/site/index.html; http://www.lofar.org/; http://arxiv.org/abs/astro-ph/0502029. The first target for these observations will be provided by the cosmological HII regions generated by massive high redshift galaxies and quasars. These cosmological HII regions are generally modeled with sharp boundaries within an IGM having a global neutral hydrogen fraction. However clustering of small galaxies around massive systems could lead to enhanced ionisation in the IGM immediately surrounding HII regions. In this Letter we estimate this effect. Our approach is to use our earlier model for HII regions around clustered sources (Wyithe & Loeb 2005; hereafter Paper I). Throughout the paper we adopt the set of cosmological parameters determined by WMAP (Spergel et al. 2006) for a flat CDM universe.
2 The Size of Ionised Regions Around Isolated Galaxies
We begin by summarising the features of our model for HII regions around clustered galaxies. Only a brief description is given here, and we direct the reader to Paper I for further details. There are two contributions to the ionising luminosity of a galaxy, which we describe in turn: massive stars and a central supermassive black-hole.
In a neutral IGM the characteristic physical size of a spherical HII region generated by stars in a galaxy with a dark matter halo of mass is given by (Loeb et al. 2005)
| (1) | |||||
where is the fraction of baryons in the halo that are turned into stars, and is the fraction of ionising photons that escape from the galaxy into the surrounding IGM. The number of ionising photons per baryon incorporated into Pop-II stars is (Bromm, Kudritzki & Loeb 2001), and denotes the number of photons required per baryon for the reionisation of the HII region. The value of depends on the number of recombinations and hence on the clumpiness of the IGM. The halo mass is a function of its virial velocity dispersion , which we set equal to , where is the virial circular velocity [see Eqs. (22)–(25) in Barkana & Loeb (2001)].
Similarly, the physical size of the HII region generated by an accreting supermassive black-hole of mass is (White et al., 2003)
| (2) | |||||
where is the production rate of ionising photons during the luminous quasar phase for a black hole of mass , and is the fraction of the halo dynamical time during which the quasar shines at its peak luminosity. The black hole mass is related to the halo velocity dispersion through (Wyithe & Loeb 2003).
3 The Structure of HII Regions Around Clustered Galaxies

Prior to reionisation, isolated galaxies generate their own Strömgren (HII) spheres with characteristic sizes given by equations (1) and (2). However, massive galaxies tend to form in high density environments within which many smaller galaxies are clustered and contribute to the same HII region.
Fixing the center of coordinates to be at the center of largest local galaxy, we may use equations (1) and (2) to find the physical size of the HII region surrounding a galaxy of mass . We obtain
| (3) |
where the radii of the HII regions around the central halo of mass and a galaxy of mass , respectively, are and . Equation (3) determines self-consistently with the mean neutral fraction into which the HII region expands, and accounts for the higher IGM density due to infall around a massive halo through the nonlinear density contrast . The number of galaxies surrounding the central halo is found from the Press-Schechter (1974) mass function of halos with the modification of Sheth & Torman (2002), expressed in units of (physical Mpc).
In the vicinity of a massive halo must be modified relative to the background universe (see Paper I). The critical value of linear overdensity at which the actual collapse of a spherical shell occurs ( for ) depends weakly on the background matter density (Bryan & Norman 1998). The dominant contribution to the modification of the halo mass function originates from the accelerated formation of halos in overdense regions.
In the background universe a spherical top-hat collapses at redshift if its overdensity extrapolated (linearly) to the present day reaches , where the function is the growth factor. In the overdense region surrounding a massive galaxy the growth factor is modified relative to the background universe because of the enhanced matter density. Each spherical shell surrounding the central halo behaves as if it belongs to a universe with a modified value of the density parameter given by its radial expansion rate and the average matter density at the radius of the shell. We use the corresponding value of the growth factor for the value of associated with each shell.
Within the HII region the neutral fraction is close to zero (). Beyond the HII region, the clustering of galaxies may still yield ionisation at a level that is larger than the global average. The structure of ionisation in the IGM prior to reionisation is thought to be like that of a sponge, the neutral IGM being punctuated with HII regions (each with a sharp boundary) of different sizes. An observation at infinite resolution would be able to resolve all these HII regions. However a real instrument will observe this sponge-like structure at finite resolution. Beyond the radius of the HII region we therefore define the local neutral fraction to be the mass fraction of neutral hydrogen averaged within a region that is smaller than the size of the main HII region, but large enough to contain many HII regions around small galaxies. This is the appropriate measure to consider for observations at finite spatial resolution (e.g. redshifted 21cm observations).
At a radius from the central massive galaxy, the neutral hydrogen fraction is
| (4) |
At large , approaches the average mass-function in the Universe, approaches unity, and equation (4) reduces to the average neutral fraction in the IGM (see equation 5). Thus, away from the central HII region the above definition of neutral fraction is equivalent to the mean neutral fraction of the IGM.
4 Model Parameters and the Reionisation History
In order to compute the size and profile of an HII region, we need to specify the star formation efficiency and its dependence on halo mass, as well as the escape fraction of ionising photons from galaxies. As in Paper I, we define four models which bracket the expected range of star formation efficiencies. We then fix the free parameters in these models by requiring that the resulting reionisation history match observational constraints.
4.1 Models for the star formation efficiency
First we describe the four different models for the star formation efficiency that are examined in this paper. We adopt feedback-regulated prescriptions (Dekel & Woo 2002; Wyithe & Loeb 2003) in which the star formation efficiency in a galaxy depends on its velocity dispersion , with for , for , and for . We consider four cases in this paper: (A) ; (B) , ; (C) ; and (D) , . The values of , and , correspond to the threshold for infall of gas from a photo-ionised IGM and the threshold for atomic hydrogen cooling, respectively. The value of is calibrated empirically based on the local sample of galaxies (Kauffmann et al. 2003; Dekel & Woo 2002). Case A is a fiducial model where all galaxies have the same star formation efficiency, and form down to masses corresponding to the hydrogen cooling threshold. This model describes the situation at high redshift where the IGM was not pre-heated, and where feedback does not operate in small galaxies as at low redshift because the dynamical time within galaxies is comparable to the lifetime of massive stars. Cases B-D introduce modifications due to galaxy formation in a heated IGM and to stellar feedback.
4.2 The reionisation history
As described in Paper I, we may constrain the free parameters in each of the four models defined above by requiring that hydrogen be reionised by (Fan et al. 2004), and helium be doubly reionised by (Theuns et al. 2002). The global ionisation fraction of intergalactic hydrogen is
| (5) |
Reionisation histories based on equation (5) for the different star formation prescriptions A-D which were described in the previous section are plotted in Figure 1. Note that these histories (and subsequent results) are independent of which is degenerate with other parameters (e.g. ).
The total optical depth for electron scattering is in case A and in cases B–D. All four models are consistent with the latest measurement of from WMAP (Spergel et al. 2006). The error bars on the WMAP data do not allow us to distinguish between the models.
5 Results
We now examine our results for the effect of clustered sources on the neutral fraction outside the HII regions surrounding massive galaxies (equation 4).
5.1 The neutral fraction outside quasar HII regions
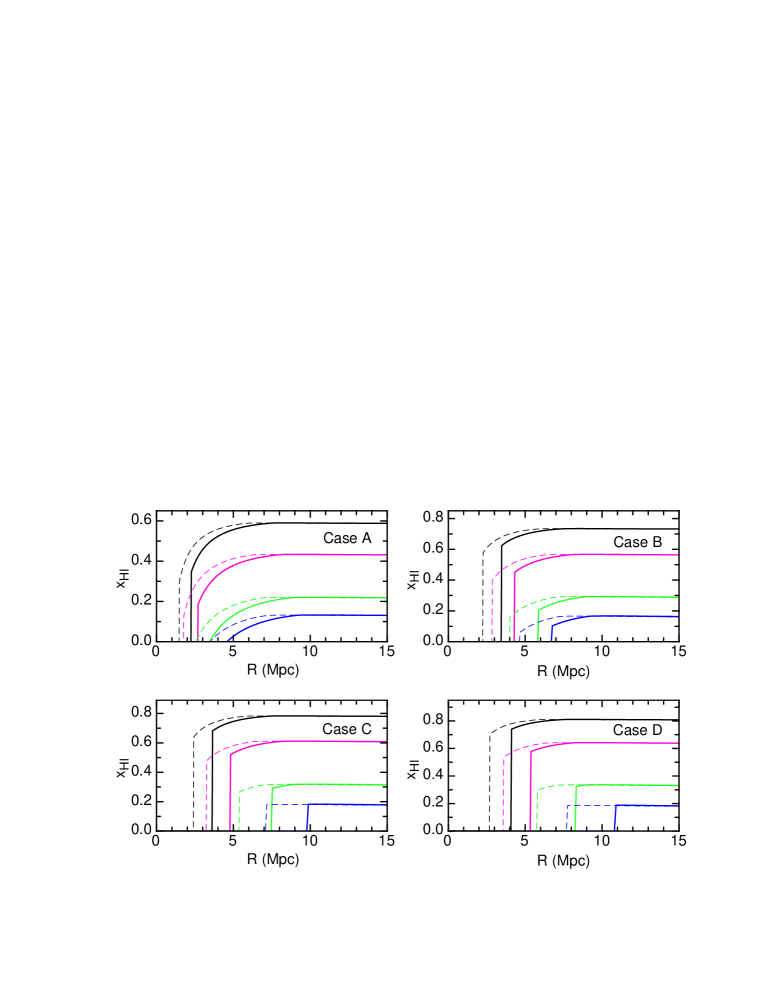
In Figure 2, we plot the neutral fraction as a function of radius around a central quasar. The four panels in Figure 2 refer to cases A-D, and the solid and dashed lines correspond to velocity dispersions of and for the central galaxy, respectively. In each case the four sets of curves correspond to redshifts of , 6.9, 6.3 and 6.1 (top to bottom). These calculations of are self-consistent with the average neutral fraction of the IGM, which is obtained from the reionisation histories (equation 5). The figure shows that the edges of HII regions are not expected to be sharp, particularly when the neutral fraction is of order unity. Indeed, in such cases the neutral fraction rises gradually beyond , and reaches the global value only at radii that are 2–5 times .
Figure 2 shows that the detailed profile of the neutral fraction with radius depends on the value of the global neutral fraction. In all cases the global neutral fraction is reached at a radius Mpc. However galaxies produce larger HII regions within a more ionised IGM. As a result, the boundary of the HII region is spread over a larger range of radii (relative to ) in cases where the global neutral fraction is higher. The profile is also sensitive to the assumed case of star formation. In particular, consider star-formation scenarios where there is only a small contribution to the ionising photon production from galaxies with km/s. The boundary is less extended in such cases, particularly where the HII region forms within an IGM that is already significantly reionised. On the other hand, for large global neutral fractions the curves corresponding to the four models are similar. This is simply because the parameters in these models have been tuned to provide hydrogen reionisation at . By pinning the models to the same redshift of reionisation, we draw the robust conclusion that HII regions around high redshift quasars within a substantially neutral IGM should not have sharp edges, but rather the neutral fraction in the IGM will gradually reach the global value.
We note that the effect on the ionisation fraction is significant relative to the background level of ionisation on scales as large as 30 comoving Mpc. Although the overdensity on this scale is mild, , it nevertheless biases the abundances of galaxies, particularly those on the exponential tail of the mass function, to form earlier (Barkana & Loeb 2004). This early formation produces an ionisation level that is significantly larger than that of the background. The magnitude of the effect we calculate agrees with expectations for the clustering of galaxies (Scannapieco & Barkana 2002). For example, given a halo mass of (that is a factor smaller than a central galaxy with km/s at ), we find the cross-correlation length with the central halo to be physical Mpc. This length represents density enhancements of order unity and is naturally smaller than the –Mpc where enhanced ionisation is seen outside the HII region. However we find a 50% enhancement in the density of halos at Mpc (physical scale) relative to a random distribution, and a 10% enhancement at Mpc. For a central galaxy with km/s, we find a correlation length of Mpc, with an enhancement of 50% at a distance of Mpc and of 10% at Mpc. These enhancements can naturally account for the 10–30% increase in the ionisation level at these radii.
5.2 The neutral fraction outside galaxy HII regions
In Paper I we demonstrated that quasars do not generally dominate the contribution to ionisation within an HII region around clustered galaxies. Therefore even in the absence of quasar activity we would expect a large HII region surrounding a massive galaxy. Clustering of galaxies around a central massive galaxy should also lead to a gradual boundary of the HII region as is the case for a central quasar.
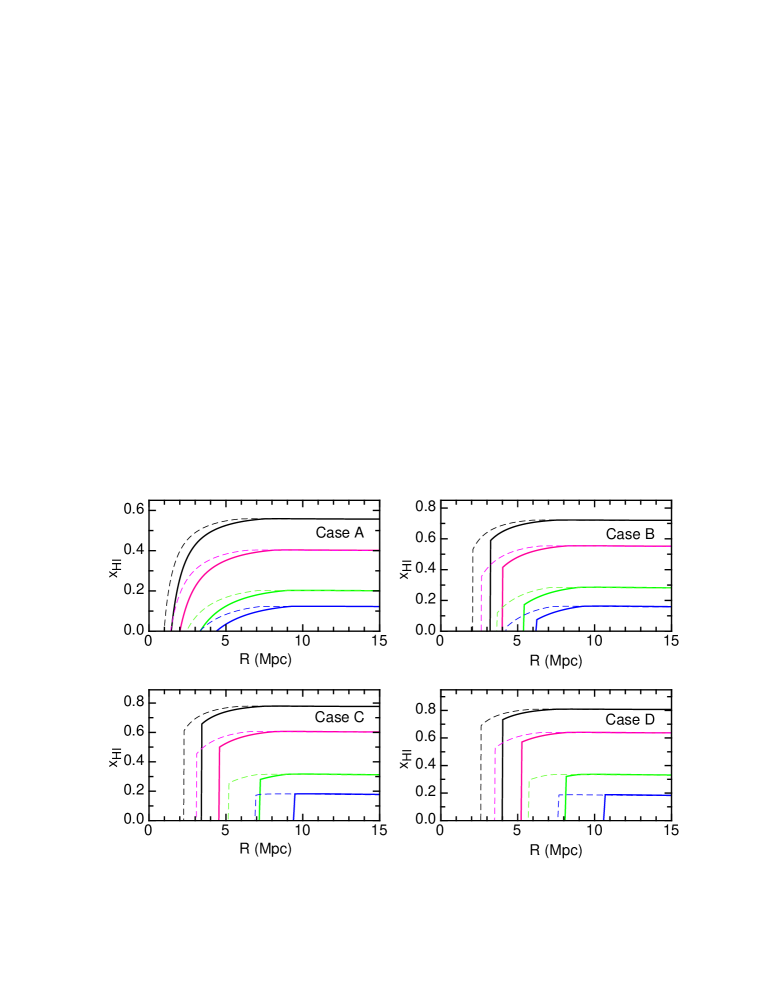
We therefore repeat the calculations of the previous section in the case where quasar activity is ignored (both in the central galaxy, and surrounding galaxies), by replacing and , with and in equations (3)-(5). The results are shown in Figure 3. We find profiles that are qualitatively consistent with those shown in Figure 2. The quantitative difference is that HII regions around massive galaxies are smaller in the absence of quasars. As before, the neutral fraction rises gradually beyond , and reaches the global value only at radii that are 2–5 times .
6 Summary
Our calculations suggest that observations of cosmological HII regions will not see sharp boundaries, but rather a gradual rise in the average local neutral fraction from the radius of the HII region out to a distance – times greater. This gradual rise in neutral fraction is produced by the clustering of sources around the massive systems at the centers of cosmological HII regions. The gradual rise is seen in our models for HII regions surrounding high redshift quasars, as well as massive galaxies in the absence of quasar activity. The gradual nature of the HII region boundary is most prominent in star formation scenarios that do not include strong feedback in low mass galaxies.
Our Letter only considered the softening of the HII region boundary by galaxy clustering. Additional softening of the boundary could be produced near quasars that emit significant energy in X-ray photons, whose mean-free-path is much longer than UV photons. For an unobscured quasar the spectrum averaged mean-free-path is much smaller than the size of the HII region. As a result, the high energy photons smooth the edge of the HII region over a length much smaller than its radius. Along directions where the UV emission is obscured but the X-rays are not, the shape of the HII boundary might be dominated by the quasar spectrum and not the clustering of galaxies as discussed here.
We have assumed spherical symmetry in our model. However, in reality massive galaxies and quasars will lie at the intersections of filaments along which mass is funneled into them. The shape of the HII region and the level to which the boundary is gradual, will vary along different directions. Numerical simulations are needed to explore this anisotropy. Nevertheless, the first observations of HII regions at redshifted 21cm wavelengths will be made at a resolution comparable to the size of the HII region in both transverse and line-of-sight directions (Wyithe, Barnes & Loeb 2005). This coarse resolution will tend to smooth the neutral distribution in spherical shells as assumed in our analysis.
The first generation of low-frequency arrays will likely detect HII regions via matched filter techniques. In the case of HII regions also observed through Ly absorption, the clustering of sources results in a ”characteristic size” of an HII region (as measured assuming a sharp boundary) that is 1.5 to 2 times greater than the value measured via Ly absorption. Searches for HII regions using redshifted 21cm observations around known quasars should therefore use a filter that accounts for the gradual profile of the HII region boundary.
The detection of the distribution of HII region sizes, together with the power-spectrum of 21cm emission will provide a detailed picture of the topology of the reionisation epoch (Furlanetto et al. 2004). We have demonstrated that there is a need to define the size of an HII region in a resolution dependent way. In particular, finite resolution observations (for example using low-frequency radio telescopes to detect redshifted 21cm radiation) will not detect sharp boundaries around large HII regions. Rather, confusion of many small, clustered and unresolved HII regions, will blur the observed boundary of the HII regions around massive galaxies and quasars, and potentially increase their inferred HII volumes by an order of magnitude.
Acknowledgments The research was supported by the Australian Research Council (JSBW) and NASA grants NAG 5-1329 and NNG05GH54G (AL).
References
- (1) Barkana, R., Loeb, A., 2001, Phys. Rep., 349, 125
- (2) Barkana, R., & Loeb, A. 2004, ApJ, 609, 474
- (3) Bromm, V., Kudritzki, R., Loeb, A., 2001, ApJ. 522, 464
- Bryan & Norman (1998) Bryan, G. L., & Norman, M. L. 1998, ApJ, 495, 80
- (5) Dekel, A., Woo, J., 2002, MNRAS, 344, 1131
- (6) Fan, X., et al. 2006, astro-ph/0512082
- (7) Furlanetto, S., Zaldarriaga, M., Hernquist, L., 2004, ApJ, 612, 16
- (8) Kauffman, G., et al., 2003, MNRAS, 341, 54
- (9) Loeb, A., Barkana, R., Hernquist, L., 2005, ApJ, 620, 553
- (10) Press, W., Schechter, P., 1974, ApJ., 187, 425
- (11) Scannapieco, E., Barkana, R., 2002, ApJ, 571, 585
- (12) Sheth, R., Torman, G., 2002, MNRAS, 321, 61
- (13) Spergel et al., 2006, astro-ph/0603449
- (14) Theuns, T., Schaye, J., Zaroubi, S., Kim, T.S., Tzanavaris, P., Carswell, B., 2002, ApJ., 567, L103
- (15) White, R., Becker, R., Fan, X., Strauss, M., 2003, Astron J., 126, 1
- Wyithe et al. (2005) Wyithe, J. S. B., Loeb, A., & Barnes, D. G. 2005, ApJ, 634, 715
- (17) Wyithe, J.S.B, Loeb, A., 2003, ApJ, 595, 614
- (18) ——————————–. 2004, Nature, 427, 815
- (19) ——————————–. 2005, ApJ, 625, 1 (Paper I)