Detection of a Variable Infrared Excess Around SDSS 121209.31+013627.711affiliation: Based on observations obtained with the 2.5 m DuPont telescope and the 6.5 m Magellan Telescopes at Las Campanas Observatory, which is operated by the Carnegie Institution of Washington.
Abstract
We present near-infrared photometry and light curves of the candidate magnetic white dwarf+brown dwarf binary SDSS J121209.31+013627.7 and report on the detection of near-infrared excess and variability in the band. The observed near-infrared excess can be explained by the presence of an L7 brown dwarf and an extra emission source. The and light curves appear flat, which rules out eclipses deeper than 0.2 mag and the presence of an accretion hot spot on the white dwarf. From the variable lightcurve, we get a refined period for the system of 881 minutes. We show that the observed variability in band can be explained by cyclotron emission, which can be modeled by a small spot on the surface of the white dwarf. SDSS 1212 exhibits similarities to the ultra-short period polar EF Eridani, however the lack of evidence for Roche-lobe overflow accretion suggests it may be a pre-polar.
1 Introduction
SDSS J121209.31+013627.7 (hereafter SDSS 1212) was first reported by Schmidt et al. (2003) as a magnetic white dwarf with an equivalent dipolar magnetic field of = 13 MG. Recently, Schmidt et al. (2005) published a new study suggesting that SDSS 1212 is a white dwarf/probable brown dwarf binary. Their follow-up spectroscopy revealed the presence of a narrow H emission line with a semi-amplitude radial velocity variation of km and an orbital period of minutes, indicating the presence of a nearby irradiated companion. The H emission disappeared when the companion faced the white dwarf, suggesting a high inclination orbit. From the Zeeman splitting of hydrogen absorption lines in the photosphere, Schmidt et al. (2005) measured a mean magnetic surface field of 7 MG. Their band photometry yielded mag, placing an upper limit on the mass of the companion and thus suggesting the brown dwarf scenario.
In this , we present near-infrared observations of SDSS 1212, aimed at detecting the brown dwarf companion and determining the presence or absence of eclipses of the white dwarf.
2 Observations and Data Analysis
We observed SDSS 1212 in over five nights, 2006 February 15 and 17 UT, with the WIRC camera on the 2.5 m DuPont telescope and from 2006 June 4 to June 7 UT with the PANIC camera on the 6.5 m Baade Telescope at Las Campanas Observatory, Chile. The near-infrared filter set at Las Campanas (LCO system) is described by Persson et al. (1998).
With WIRC, we observed SDSS 1212 with 1 minute sampling in all three filters, observing in for 84 minutes and for 15 minutes. The second night we observed in and for 80 minutes and in for 15 minutes. Our PANIC observations sampled SDSS 1212 every 30 s for all three filters, with observations spanning 120 minutes for each filter. Typical seeing over the five nights ranged from 06 to 13. We used a five point dither pattern for each data set.
The images were processed using standard IRAF111IRAF is distributed by the National Optical Astronomy Observatories, which are operated by the Association of Universities for Research in Astronomy, Inc., under cooperative agreement with the NSF. routines or equivalent IDL programs. Each frame was flat-fielded, background subtracted, and bad-pixel corrected. We then performed simultaneous differential aperture photometry on each image of SDSS 1212 and comparison stars in the field. All of the comparisons behaved similarly, showing no individual photometric variation trends over the time span of the observations. We derived differential magnitude light curves for each comparison using aperture sizes that were approximately equal to the width of the seeing and averaged them to obtain the final light curves.
We used six comparison stars in the images. The 2MASS222The Two Micron All Sky Survey (2MASS Cutri et al., 2003; Skrutskie et al., 2006) is a joint project of the University of Massachusetts and the Infrared Processing and Analysis Center/California Institute of Technology, funded by the National Aeronautics and Space Administration and the National Science Foundation. apparent magnitudes of those stars are summarized in Table 1. Our dithering pattern precluded all six stars from being present in every frame. The PANIC data had three of the comparison stars, due to its smaller field of view. For each night we took two bright comparison stars in the field to calculate the absolute photometry of SDSS 1212, based on their 2MASS photometry. The final photometry is presented in Table 2. Transforming the comparison star 2MASS photometry into the LCO system gives values that are the same within the photometric errors (Carpenter, 2001).
3 Results
3.1 Light Curves
The light curves of SDSS 1212 were folded using the ephemeris equation
| (1) |
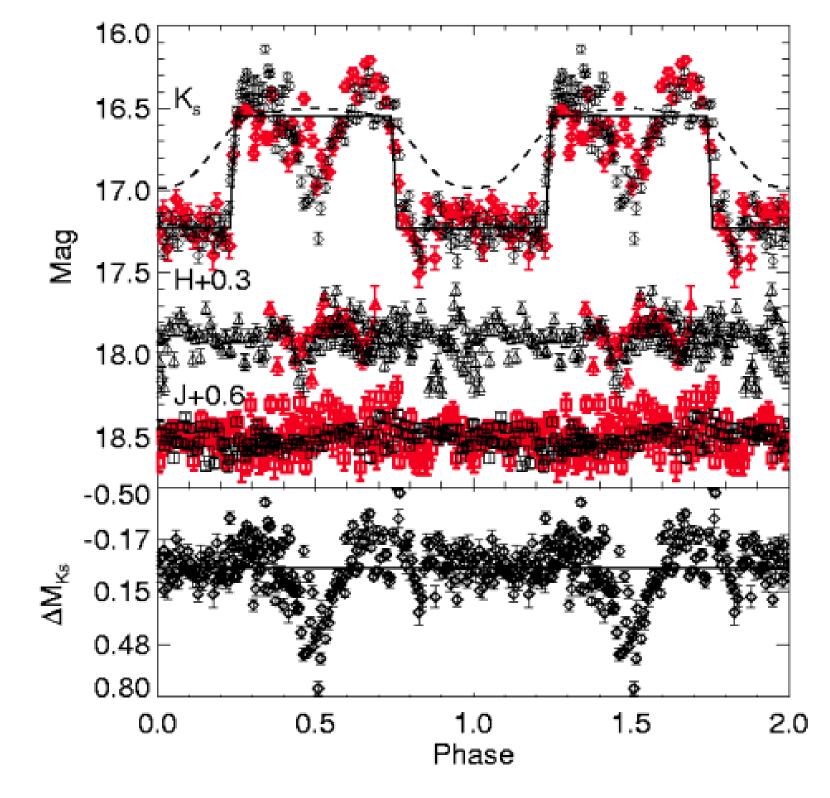
where we have adopted the orbital period of 0.0610.001 days derived by finding a period that minimized the phased point-to-point variations in our lightcurves (Lafler & Kinman, 1965). We have chosen the mid-point of the magnitude dip observed in band (see below) as phase 0. The phased light curves from all nights are shown in Figure 1.
The and light curves appear featureless up to the one standard deviation precision level of our photometry ( 0.07 mags for and ), which precludes eclipses deeper than 0.2 mag. However, there is a marginally detected dip in the curve at a phase of 0.5 which appears in both nights of data. The emission of SDSS 1212 in band is dominated by the white dwarf, therefore, if eclipses were present, one would clearly observe the primary eclipse (occultation of the white dwarf by the companion), but the eclipse of the secondary would still be undetectable. A white dwarf with a typical radius in an edge-on ( = 90 deg) configuration with a brown dwarf would produce a 5 min eclipse of the white dwarf. Using the most recent version of the Wilson-Devinney program (WD2003, Wilson & Devinney, 1971; Wilson, 1979), we generated model light curves for a range of inclinations and radii of the secondary, keeping the white dwarf radius and the orbital separation fixed, and compared the results to the light curve in band to conclude that the inclination of the system is constrained to deg.
The band light curve is marked by a flat dip which lasts for 41 minutes. That dip is followed by a brightening of the system by 0.7 mag, with a second dip at a phase of 0.5.
The light curve variations of SDSS 1212 in band are reminiscent of those detected in the ultrashort period ( minutes) polar EF Eri by Harrison et al. (2003). Those variations were initially attributed to a cool irradiated companion with the side facing the white dwarf at a higher temperature. However, that interpretation was refuted in Harrison et al. (2004) after they failed to detect phase-dependent spectral line changes that an irradiated companion would produce in the infrared spectrum of the system. They concluded that cyclotron emission is responsible for the photometric variability observed in EF Eri. In addition, the band light curve of EF Eri presents a 0.5 mag sinusoidal variation that has been attributed to a bright spot on the white dwarf. As of 10 March 2006, EF Eri returned to its high state (Howell et al., 2006).
However, the SDSS 1212 light curves differ from those of EF Eri. There is no sign of sinusoidal variation in band, which indicates the absence of an accretion spot on the white dwarf. The band light curves show a sharp drop in magnitude followed by the flat dip, unlike the sinusoidal changes observed in EF Eri. This suggests that, whatever the source of the extra emission in band is, it originates in a more localized region that is being obscured during the dimmer phases.
3.2 Infrared Excess
Given that the band light curve is flat, we derived an apparent magnitude of by averaging over all phases. Similarly, there appears to be no significant variability in the band, and we measure mag. In band we derived two values for the total flux. The first value, mag, corresponds to the average magnitude of the system between phases ( ), where we are detecting emission from the white dwarf, its companion, and any additional radiation present in the system. The second value, mag, was computed as the average magnitude between phases and ( ) which corresponds to the white dwarf and the companion being visible.
The resultant spectral energy distribution (SED) of SDSS 1212 is shown in Figure 2. The diamonds correspond to the average flux of the system in the Sloan Digital Sky Survey (SDSS) bands (Fukugita et al., 1996) and the , , and photometry in , when SDSS 1212 is dimmer. The open square represents the average flux of the system during the brighter phase of .
The flux of SDSS 1212 from the optical to is reproduced by a blackbody model of a single white dwarf with an effective temperature of about 10,000 K (see solid line in Figure 2), in agreement with the conclusion reached by Schmidt et al. (2005). Our and band data, on the other hand, clearly show infrared excess in each one of the stages considered above. Therefore, we conclude that there is a substellar companion, most likely of middle to late L spectral type and with T K. The amount of infrared excess can be determined in each case by subtracting the predicted white dwarf flux at each wavelength band. The main uncertainty in this procedure is the poorly known temperature of the white dwarf. To estimate the flux of the white dwarf we use a K (Schmidt et al., 2005). We estimate the formal error introduced into the measurement of the excess by taking the differences in predicted flux at and scaling them to the measured flux of the system at . In , there is no significant excess, so we take a 3 upper limit, where we calculate . The resultant apparent magnitudes of the near-IR excess are J, =19.20.2, and =16.90.1, for , and 18.20.3 for .
In order to determine whether the excess in is consistent with flux solely coming from the white dwarf’s companion, we compare the apparent magnitudes of the excess to the mean absolute magnitudes of field brown dwarfs with measured parallaxes (Vrba et al., 2004). Assuming a distance to SDSS 1212 of 145 pc results in an excess with absolute magnitudes in , and of 13.8, 13.40.2, and 12.40.3 respectively. These absolute magnitudes match with a spectral type of L7. SDSS 1212’s distance is uncertain by 14% and is based on theoretical modeling of the white dwarf’s atmosphere. This uncertainty translates an error of 1 spectral type. Figure 2 shows a comparison of the observed SDSS 1212 photometry (diamonds) and the combination of the expected WD fluxes and those from an L7 brown dwarf (dashed line). By definition, the model doesn’t fit the observed photometry in the -band since we are assuming a 3 upper limit.
4 Discussion
There are two possible explanations for the SDSS 1212 lightcurve: (1) the excess emission is due to a hotter irradiated side of the companion, or (2) the excess is produced by a separate mechanism, such as cyclotron emission.
In the case of irradiation, the SDSS 1212 system would appear brighter during the phases when the hot side of the companion is facing towards us, with its brightness dropping once per orbit as the hot side of the companion faces away from us. The difference in flux between and is approximately a factor of 1.5. Assuming flux from two pure blackbodies, one would expect the temperature ratio between the hot and the cool sides of the companion to account for this difference to be .
We attempted to model the , and band light curves of SDSS 1212 with WD2003 adopting various irradiation scenarios with effective temperatures of the secondary down to 600K and assuming that the secondary co-rotates with the white dwarf in its orbit. The values of the orbital period and initial epoch of the light curves were adopted from equation 1. We assumed a mass of , a radius of and a of 10,000K for the white dwarf. The mass of the companion was set to , and the radius to the size of its Roche lobe, although there is no sign of undergoing accretion, as reported by Schmidt et al. (2005). The values used for the albedos and the limb darkening and gravity brightening coefficients are the same as those adopted by Harrison et al. (2003) in their irradiation models of EF Eri. The model providing the closest resemblance to the light curves corresponds to a = 1000K brown dwarf with a 1400K irradiated side. That model is represented by the dashed line in Figure 1. Clearly, irradiation alone cannot reproduce the observed light curves, since the irradiation curves produce a smooth rounded drop in flux which does not match the sharpness and the depth of the drop.
In the second scenario, cyclotron emission associated with the magnetic pole region of the white dwarf causes excess flux in . Other magnetic white dwarf binaries, such as EF Eri, exhibit strong cyclotron features even in the absence of accretion features (Harrison et al., 2004). We postulate that the majority of the cyclotron emission is confined to a spot near the magnetic pole of the white dwarf and is obscured by the white dwarf when it rotates out of view. Given a total excess above the white dwarf and its companion of 0.08 mJy, the cyclotron emission would have an approximate luminosity of ergs s-1. This is a lower limit on the total luminosity caused by accretion of a wind from the companion and the inferred mass accretion rate would be 4M⊙ yr-1, assuming a white dwarf mass of 0.6M⊙, and a white dwarf radius of 0.01 R⊙. Assuming a magnetic field strength of 13 MG, the cyclotron emission observed at the wavelength of 2.06 µm corresponds to a harmonic number of 4. Cyclotron emission should be present at 4.1 and 8.2 µm accessible in Spitzer’s IRAC channels 2 and 4.
We have generated a simple geometric model of a spot on the white dwarf to model the observed light curve. Our model includes the sum of the band white dwarf+companion flux plus the flux from the spot as a function of spin phase. We assume that the spot is not affected by limb darkening relative to the disk of the white dwarf. The radius of the spot, the flux ratio of the spot to the white dwarf+companion, and the latitude of the spot’s position are free parameters. The results are mostly insensitive to spot radius or latitude assuming that the spot is close to the equator and the spot radius is 10% of the white dwarf radius. We assume a flux ratio of spot to white dwarf of 1.5, which is derived from the difference in flux due to the dip compared to that expected from the white dwarf alone. The solid line in Figure 1 shows our results for a model with a spot of radius 0.03 RWD, located at the equator. The bottom diagram shows the residuals from this model. Some structure still remains visible in those residuals, e.g. the dip around phase 0.5, which could be caused by beaming of the cyclotron emission, self-shielding of the cyclotron emission column that presents less surface area as it points towards Earth, or an eclipse of the emission region by the companion. Overall, our simplistic cyclotron emission model provides a good first order approximation to the light curve.
5 Conclusions
We report the detection of the brown dwarf companion to the magnetic white dwarf SDSS 121209.31+013627.7, whose presence was inferred by the detection of a variable emission line by Schmidt et al. (2005). We provide a more accurate period for the system of 0.0610.001 days. No eclipses are apparent, however our data constrain the inclination of the system to deg. We are only able to place an upper limit of L7 to the spectral type of the companion, given that the band photometry appears to be contaminated by an additional source. We propose cyclotron radiation as the most likely cause of the extra emission, although our hypothesis requires phase-resolved infrared spectroscopy to be confirmed. Spectroscopy will reveal the presence or absence of cyclotron radiation peaks and determine the spectral type of the companion. It is possible that high-precision and -band photometry may reveal a shallow eclipse or other subtle structure in the light curves. SDSS 1212 shows no evidence of ongoing accretion from Roche-lobe overflow, and may differ from similar objects, like EF Eri, by being a pre-polar system (Schmidt et al., 2005).
Finally, high resolution optical spectra of SDSS 1212 will better measure the radial velocity variations of the Hα line and link the variations with those observed in . Measuring the radial velocity of the white dwarf through its hydrogen lines will be difficult given the high probability that changes in the projected mean field strength will erase any signature from the companion. High resolution spectroscopy will also provide a direct measure of any material that is accreted onto the white dwarf evidenced by the presence of weak metal lines. Magnetic white dwarf binaries can efficiently capture the stellar wind of their companions and radiate the accretion energy entirely in cyclotron emission (Schmidt et al., 2005; Webbink & Wickramasinghe, 2005). Metal lines in DAZ white dwarfs have proved useful for measuring low levels of mass accretion onto isolated white dwarfs and white dwarfs with close companions and would provide an independent measure of the material accreted by the white dwarf. (Holberg et al., 1997; Koester et al., 1997; Zuckerman et al., 2003; Debes, 2006).
References
- Carpenter (2001) Carpenter, J. M. 2001, AJ, 121, 2851
- Cutri et al. (2003) Cutri, R. M., Skrutskie, M. F., van Dyk, S., et al. 2003, 2MASS All Sky Catalog of point sources. (The IRSA 2MASS All-Sky Point Source Catalog, NASA/IPAC Infrared Science Archive. http://irsa.ipac.caltech.edu/applications/Gator/)
- Debes (2006) Debes, J. 2006, ApJ, submitted
- Fukugita et al. (1996) Fukugita, M., Ichikawa, T., Gunn, J. E., et al. 1996, AJ, 111, 1748
- Harrison et al. (2003) Harrison, T. E., Howell, S. B., Huber, M. E., Osborne, H. L., Holtzman, J. A., Cash, J. L., & Gelino, D. M. 2003, AJ, 125, 2609
- Harrison et al. (2004) Harrison, T. E., Howell, S. B., Szkody, P., Homeier, D., Johnson, J. J., & Osborne, H. L. 2004, ApJ, 614, 947
- Holberg et al. (1997) Holberg, J. B., Barstow, M. A., & Green, E. M. 1997, ApJ, 474, L127+
- Howell et al. (2006) Howell, S. B., Walter, F. M., Harrison, T. E., Huber, M. E., Becker, R. H., & White, R. L. 2006, ApJ, submitted
- Koester et al. (1997) Koester, D., Provencal, J., & Shipman, H. L. 1997, A&A, 320, L57
- Lafler & Kinman (1965) Lafler, J., & Kinman, T. D. 1965, ApJS, 11, 216
- Persson et al. (1998) Persson, S. E., Murphy, D. C., Krzeminski, W., Roth, M., & Rieke, M. J. 1998, AJ, 116, 2475
- Schmidt et al. (2003) Schmidt, G. D., Harris, H. C., Liebert, J., et al. 2003, ApJ, 595, 1101
- Schmidt et al. (2005) Schmidt, G. D., Szkody, P., Silvestri, N. M., et al. 2005, ApJ, 630, L173
- Schmidt et al. (2005) Schmidt, G. D., et al. 2005, ApJ, 630, 1037
- Skrutskie et al. (2006) Skrutskie, M. F., Cutri, R. M., Stiening, R., et al. 2006, AJ, 131, 1163
- Vrba et al. (2004) Vrba, F. J., Henden, A. A., Luginbuhl, C. B., et al. 2004, AJ, 127, 2948
- Webbink & Wickramasinghe (2005) Webbink, R. F., & Wickramasinghe, D. T. 2005, ASP Conf. Ser. 330: The Astrophysics of Cataclysmic Variables and Related Objects , 330, 137
- Wilson (1979) Wilson, R. E. 1979, ApJ, 234, 1054
- Wilson & Devinney (1971) Wilson, R. E. & Devinney, E. J. 1971, ApJ, 166, 605
- Zuckerman et al. (2003) Zuckerman, B., Koester, D., Reid, I. N., & Hünsch, M. 2003, ApJ, 596, 477
| Name | J | H | Ks |
|---|---|---|---|
| (mag) | (mag) | (mag) | |
| 2MASS 121209890135259 | 16.230.12 | 15.890.17 | 15.54 |
| 2MASS 121205820135157 | 15.610.08 | 14.990.07 | 14.95 |
| 2MASS 121204080135365 | 15.650.07 | 15.050.06 | 14.78 |
| 2MASS 121216580137042 | 14.950.04 | 14.290.04 | 14.14 |
| 2MASS 121216670135257 | 14.450.03 | 13.860.02 | 13.80 |
| SDSS J121205.54013720.2 | – | – | – |
| HJD | Magnitude | Uncertainty | Band |
|---|---|---|---|
| 2453781.82495 | 17.889 | 0.041 | J |
| 2453781.82568 | 17.956 | 0.041 | J |
| 2453781.82642 | 17.877 | 0.041 | J |
Note. — Table 2 is available in its entirety in the electronic version of the Journal. A portion is shown here for guidance regarding its form and content.