Accretion models of Sgr A*
Abstract
The supermassive black hole in the center of our Galaxy, Sgr A*, is unique because the angular size of the black hole is the largest in the sky thus providing detailed boundary conditions on, and much less freedom for, accretion flow models. In this paper I review advection-dominated accretion flow (ADAF; another name is radiatively inefficient accretion flow) models for Sgr A*. This includes the developments and dynamics of ADAFs, and how to explain observational results including the multi-waveband spectrum, radio polarization, IR and X-ray flares, and the size measurements at radio wavebands.
1 Introduction
The center of our Galaxy provides the best evidence to date for a massive black hole (e.g., Schödel et al. 2002; Ghez et al. 2003), associated with the compact radio source, Sgr A* (see, e.g., Melia & Falcke 2001). Since the original discovery of Sgr A* in 1974, there have been intensive efforts in both observational and theoretical aspects, with dramatic progresses in the past few years. The reason why we are so interested in this object is because of its proximity, which allows us to determine observationally the dynamics of gas quite close to the BH, providing unique constraints on theoretical models of accretion flows.
Before introducing the model, I first briefly review the main observational results of Sgr A*. As shown by the data points in Fig. 2, its radio spectrum consists of two components. The component below 86 GHz has a spectrum , while the high frequency component, the “submm bump”, has a spectrum up to GHz (e.g., Falcke et al. 1998; Zhao et al. 2003). Variability at centimeter and millimeter wavelength are detected with a timescale ranging from hours to years with amplitude of less than 100% (Zhao et al. 2003, 2004; Herrnstein et al. 2004; Miyazaki et al. 2004). High level of variable linear polarization fraction () at frequencies higher than GHz puts a rotation measure upper limit of , which argues for a low density at the innermost region of ADAF (e.g., Aitken et al. 2000; Bower et al. 2003; Marrone et al. 2006; Macquart et al. 2006; Quataert & Gruzinov 2000).
At IR wavelength, the source is highly variable. Genzel et al. (2003) detected Sgr A* at 1.6-3.8 m, with a factor of variability on timescales of min. Similarly, at 3.8 m, Ghez et al. (2004) found that the flux changes by a factor of 4 over a week, and a factor of 2 in just 40 min. If describing the IR spectrum with a power-law, Gillessen et al. (2006) found that the spectral index is correlated with the instantaneous flux but Hornstein et al. (2006) found it remains constant during the flare process.
Sgr A* has been convincingly detected in the X-rays (Baganoff et al. 2001, 2003; Goldwurm et al. 2003). The X-ray emission has two distinct components. In “quiescence,” the emission is soft and relatively steady, with a large fraction of the X-ray flux coming from an extended region with a diameter (Baganoff et al. 2001, 2003). Several times a day, however, Sgr A* has X-ray “flares” in which the X-ray luminosity increases by a factor of a few – 50 for roughly an hour. For the most flares, the spectrum is hard, with a photon index of . XMM, however, detected a very bright and soft flare with (Porquet et al. 2003). Recent several multiwavelength campaigns found that there is no time lag between the IR and X-ray flares (Eckart et al. 2004, 2005; Yusef-Zadeh et al. 2006). This strongly suggests a common physical origin. The short timescale argues that the emission arises quite close to the BH, within (where is the Schwarzschild radius). Sgr A* is extremely dim overall, with a bolometric luminosity of only .
2 Accretion flow models: from ADAF to RIAF
Consider a steady axisymmetric accretion flow. The dynamics of the flow are described by the following height-integrated differential equations, which express the conservation of mass, radial momentum, angular momentum, and the energy of electrons and ions (e.g., Narayan, Mahadevan & Quataert 1998):
| (1) |
| (2) |
| (3) |
| (4) |
| (5) |
The quantities have their usual meaning. Specifically describe the strength of the outflow and the fraction of the turbulent energy which directly heats electrons. The radiative processes include synchrotron and bremsstrahlung emission and their Comptonization. After the dynamics of the accretion flow is solved, we can calculate the emitted spectrum and polarization fraction and compare with the observed ones.
The above set of equations hold for any accretion models including, e.g., the standard thin disk, except that the standard thin disk is one-temperature due to the strong coupling between electrons and ions so the two energy equations are unified into one. The ADAF solution is one set of solution in the regime of where is the Eddington accretion rate111There are four solutions to the eqs. (1)-(5), two “cold” ones and two “hot” ones. The former includes the standard thin disk and slim disk; the latter includes ADAF and LHAF. See Fig. 6 in Yuan 2001 and Fig. 1 in Yuan 2003 for details.. An ADAF has many distinct properties compared to the standard thin disk. The gas temperature is much higher, the flow is optically thin and geometrically thick. Perhaps most importantly, the radiative efficiency of an ADAF is very low, (for details, see Narayan & Yi 1994, 1995; Narayan, Mahadevan & Quataert 1998). This is the reason why ADAF models are so successful in explaining the dim feature of Sgr A* (Narayan et al. 1995, 1998; Manmoto et al. 1997).
There has been a significant change in the theoretical understanding of ADAFs over the past few years. First, global, time-dependent, numerical simulations reveal that very little mass available at large radii actually accrets onto the black hole and most of it is lost to a magnetically driven outflow or circulates in convective motions (e.g., Stone, Pringle, & Begelman 1999; Hawley & Balbus 2002), i.e, in eq. (1). The physical reason for the presence of outflow is that since very little energy is radiated away, the Bernoulli parameter of an ADAF is almost zero222The self-similar solution of Narayan & Yi (1994) gives a positive Bernoulli parameter of the flow. However, Nakamura (1998) argue that the Bernoulli parameter in an ADAF should be mostly negative. This is confirmed by my global solution of ADAFs., much larger than that in the standard thin disk, therefore the gas is earlier to escape to infinity once they are perturbed (Narayan & Yi 1994; Blandford & Begelman 1999).
In the early version of an ADAF, is assumed to be very small, , i.e., the turbulent energy only heats ions. However, there has been large theoretical uncertainties in how electrons are heated in the accretion flow (Quataert & Gruzinov 1999) and a larger seems to be physically more plausible since processes like magnetic reconnection is likely to heat electrons directly. A large is also required from the observational side. Quataert & Narayan (1999) show that when outflows are present, to produce the correct amount of emission of Sgr A*, the electrons in the accretion flow should be hotter than in the early version of ADAF to compensate for the decrease of radiation due to the decrease of density. Stated another way, must be larger, . Sometimes, the “updated” version of ADAF with and is called radiatively inefficient accretion flow (RIAF). In this review we simply use the original term: “ADAF”.
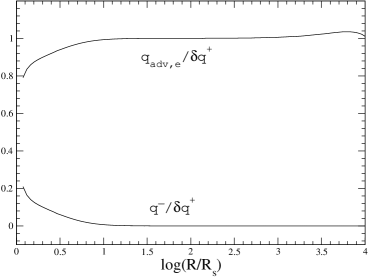
When , almost all of the turbulent energy is stored in the flow as the entropy of ions and very little is transferred into electrons through Coulomb collision , i.e., . We generally think this is why the radiative efficiency of ADAF is so low. If , which means that a large amount of turbulent energy will heat electrons directly, what is the radiative efficiency of an ADAF? In this case, as shown by Fig. 1, almost all of the turbulent energy heating electrons is stored in electrons as entropy, i.e., the electrons are advection-dominated. This ensures the low efficiency of an ADAF even though is large. We would like to emphasize that with the increase of accretion rate, the flow is no longer advection-dominated and the radiative efficiency rapidly increases (ref. Fig. 7 in Narayan, Mahadevan & Quataert 1998 and Fig. 6 in Yuan 2001).
3 Application to Sgr A*
3.1 Outer boundary conditions
The outer boundary conditions include the temperature, density, mass accretion rate, and angular momentum at the outer boundary. The outer boundary is determined by the Bondi radius. For an uniformly distributed matter with an ambient density and sound speed , the Bondi radius of a black hole of mass is and the accretion rate is . Chandra observations of the Galactic center detect extended diffuse emission within . The inferred gas density and temperature are and keV on scales (Baganoff et al. 2003). The corresponding Bondi radius and the Bondi accretion rate is . Given that the accreted gas should have some angular momentum (see below), the accretion rate should be somewhat smaller. The recent 3D numerical simulation for the accretion of stellar winds on to Sgr A* by Cuadra et al. (2006) obtains . If gas were accreted at this rate onto the black hole via the standard thin disk, the expected luminosity would be , 5 orders of magnitude higher than the observed luminosity. This is the strongest argument against a thin disk in Sgr A*.
The numerical simulation indicates that the angular momentum is large, with the circularization radius of being about (Cuadra et al. 2006). This result casts doubt on the “small angular momentum” assumption of spherical accretion models (Melia 1992; Melia et al. 2001).
3.2 Explaining the quiescent state
A number of authors have applied ADAF models to explain the observations of Sgr A*. In the early applications (e.g., Narayan et al. 1995, 1998; Mahadevan et al. 1997), they neglect outflows and the direct heating of electrons by turbulence, i.e., and are adopted. These work can roughly account for the observed low luminosity and spectrum of Sgr A*. However, such models can’t explain the observed high linear polarization. This is because the predicted density is too high and the rotation measure is in the region where high-frequency radio emission is produced, much higher than the upper limit of obtained by Marrone et al. (2006). This problem can be solved if we take into account the presence of outflows, i.e, . In this case, most of the accretion gas is lost to the outflow thus the density at the innermost region is much lower.
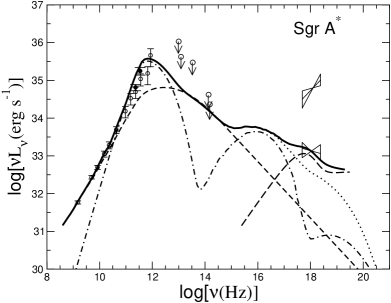
Another problem with the original ADAF model is that it under-predicts the low-frequency radio emission significantly. This can be solved by introducing another component to the model. One possibility is a jet (Falcke & Markoff 2000; Yuan, Markoff & Falcke 2002). Alternatively, some fraction of electrons in the ADAF may be in nonthermal distribution, due to acceleration processes in the accretion flow such as weak shocks and turbulent dissipation. Their synchrotron emission can explain the radio “excess”. Fig. 2 shows the modeling result of an ADAF model with outflow and nonthermal electrons, taken from Yuan, Quataert & Narayan (2003, hereafter YQN03). The parameters are . The nonthermal electrons are assumed to be in a power-law distribution with the spectral index of . The injected energy in nonthermal electrons is equal to a fraction of the energy in thermal electrons. The accretion rate close to the black hole is . As shown in the figure, the submm bump is mainly due to the synchrotron emission from thermal electrons, the low-frequency radio and IR emissions from the synchrotron emission from nonthermal electrons, while the extended X-ray emission from the bremsstrahlung emission from the region around the Bondi radius.

Since most of the accretion gas is lost into the outflow, the rotation measure is very small, and at 230 GHz if we integrate along the equatorial plane and rotation axis, respectively. Note that they should be regarded as upper limits since we assume the magnetic field is fully coherent and point along the line of sight while the magnetic field should be predominantly toroidal.
As noted above, the submm emission is due to thermal electrons. Since the linear polarization of optically thick thermal synchrotron emission from a uniform medium is suppressed by , where is the synchrotron optical depth, one also needs to check whether the model can roughly account for the magnitude of the observed linear polarization (). YQN03 have calculated the linear polarization produced by the thermal electrons in their models, including optical depth effects and Faraday rotation. Fig. 3a shows as a function of radius for three frequencies and Fig. 3b shows by open circles the degree of linear polarization as a function of frequency when Faraday rotation is neglected. From the figure we see that thermal electrons can readily account for the observed level of linear polarization from Sgr A*.
3.3 Understanding the flares
Markoff et al. (2001) showed that the flares are probably due to enhanced electron heating or acceleration, rather than a change in the accretion rate onto the black hole. The IR and X-ray flares in Sgr A* may be analogous with solar flares, in which magnetic energy is converted into thermal energy, accelerated particles, and bulk kinetic energy, due to magnetic reconnection. This speculation is confirmed by the 3D MHD numerical simulation by Machida et al. (2003). Unfortunately, even for solar flares, some important aspects such as the detailed acceleration mechanism and the energy distribution of heated/accelerated electrons remains unclear (Miller 1998).
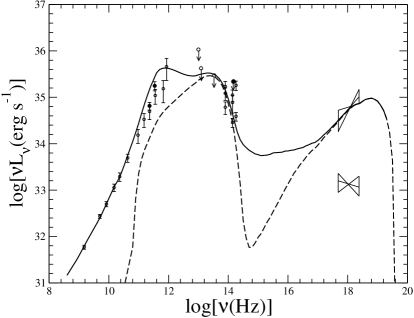
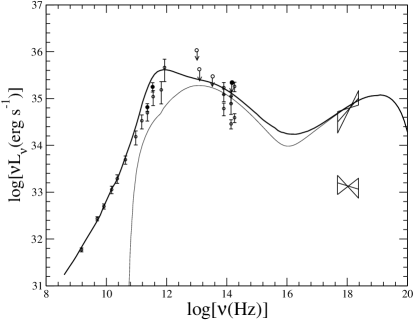
Based on this idea, YQN03 and Yuan, Quataert & Narayan (2004) propose that during the flare events, magnetic reconnection occurs in the innermost region of the ADAF. As a result, some electrons are heated/accelerated into a thermal/power-law distribution. Two models are proposed to explain the IR and X-ray flares in Sgr A*. In the first “synchrotron+SSC” model shown by Fig. 4, the electrons are accelerated into a single power-law distribution with the maximum Lorentz factor of several hundred. The IR flare is due to the synchrotron emission while the X-ray flares due to the up-scattering of the IR photons by these electrons. In the second “synchrotron” model shown by Fig. 5, it is assumed that, some electrons are heated into a higher temperature while some electrons are accelerated into a (hard) power-law distribution with . The synchrotron emission of these two types of electrons are responsible for the IR and X-ray emissions, respectively333Liu et al. (2006) propose that the electrons are in a thermal distribution after some stochastic acceleration process. The synchrotron emission and its inverse Compton scattering produce the observed IR and X-ray flares.. I would like to emphasize that both models can explain the observations well and there are no strong arguments against any one given our poor knowledge of particle acceleration.
3.4 Using the size measurement to test the models
Recent radio observations by the VLBA at 7 and 3.5 mm produce the high-resolution images of Sgr A*, and detect its wavelength-dependent sizes (Bower et al. 2004; Shen et al. 2005). The measured size of images of Sgr A* at 7 mm is mas by Bower et al. (2004), and 0.724 mas and mas at 7 and 3.5 mm, respectively by Shen et al. (2005). This provides an additional test to accretion models of Sgr A*.
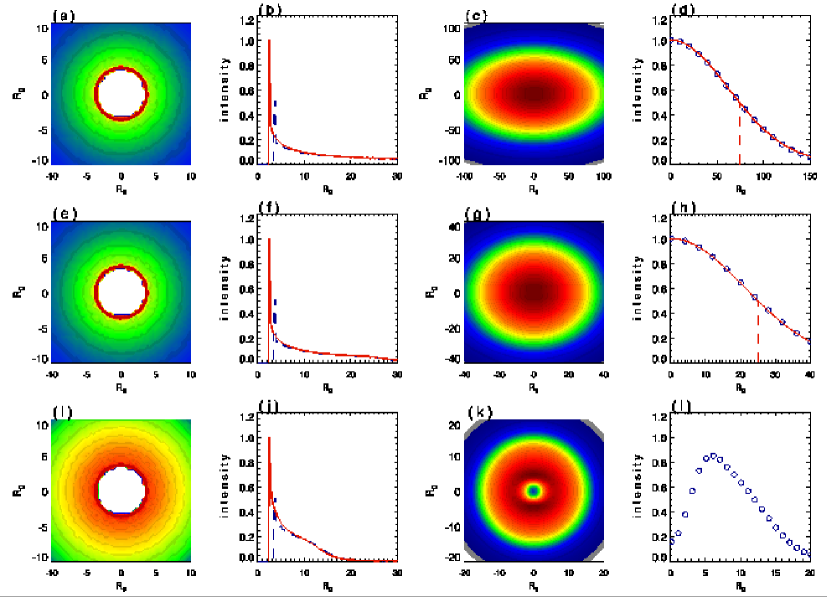
Yuan, Shen, & Huang (2006) calculate the predicted size of the YQN03 model. The most important point they realize is that since the intrinsic intensity profile of the ADAF is not a Gaussian, as shown by the dashed lines in the second column of Fig. 6, thus it is impossible to directly compare the predicted intrinsic size with observation. Rather, they calculate the predicted intrinsic intensity profile of the ADAF models, then taking into account the scattering broadening toward the Galactic center to obtain the simulated image. They then compare the simulated image with the observed one. The third column in Fig. 6 shows the simulated image at three wavelengths and the fourth column shows the fitting results of the intensity profile by a Gaussian. The obtained sizes of the simulated images are mas and mas at 7 mm and 3.5 mm, respectively. The simulated size at 7 mm is in good agreement with the observed value by Shen et al. (2005) within the error bars but slightly larger than the observed size by Bower et al. (2004); the size at 3.5 mm is a little larger than the observation of Shen et al. (2005). Given that the size of the source may be variable (Bower et al. 2004) and the uncertainties in the calculations, they conclude that the predictions of the YQN03 model are in reasonable agreement with the observations. They predict that GR effects may be detectable at 1.3 mm.
There are two alternative models of Sgr A*, namely the jet model of Falcke & Markoff (2000) and the coupled jet-ADAF model of Yuan, Markoff & Falcke (2002). One difference between these two models is that in the former the radio emission above GHz is produced by the nozzle of the jet while in the latter the contribution of the ADAF is significant. In the jet-ADAF model, the contribution of the emission from the ADAF can dominate over that from the jet under suitable parameters. Moreover, if the “old” ADAF in this model is “updated” (i.e, including outflow), the only difference between the jet-ADAF model and the YQN03 model is the origin of the radio emission below 86 GHz. In this case, the predicted size of Sgr A* by the jet-ADAF model will be consistent with the observations. On the other hand, the predicted sizes at 3.5 mm by the jet model is mas (Falcke & Markoff 2000), much smaller than the observed value, so some modifications of the model are required (Markoff et al. in preparation).
4 Summary
The supermassive black hole in our Galactic center represents a unique opportunity to probe the physics of accretion, especially at extremely low accretion rates. In this review, I first briefly introduce the dynamics and evolution of the ADAF. I then have tried to argue that this model can provide a reasonable explanation to most of the current observations.
Chandra observations tell us the density and temperature of the hot gas at pc. This radius happens to be the Bondi radius where the gas is captured by the gravity of the center black hole and starts to be accreted. The Bondi accretion rate, provides a good estimation to the real accretion rate. As a comparison, the numerical simulation gives . Since the bolometric luminosity of Sgr A* is only , the radiative efficiency should be very low, . The standard thin disk model (Shakura & Sunyaev 1976) is therefore ruled out immediately.
“Old” ADAF models can naturally explain such a low efficiency (e.g., Narayan et al. 1995). However, these models fail to explain the high linear polarization at submm waveband because the density and further, the rotation measure, are too large. On the other hand, theoretical studies of ADAFs also indicates the presence of outflow (e.g., Stone, Pringle & Begelman 1999; Blandford & Begelman 1999). This feature is taken into account in the “new” ADAF models (or RIAF; YQN03). The YQN03 model can explain the quiescent state spectrum and the polarization, as shown by Figs. (2)&(3). The accretion rate close to the horizon is only . So the low radiative efficiency of the ADAF in Sgr A* is partly because of the outflow, which contributes a factor of , and partly because of the energy advection, which contribute a factor of . The IR and X-ray flares are explained by the synchrotron and inverse-Compton emissions from the heated/accelerated electrons during the magnetic reconnection events in the innermost region of the ADAF (Figs. 4&5). Finally, the YQN03 model satisfactorily pasts the test of recent observations of the size of Sgr A* at 3.5 and 7 mm wavebands (Fig. 6). Moreover, this model predicts that the observation at 1.3 mm should be able to detect GR effects (Fig. 6).
This work was supported in part by the One-Hundred-Talent Program and the National Natural Science Foundation of China (grants 10543003)
References
References
- [1] Aitken, D.K., Greaves, J.S., Chyrsostomou, A. et al., 2000, ApJ, 534, L173
- [2] Baganoff, F. K., Maeda, Y., Morris, M. et al., 2003, ApJ, 591, 891
- [3] Baganoff, F. K., Bautz, M. W., Brandt, W. N. et al., 2001, Nature, 413, 45
- [4] Blandford, R.D., & Begelman, M.C. 1999, MNRAS, 303, L1
- [5] Bower, G.C. et al. 2003, ApJ, 588, 331
- [6] Bower, G. C., et al. 2004, Science, 304, 704
- [7] Cuadra, J. et al. 2006, MNRAS, 366, 358
- [8] Eckart, A.; Baganoff, F. K.; Morris, M. et al. 2004, A&A, 427, 1
- [9] Eckart, A. et al. 2006, A&A, 450, 535
- [10] Falcke, H., Goss, W. M., Matsuo, H., Teuben, P., Zhao, J. H., & Zylka, R., 1998, ApJ, 499, 731
- [11] Falcke, H., Markoff, S. 2000, A&A, 362, 113
- [12] Ghez, A. M., et al. 2003, ApJ, 586, L127
- [13] Ghez, A. M. et al. 2004, ApJ, 601, L159
- [14] Gillessen, S.; et al. 2006, ApJ, 640, L163
- [15] Goldwurm A., et al. 2003, ApJ, 584, 751
- [16] Hawley, J. F. & Balbus, S. A. 2002, ApJ, 573, 738
- [17] Herrnstein, R.M., Zhao, J.-H., Bower, G.C., Goss, W.M. 2004, AJ, 127, 3399
- [18] Hornstein, S. D. et al. 2006, these proceedings
- [19] Liu, S. et al. 2006, submitted to ApJ (astro-ph/0603136)
- [20] Machida, M. & Matsumoto, R. 2003, ApJ, 585, 429
- [21] Macquart J.P. et al. 2006 astro-ph/0606381
- [22] Manmoto, T., Mineshige, S., & Kusunose, M. 1997, ApJ, 489, 791
- [23] Markoff, S., Falcke, H., Yuan, F., & Biermann, P. 2001, A&A, 379, L13
- [24] Marrone, D.P. et al. 2006, ApJ, 640, 308
- [25] Melia, F., 1992, ApJ, 387, L25
- [26] Melia, F., & Falcke, H. 2001, ARA&A, 39, 309
- [27] Melia,F., Liu, S., & Coker, R. 2001, ApJ, 553, 146
- [28] Miller, J.A. 1998, Spac. Sci. Rev. 86, 79
- [29] Miyazaki, A., Tsutsumi, T., & Tsuboi, M. 2004, ApJ, 611, L97
- [30] Nakamura, K. E. 1998, PASJ, 50, L11
- [31] Narayan, R. & Yi, I. 1994, ApJ, 428, L13
- [32] Narayan, R. & Yi, I. 1995, ApJ, 444, 231
- [33] Narayan, R., Yi, I., & Mahadevan, R., 1995, Nature, 374, 623
- [34] Narayan, R., Mahadevan, R., Grindlay, J.E., Popham, R. & Gammie, C., 1998, ApJ, 492, 554
- [35] Narayan, R., Mahadevan, R., & Quataert, E. 1998, in “The Theory of Black Hole Accretion Discs”, eds. M.A. Abramowicz, G. Bjornsson, and J.E. Pringle, (Cambridge University Press)
- [36] Porquet, D., et al. 2003, A&A, 407, L17
- [37] Quataert, E. & Gruzinov 1999, ApJ, 520, 248
- [38] Quataert, E. & Gruzinov 2000, ApJ, 545, 842
- [39] Quataert, E., & Narayan, R., 1999, ApJ, 520, 298
- [40] Schödel, R. et al. 2002, Nature, 419, 694
- [41] Shakura, N. I.; Sunyaev, R. A, 1973, A&A, 24, 337
- [42] Shen, Z.-Q. et al. 2005, Nature, 438, 62
- [43] Stone, J., Pringle, J., & Begelman, M. 1999, MNRAS, 310, 1002
- [44] Yuan, F. 2001, MNRAS, 324, 119
- [45] Yuan, F. 2003, ApJ, 594, L99
- [46] Yuan, F., Markoff, S., & Falcke, H., 2002, A&A, 383, 854
- [47] Yuan, F., Quataert, E., & Narayan, R. 2003, ApJ, 598, 301 (YQN03)
- [48] Yuan, F., Quataert, E., & Narayan, R. 2004, ApJ, 606, 894
- [49] Yusef-Zadeh, F. et al. 2006, ApJ, 644, 198
- [50] Zhao, J.-H., et al. 2003, ApJ, 586, L29
- [51] Zhao, J.-H., et al. 2004, ApJ, 603, L85