ATCA observations of the galaxy cluster Abell 3921
We present the analysis of our 13 and 22 cm ATCA observations of the central 1815 region of the merging galaxy cluster A3921 (=0.094). We investigated the effects of the major merger between two sub-clusters on the star formation (SF) and radio emission properties of the confirmed cluster members. The origin of SF and the nature of radio emission in cluster galaxies was investigated by comparing their radio, optical and X-ray properties. We also compared the radio source counts and the percentage of detected radio galaxies with literature data. We detected 17 radio sources above the flux density limit of 0.25 mJy/beam in the central field of A3921, among which 7 are cluster members. 9 galaxies with star-forming optical spectra were observed in the collision region of the merging sub-clusters. They were not detected at radio wavelengths, giving upper limits for their star formation rate significantly lower than those typically found in late-type, field galaxies. Most of these star-forming objects are therefore really located in the high density part of the cluster, and they are not infalling field objects seen in projection at the cluster centre. Their SF episode is probably related to the cluster collision that we observe in its very central phase. None of the galaxies with post-starburst optical spectra was detected down our 2 flux density limit, confirming that they are post-starburst and not dusty star-forming objects. We finally detected a narrow-angle tail (NAT) source associated with the second brightest cluster galaxy (BG2), whose diffuse component is a partly detached pair of tails from an earlier period of activity of the BG2 galaxy.
Key Words.:
Galaxies: clusters: general – Galaxies: clusters: individual: Abell 3921 – Radio continuum: galaxies1 Introduction
In the past 25 years, optical observations of clusters have revealed an evolution in galaxy properties with redshift. The fraction of star-forming and post-star-forming cluster objects significantly increases with , ranging from 1–2% in the local Universe (Dressler 1987) to 30% at 0.3–0.5 (Dressler et al. 1999). In 1978, Butcher & Oemler reported a strong evolution of the mean galaxy colour with redshift, from red to blue with increasing . A debate on the physical origin of this effect began: the observed change of galaxy colours with redshift could be simply due to a passive evolution of infalling field galaxies, or it could be strongly affected by environmental effects. In 1983 Dressler & Gunn pointed out for the first time that in fact the blue colour of the population detected by Butcher & Oemler was the result of star formation (SF) activity. Since then, many different studies have tried to explain the origin of the observed evolution in the SF history of cluster galaxies. The different physical mechanisms that have been proposed may either trigger or weaken SF within clusters (e.g. Dressler & Gunn 1983; Evrard 1991; Bekki 1999; Fujita et al. 1999).
The hierarchical model of structure formation predicts the formation and evolution of galaxy clusters through mergers of less massive systems. Due to the large energies involved in cluster-cluster collisions, a merging event can enhance the efficiency of the physical mechanisms responsible for the evolution of the galaxy star formation rate (SFR). The first observational evidence for a correlation between cluster mergers and SF activity came from the optical analysis of the Coma cluster, where an excess of star-forming and post-star-forming galaxies was observed in the collision region between the main cluster and a group of galaxies (Caldwell et al. 1993). While in several other non-relaxed clusters the collision between two or more clumps seems to have increased the SFR of the galaxies (e.g. Gavazzi et al. 2003), other analyses show the opposite trend (e.g. Baldi et al. 2001). Therefore, the net role played by the merging event on SF still has to be fully understood. To answer this question, multi-wavelength (optical, X-ray, radio and/or IR) observations of galaxy clusters are essential, as they allow us to determine in detail both the dynamical state of the observed systems and the SF properties of cluster members (e.g. Dwarakanath & Owen 1999; Owen et al. 1999; Venturi et al. 2000, 2001 and 2002; Duc et al. 2002; Miller, Owen & Hill 2003; Rizza et al. 2003; Giacintucci et al. 2004; Owen et al. 2005a and 2005b).
Abell 3921 is a R=2, BM II Abell cluster at (Katgert et al. 1996, 1998). Its perturbed morphology, first revealed by ROSAT and Ginga observations (Arnaud et al. 1996), has been recently confirmed by new optical (multi-object spectroscopy and VRI deep imaging, Ferrari et al. 2005, F05 in the following) and X-ray analyses (XMM observations, Belsole et al. 2005, B05 in the following). Two dominant clumps of galaxies with a distorted morphology and a mass ratio of 5 have been detected: a main cluster centred on the Brightest Cluster Galaxy (BCG) (A3921-A), and an NW sub-cluster (A3921-B) hosting the second brightest cluster member. The comparison of the optical and X-ray properties of A3921 (i.e. dynamical and kinematic properties of the cluster, optical and X-ray morphology, features in the ICM density and temperature maps) suggests that A3921-B is probably tangentially traversing the main cluster along the SW/NE direction. The two sub-clusters are observed in the central phase of their merging process ( 0.3 Gyr), with a collision axis approximately on the plane of the sky (F05; B05). A comparison of the metallicity distribution in A3921 with numerical simulations refined the reconstructed merging scenario, suggesting that we are observing the very central phase of the clusters’ interaction, just before the first core-core encounter (Kapferer et al. 2006).
From spectral features of galaxies belonging to A3921, the SF properties of confirmed cluster members have also been studied (F05). Substantial fractions of both emission-line and post-star-forming objects (so called k+a’s) have been detected, comparable to those measured at intermediate redshifts. Most of the k+a galaxies in A3921 have fainter magnitudes than the post-star-forming objects detected in higher redshift clusters (“downsizing effect”, e.g. Poggianti et al. 2004). Since emission-line galaxies in A3921 share neither the kinematics nor the projected distribution of the passive cluster members, and they are mostly concentrated in the region between the two sub-clusters, F05 concluded that the ongoing merger may have triggered a SF episode in the galaxies located inside or around the collision region, where a hot compression bar has been detected in the ICM temperature distribution (B05). The on-going merger could also be responsible for the high fraction of star-forming and post-star-forming objects in this low redshift cluster.
These results motivated new high sensitivity radio observations of A3921 with the Australia Telescope Compact Array (ATCA), in order to shed light on the possible connection between the detected merger and the SF and AGN activity in cluster galaxies. This paper deals with the analysis of the radio emission in the central region of the cluster, where we detected the major merger between the main sub-clusters A3921-A and A3921-B. Sect. 2 briefly describes the observations and the data reduction. In Sects. 3 and 4 we analyse the radio emission from the A3921 central region and from the confirmed cluster members. The nature of the peculiar radio source associated with the second brightest cluster galaxy is discussed in Sect. 5. The main results and their interpretation are summarized in Sect. 6.
As in F05 and B05, throughout the paper we assume =75 km , , . In this cosmology 1 arcmin corresponds to 0.097 Mpc.
2 Observations and data reduction
| Configuration | Baselines (metres) | |
|---|---|---|
| Min | Max | |
| 6A | 337 | 5939 |
| 6C | 153 | 6000 |
| 750C | 46 | 5020 |
| 1.5D | 107 | 4439 |
We observed the central 1815 (1.81.5 ) field of A3921 covered by our previous optical observations with the Australia Telescope Compact Array (ATCA) at 22 cm (=1.344 GHz) and 13 cm (=2.368 GHz) simultaneously. The ATCA comprises five 22 m antennas placed on a 3 km railway track, running east-west, and an isolated sixth antenna, located 3 km further to the west. There are several stations on which the antennas can be placed, thus allowing a selection of extended or compact configurations with a range of different spacings. The configurations used here, which together gave reasonably uniform uv coverage, are given in Table 1, where the minimum and maximum spacings are indicated. Observations were performed in continuum mode with a bandwidth of 128 MHz in May, July, November and December 2004. A uniform sensitivity radio map of the central 1815 of A3921 was obtained by using the mosaicing facility of the ATCA. The central cluster field was covered with eight overlapping pointings separated by 10 arcmin (i.e. half the primary beam width at 13 cm). To obtain good hour angle coverage, the eight pointings were observed in sequence every 160 seconds. The cycle, including calibration, was repeated for 12 hours for each observing run. B1934638 and B2205636 were used as primary and secondary calibrators. The largest structure detectable by these observations corresponds to 16 and 10 arcmin at 22 and 13 cm respectively.
Data reduction was carried out following the standard procedure (calibration, Fourier inversion, clean and restore) with the MIRIAD package. We reduced and imaged each pointing separately. The eight cleaned maps at 22 and 13 cm were finally mosaiced (i.e. linearly combined) with the MIRIAD task LINMOS, using the taper option of this program, which corrects for primary beam attenuation avoiding excessive noise amplification at the edge of the mosaic field (Sault, Staveley-Smith & Brouw 1996). The noise levels in the final maps are given in Table 2. We also obtained a spectral index () map by combining the images at 1.344 GHz and 2.368 GHz with the AIPS task COMB. For this purpose, maps at the two frequencies were made with the same beam (i.e. arcsec) and the same uv-range (i.e. 0.354–30 k). The output image was blanked whenever the intensity of the corresponding pixel was lower than twice the map noise in either image.
3 Radio emission from the central field of A3921
3.1 The sample
Within the central 1815 of A3921 we found 17 radio sources above a peak flux density limit of 5 times the r.m.s. noise in the 1.344 GHz map. The dynamic range is of the order of 1000:1, so the local noise level around strong sources may be higher than that given in Table 2.
The source list is reported in Table 3, where we give:
-
-
Columns (1) & (2): radio ID and name of detected sources. We used the prefix “FHF2006” (i.e. initials of the first three authors and year of publication) for the names of sources not present in any previous radio survey.
-
-
Columns (3) & (4): right ascension and declination (J2000.0) with errors.
-
-
Columns (5), (6) & (7): integrated intensity at 22 and 13 cm and spectral index with errors111The radio spectral index is defined such as ..
-
-
Column (8): radio morphology (“resolved” or “unresolved”).
-
-
Column (9): measured angular size of the source, if resolved.
| RMS Noise | ||
|---|---|---|
| GHz | mJy/beam | arcsec |
| 1.344 | 0.049 | 12.0 |
| 2.368 | 0.052 | 8.0 |
| 2.368 | 0.053 | 12.0 |
| IDR | Source name | (err) | (err) | (err) | (err) | (err) | Mor. | Size |
|---|---|---|---|---|---|---|---|---|
| # | (s) | mJy | mJy | |||||
| deg | ||||||||
| R1 | SUMSS J224834642037 | 22 48 35.24(0.03) | 64 20 37.3(0.5) | 11.79(0.14) | 8.11(0.14) | 0.66(0.04) | u | — |
| — | ||||||||
| R2 | FHF2006 J224839641921 | 22 48 39.74(0.13) | 64 19 21.7(1.1) | 0.36(0.08) | 0.31(0.11) | 0.3: | u | — |
| — | ||||||||
| R3 | FHF2006 J224848642311 | 22 48 48.74(0.06) | 64 23 11.4(0.6) | 1.80(0.05) | 1.32(0.05) | 0.55(0.08) | r | 1614, |
| p.a.=102 | ||||||||
| R4 | FHF2006 J224902642743 | 22 49 02.60(0.04) | 64 27 43.9(0.5) | 0.37(0.06) | 0.21(0.07) | 1.0: | u | — |
| — | ||||||||
| R5 | SUMSS J224857642059 | 22 49 04.63(0.03) | 64 20 36.3(0.5) | 43.80(0.44) | 13.95(0.15) | 2.02(0.03) | r | 10599, |
| p.a.=0 | ||||||||
| R6 | FHF2006 J224904641816 | 22 49 04.98(0.04) | 64 18 16.3(0.5) | 1.90(0.07) | 1.29(0.07) | 0.68(0.11) | r | 1612, |
| p.a.=16 | ||||||||
| R7 | PMN J22496415 | 22 49 12.73(0.03) | 64 15 34.0(0.5) | 133.20(1.35) | 81.02(0.89) | 0.88(0.03) | u | — |
| — | ||||||||
| R8 | FHF2006 J225007642408 | 22 50 07.00(0.05) | 64 24 08.9(0.5) | 0.88(0.09) | 0.59(0.43) | 0.7: | u | — |
| — | ||||||||
| R9 | SUMSS J225007642439 | 22 50 07.72(0.03) | 64 24 40.9(0.5) | 63.82(0.64) | 42.55(0.43) | 0.72(0.03) | r | 2112, |
| p.a.=81 | ||||||||
| R10 | FHF2006 J225013641935 | 22 50 13.64(0.07) | 64 19 35.3(0.6) | 0.82(0.05) | 0.33(0.05) | 1.61(0.29) | r | 1512, |
| p.a.=124 | ||||||||
| R11 | FHF2006 J225026642819 | 22 50 26.41(0.04) | 64 28 19.8(0.5) | 2.18(0.05) | 1.20(0.05) | 1.06(0.08) | r | 1413, |
| p.a.=27 | ||||||||
| R12 | FHF2006 J225035642542 | 22 50 35.61(0.15) | 64 25 42.8(1.3) | 0.25(0.07) | 0.2: | — | u | — |
| — | ||||||||
| R13 | FHF2006 J225036641608 | 22 50 36.52(0.11) | 64 16 08.4(0.7) | 0.33(0.09) | 0.3: | — | u | — |
| — | ||||||||
| R14 | FHF2006 J225038642020 | 22 50 38.24(0.11) | 64 20 20.1(1.2) | 0.80(0.05) | 0.64(0.05) | 0.40(0.19) | r | 2414, |
| p.a.=7 | ||||||||
| R15 | SUMSS J225046641658 | 22 50 46.60(0.03) | 64 16 59.4(0.5) | 21.04(0.23) | 12.89(0.37) | 0.87(0.05) | u | — |
| — | ||||||||
| R16 | FHF2006 J225050642720 | 22 50 50.59(0.05) | 64 27 20.0(0.6) | 0.82(0.08) | 0.4: | — | u | — |
| — | ||||||||
| R17 | FHF2006 J225052642443 | 22 50 52.57(0.11) | 64 24 43.8(0.9) | 0.30(0.07) | 0.4: | — | u | — |
| — |
The total flux density and the position of the flux density peak at 22 cm of the irregular resolved source R5 (SUMSS J224857-642059) were calculated using the AIPS task TVSTAT. Its size was estimated using the verb TVDIST. For all the other regular (circular/elliptical) sources the position, integrated intensity and measured size were obtained with a Gaussian fit using the AIPS task IMFIT. The errors in Gaussian fits were taken into account following Condon (1997). We fitted six free parameters (amplitude , central position (), major and minor axes (), and position angle ). We retained the fitted total flux density () only for resolved sources. In the other cases the quoted total flux density corresponds to the corrected amplitude, i.e. the fitted amplitude () multiplied by the square root of the ratio of the fitted size of the source () and the beam size (, eq. (29) of Condon 1997):
| (1) |
Unresolved or barely resolved sources were identified at 22 cm as those whose fitted size is within 1 of the map beam size, and/or:
| (2) |
where and are the fitted integrated and peak fluxes, and are the associated errors:
| (3) |
The errors in position () quoted in Table 3 were estimated as the quadratic combination of the formal IMFIT errors and a nominal 0.5′′ calibration uncertainty. The errors in flux density were similarly obtained as the quadratic combination of the r.m.s. noise of the radio map and the formal uncertainty in the total flux density. This latter error was assumed as in Eq. 3 for resolved sources (i.e. ), and estimated through error propagation from Eq. 1 for unresolved sources.
3.2 Comparison with background counts
As mentioned in the previous Sect., we counted 17 radio sources with 0.25 mJy in the central area (0.075 deg2) of A3921. We then compared this number of radio sources with field counts, in order to test the possible presence of an excess of radio emission in the region of the cluster hosting the main merger between A3921-A and A3921-B. The sensitivity of the radio image analysed in this paper is uniform to the 5 flux density limit (0.25 mJy/beam) due to the overlapping of the 8-pointings of the mosaic in the central region of A3921.
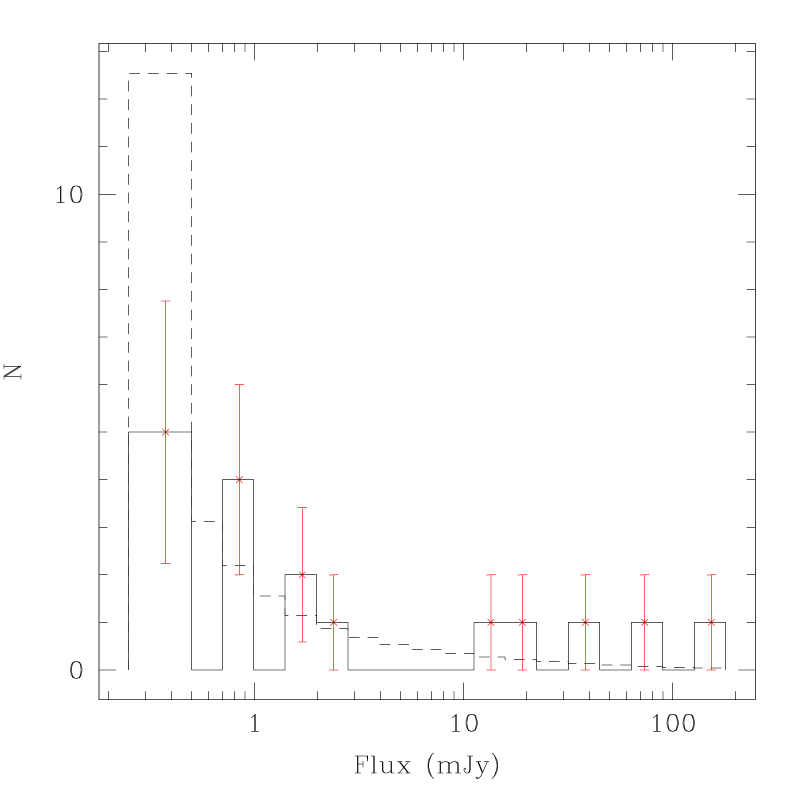
Our results were compared with those of Hopkins et al. (2003). By integrating their polynomial fit for source counts, 25 field radio sources are expected down to the flux limit of our radio observations. Assuming Poissonian noise for our counts, we found a slight deficit of radio sources in our cluster field at level. Fig. 2 shows the radio flux density distribution in A3921 and in the field (Hopkins et al. 2003). At 2 level, there is either a possible excess of radio sources in the field in the lowest flux density bin (0.25–0.50 mJy), or the A3921 counts are incomplete at the faint end. Based on a two-sided Kolmogorov-Smirnov test, the probability that the two distributions are taken from the same parent population is 14%, so the test is not conclusive.
3.3 Radio-optical identification
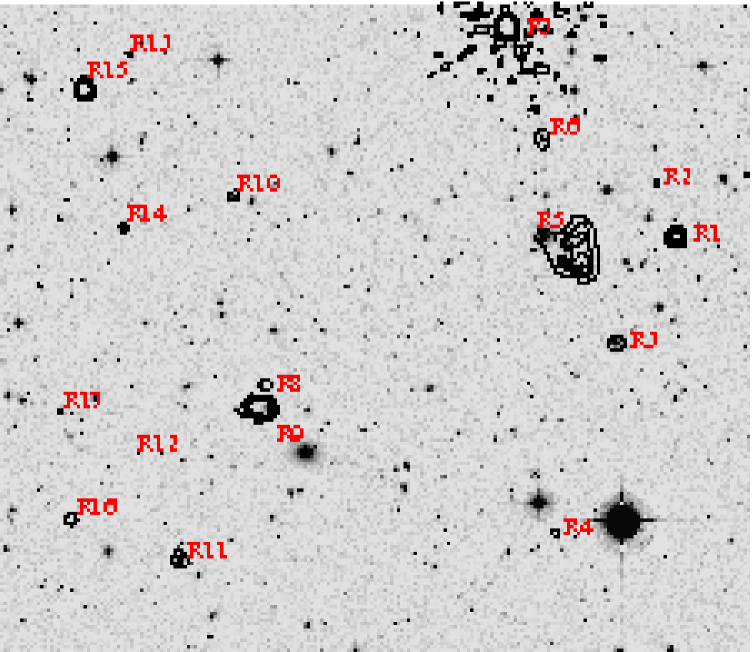
Using our VRI catalogue (WFI data, F05), we found optical identifications for 14 of the 17 radio sources above 5. They are listed in Table 4, which contains:
-
-
Column (1): radio ID based on Table 3.
-
-
Column (2): optical ID based on Table A of F05 (when available).
-
-
Columns (3) & (4): optical coordinates.
-
-
Column (5): offset between the radio and optical coordinates.
-
-
Column (6): parameter , where (given in Table 3) and (0.1 arcsec) are the radio and optical position errors respectively.
-
-
Columns (7), (8) & (9): V, R and I-band magnitudes (WFI observations, F05).
-
-
Column (10): redshift of the source (when available).
-
-
Column (11): Log of the absolute spectral luminosity at 1.344 GHz (W/Hz), estimated when the redshift is available from (Petrosian & Dickey 1973), where is the spectral index of the source.
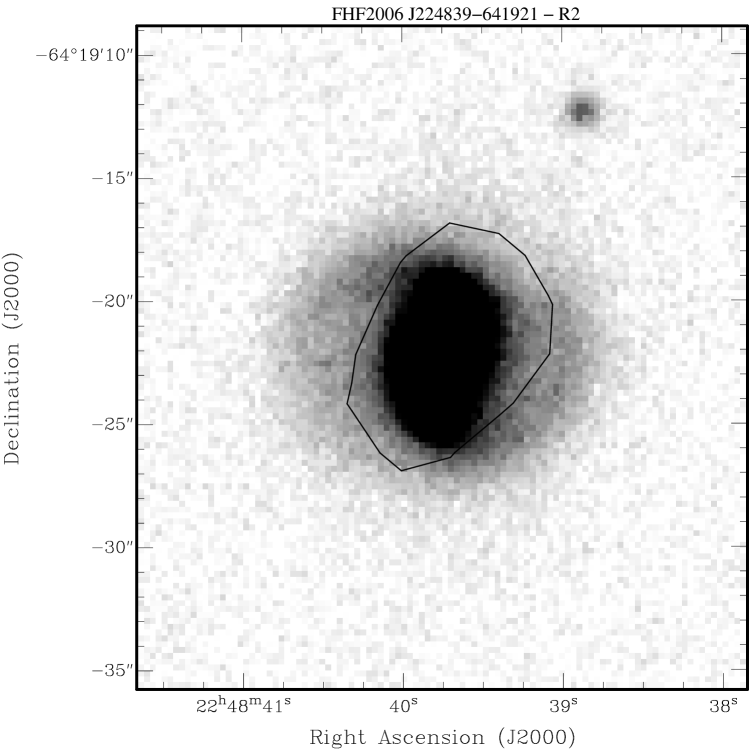
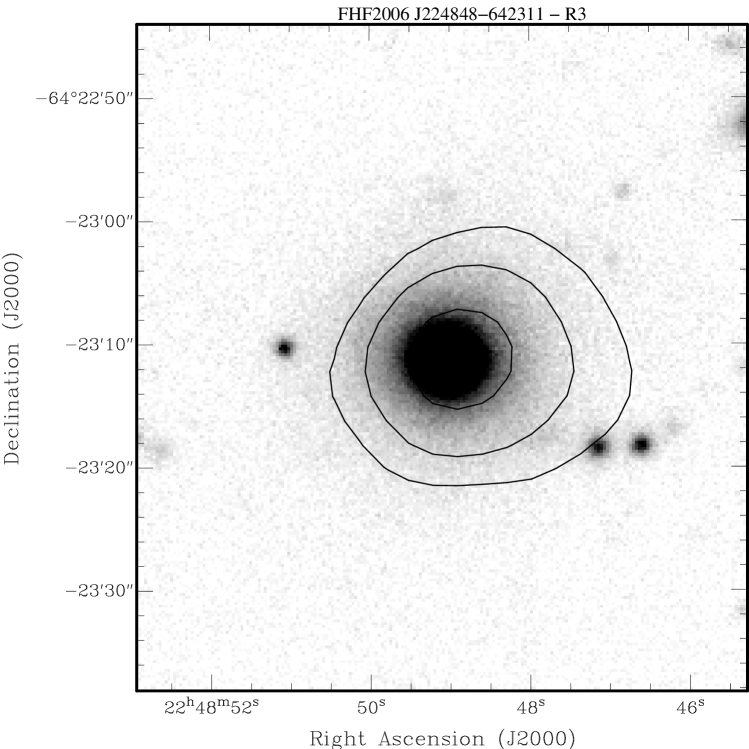
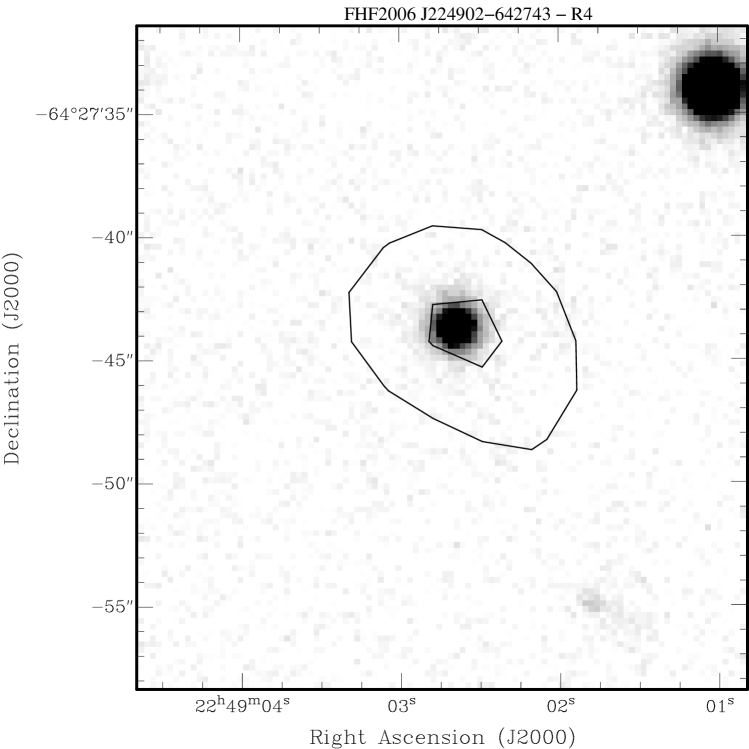
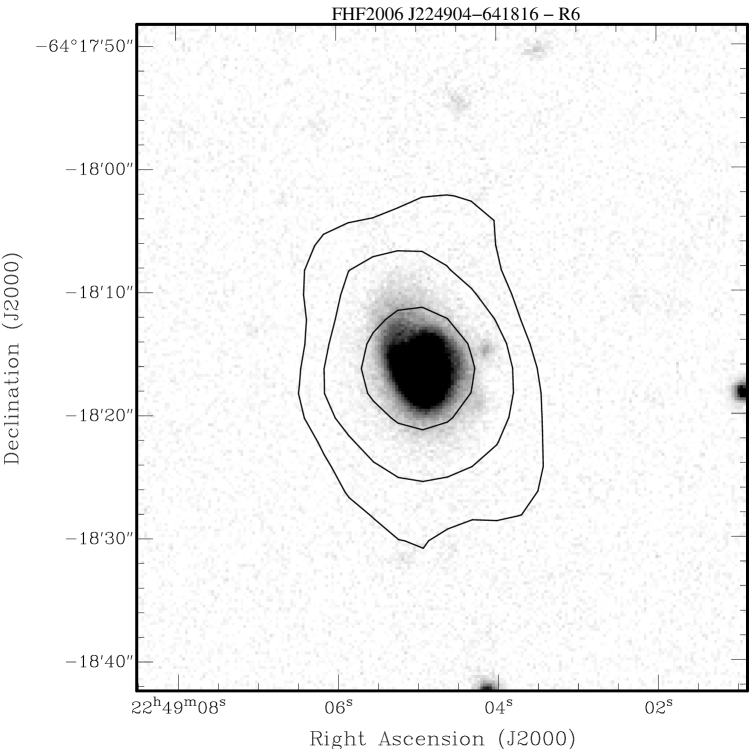
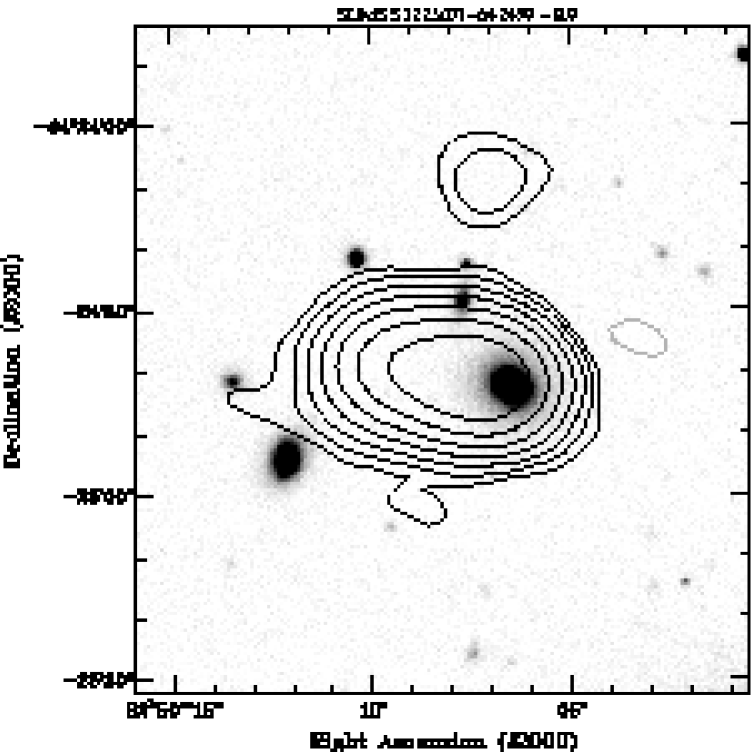
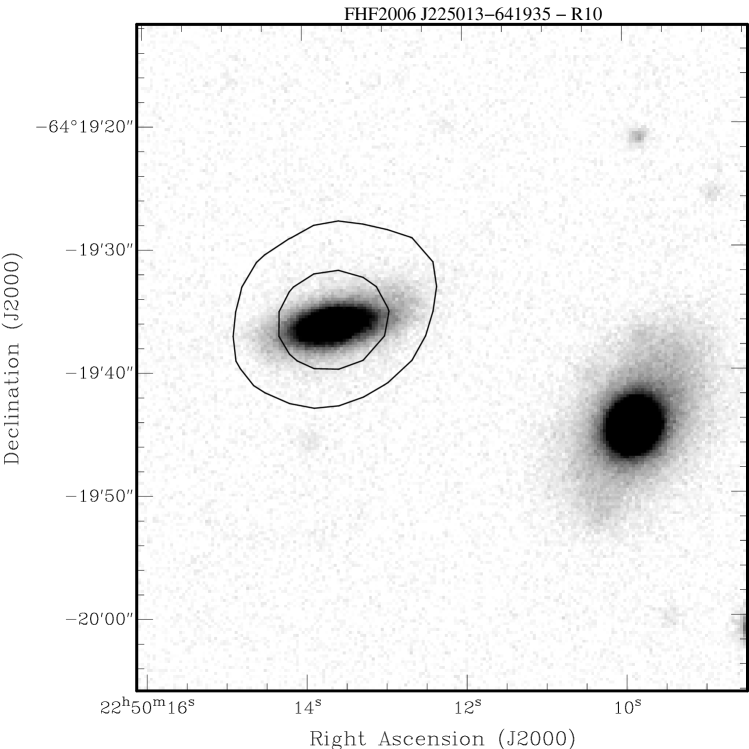
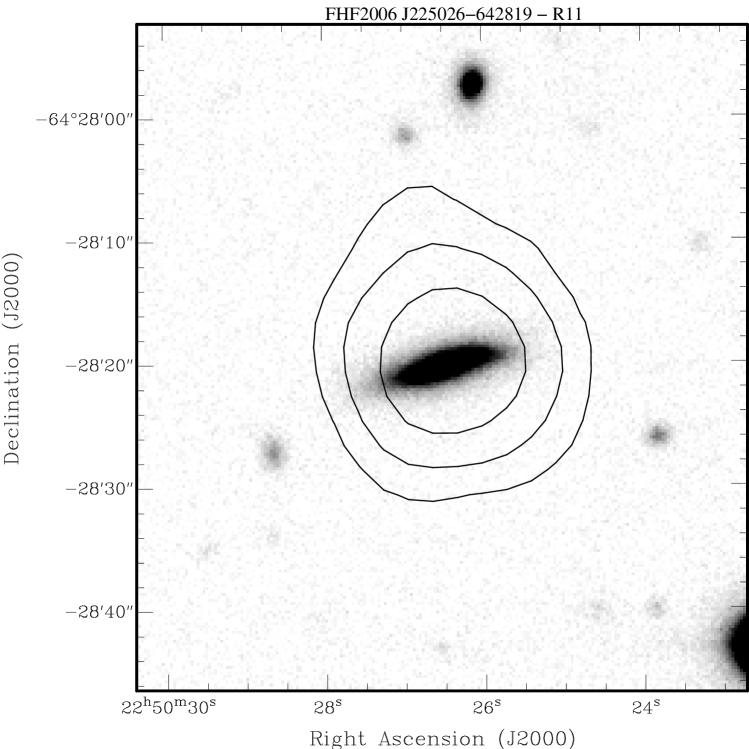
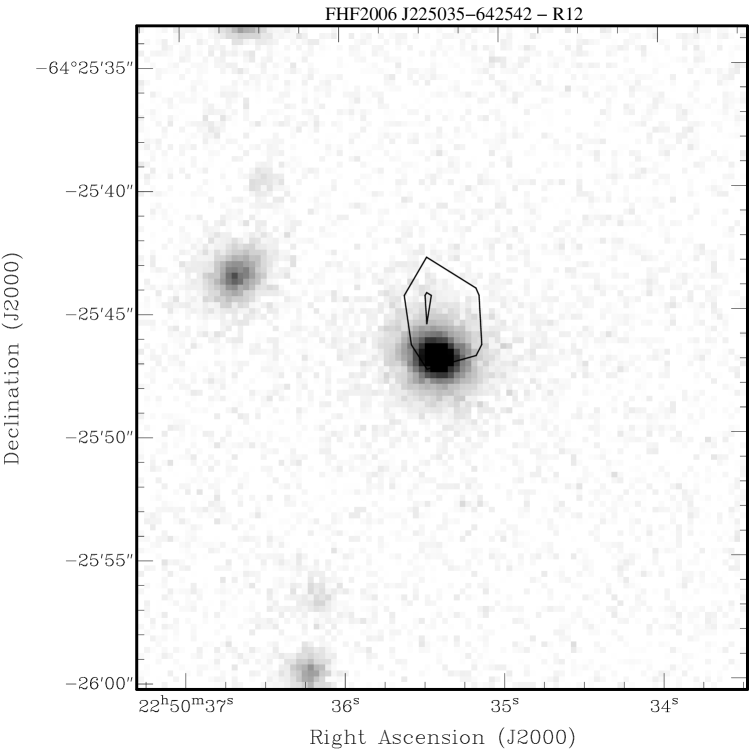
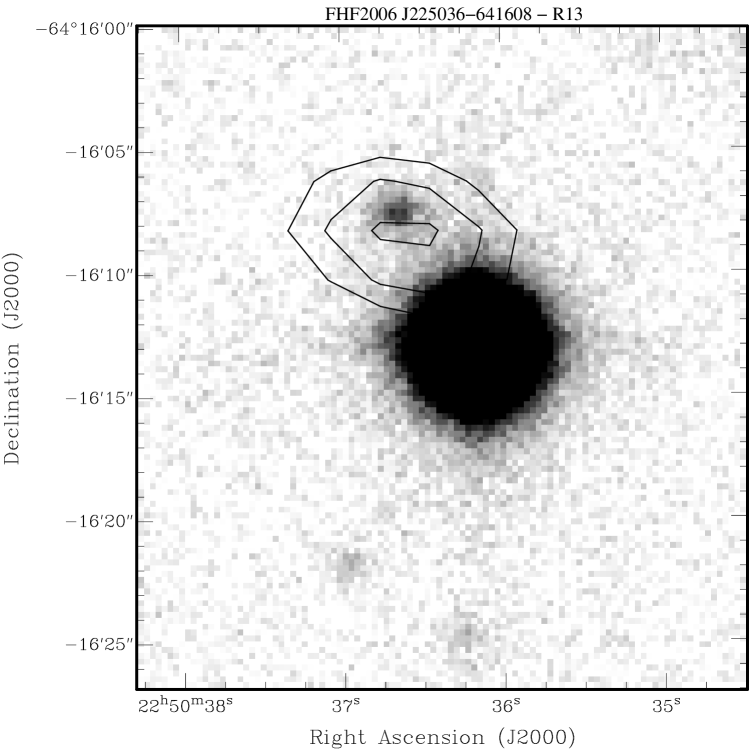
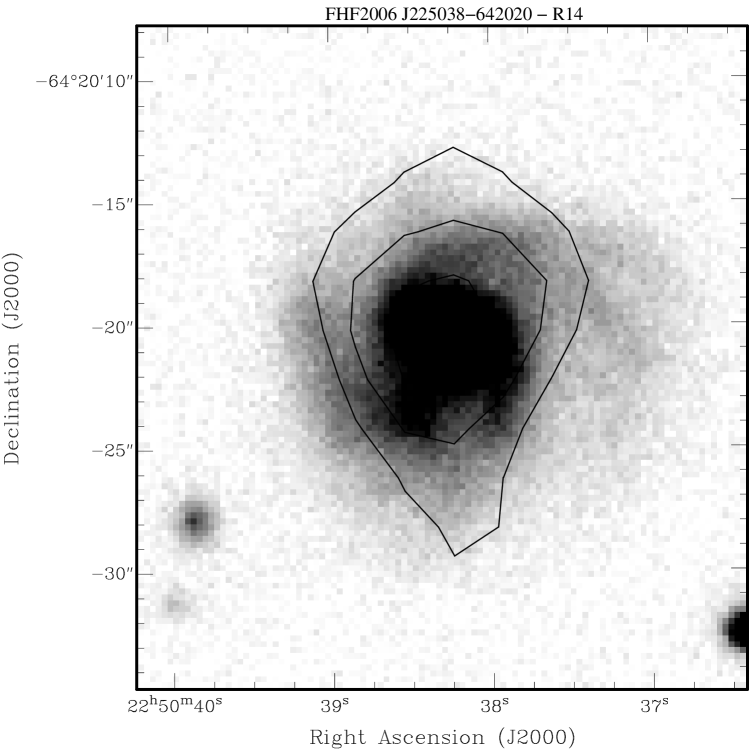
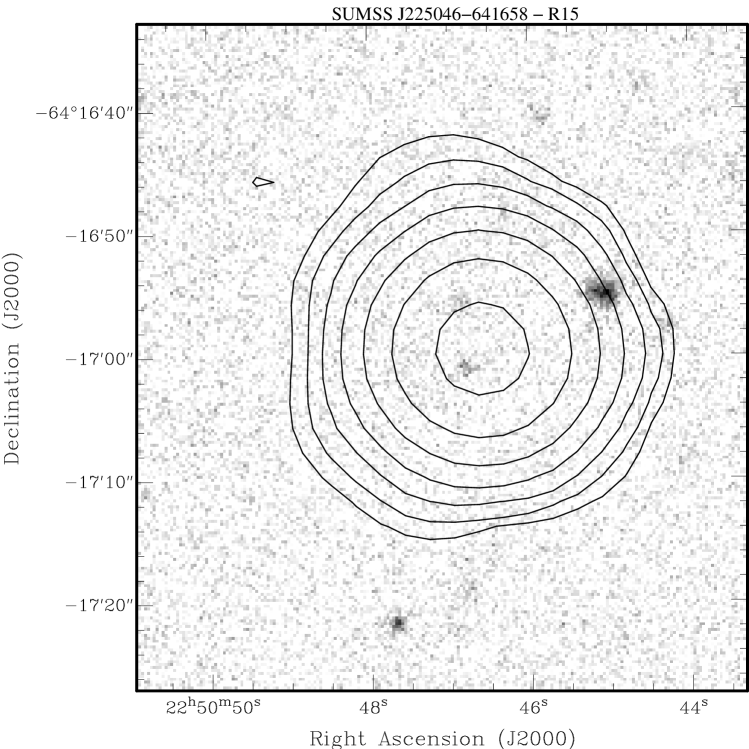
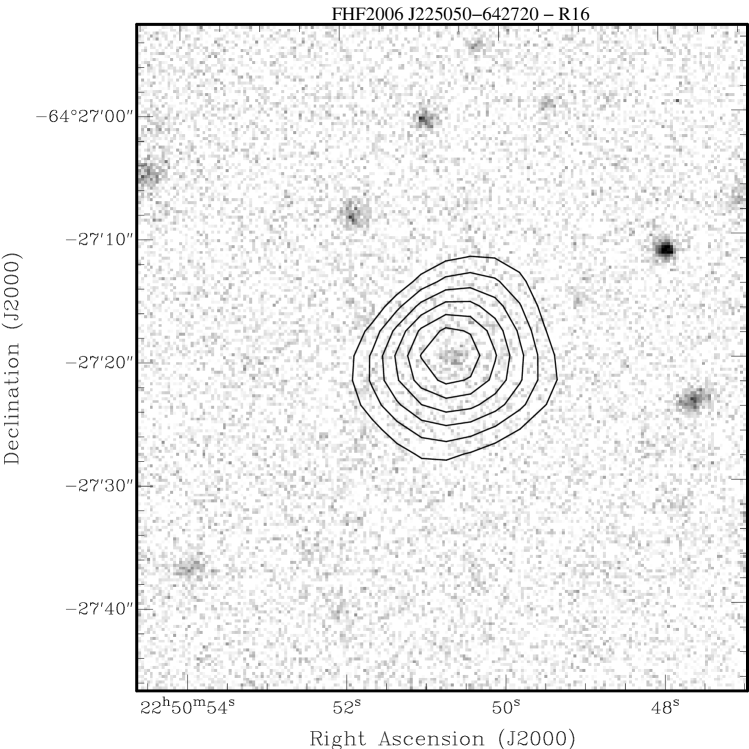
The 14 identified radio sources are shown in Fig. 3 with 22 cm radio contours overlaid on the R-band WFI images. We considered as reliable identifications all those with . For the extended source R9, which shows a radio-optical offset along the extension of the radio emission and has (=12.40), we relied on direct inspection by eye rather than the value of . We concluded that R9 is associated with the bright galaxy (R15) on the western side of the radio emission (see Fig. 3), and that it has a head-tail radio morphology along the West/East direction. A weak steepening of the spectrum is observed on the spectral index map of the source moving from the head towards East. R9 is a confirmed cluster member, located in the central, high-density region of A3921. Its radio morphology is therefore probably due to the ram-pressure222, where is the density of the intra-cluster medium, and is the relative velocity between the ICM and the galaxy. exerted on the radio emitting plasma by the dense ICM, through which the galaxy is moving towards the cluster centre (in the East/West direction). The extremely peculiar morphology of the radio source R5, associated with the second BCG, will be discussed in detail in Sect. 5.
We also noticed that two sources (R5 and R10) have steep spectral indexes (). R5 is a confirmed cluster member, while we do not have redshift information for R10. Based on its magnitude and morphology, R10 is probably a cluster galaxy: it occupies the region of A3921 red-sequence on the colour magnitude diagrams ( and , F05) and its morphology and size are very similar to its projected neighbour (see Fig. 3) which is at the cluster redshift (Katgert et al. 1996, 1998). The two radio sources with steepest spectra are therefore very likely cluster members. Their steep radio spectra may be related to the pressure of the ICM, which prevents adiabatic expansion (e.g. Murgia et al. 2004).
| IDR | IDO | V | R | I | ||||||
|---|---|---|---|---|---|---|---|---|---|---|
| mag | mag | mag | () | |||||||
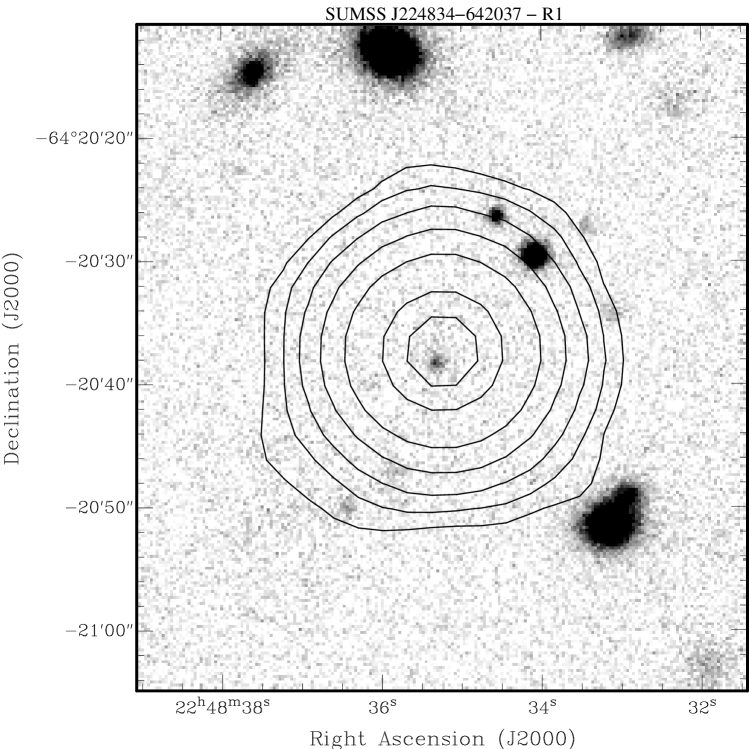
| R1 | — | 22 48 35.32 | 64 20 38.2 | 0.98 | 1.43 | 22.48 | 22.04 | — | — | — |
| R2 | 57 | 22 48 39.75 | 64 19 22.2 | 0.46 | 0.21 | 17.01 | 16.44 | 15.79 | 0.091 | 21.82 |
| R3 | 69 | 22 48 49.01 | 64 23 11.2 | 1.75 | 1.65 | 16.22 | 15.59 | 14.84 | 0.097 | 22.59 |
| R4 | 215 | 22 49 02.64 | 64 27 43.6 | 0.41 | 0.51 | 19.60 | 19.45 | 19.41 | 0.065∗ | 21.56 |
| R5 | 52 | 22 49 04.78 | 64 20 35.6 | 1.17 | 1.71 | 15.42 | 14.72 | 14.00 | 0.093 | 24.00 |
| R6 | —∗∗ | 22 49 04.93 | 64 18 16.2 | 0.37 | 0.45 | 17.21 | 16.63 | 15.93 | 0.136∗ | 22.93 |
| R9 | 39 | 22 50 06.44 | 64 24 42.4 | 8.43 | 12.40 | 16.38 | 15.73 | 14.99 | 0.094 | 24.12 |
| R10 | — | 22 50 13.59 | 64 19 36.1 | 0.84 | 0.69 | 17.64 | 17.18 | 16.65 | — | — |
| R11 | — | 22 50 26.50 | 64 28 20.1 | 0.69 | 0.86 | 17.69 | 17.24 | 16.67 | — | — |
| R12 | — | 22 50 35.40 | 64 25 46.8 | 4.24 | 1.64 | 20.56 | 19.21 | 18.22 | — | — |
| R13 | — | 22 50 36.62 | 64 16 07.6 | 1.05 | 0.58 | — | 20.57 | 19.56 | — | — |
| R14 | —∗∗ | 22 50 38.22 | 64 20 21.1 | 1.00 | 0.49 | 16.73 | 16.33 | 15.88 | 0.093∗ | 22.20 |
| R15 | — | 22 50 46.78 | 64 17 00.9 | 1.88 | 2.77 | — | 23.22 | — | — | — |
| R16 | — | 22 50 50.62 | 64 27 19.8 | 0.29 | 0.31 | — | 22.92 | 21.35 | — | — |
4 Star-forming galaxies and AGNs in the A3921 central field
Of the 14 radio sources with optical identification, spectroscopic redshifts are available for seven of the host galaxies; of these, five lie at the cluster redshift. Due to their colour and size, we considered the two additional radio identifications without redshift information (R10 (see Sect. 3.3) and R11) as likely cluster member candidates. This section concentrates upon these 7 radio emitting cluster members (confirmed or candidate) and upon the star-forming and post-star-forming galaxies identified in the optical (F05).
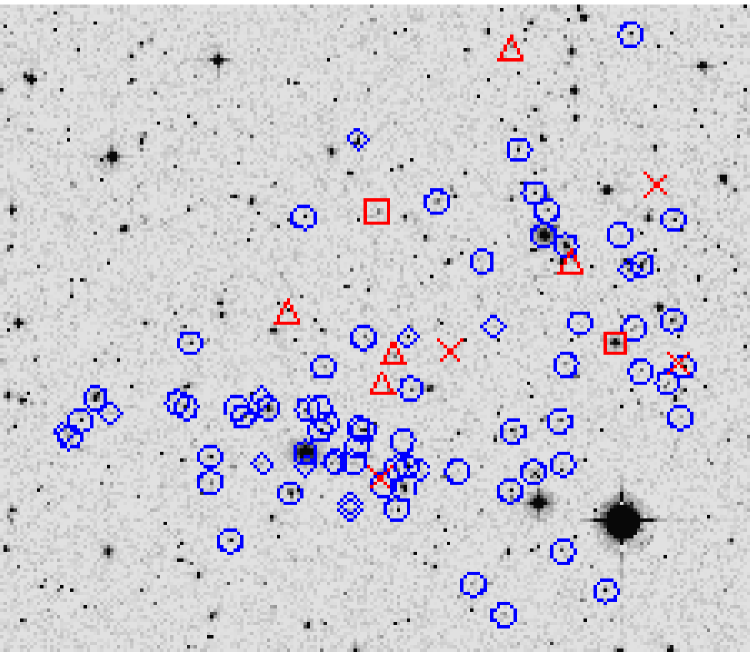
The optical spectroscopic analysis of the A3921 central field revealed the presence of 24 galaxies with spectral signatures of recent or ongoing SF (F05). The spectral classification was based on the presence and strength of the 4101 and [OII]3727 lines, observed in absorption and emission, respectively. Galaxies presenting an intermediate and strong but no [OII] emission were classified as post-star-burst/post-star-forming (k+a, 13 objects). The presence of [OII] emission was considered as a possible hint for ongoing SF. F05 found 11 emission line galaxies that, based on the MORPHS classification (Dressler et al. 1999; Poggianti et al. 1999), were divided into: i) two e(b)-type objects (i.e. possible star-burst galaxies, Poggianti et al. 1999), with strong [OII] emission (EWÅ), ii) four e(c)-type galaxies, with weak Balmer absorption and weak to moderate [OII] emission, classified as spirals forming stars at a constant rate by Poggianti et al. (1999), and iii) five e(a)-type objects, with strong absorption and measurable [OII] emission, suggested to be either dusty star-burst or post-star-burst galaxies with some residual SF (Poggianti et al. 1999). They are given in Table 5 (upper part). Most of the emission line galaxies are concentrated in the region of A3921-B and in between the two main sub-clusters A and B (see Fig. 22 in F05 and top panel of Fig. 1 in the present paper), suggesting that the ongoing merging event in A3921 could have triggered their SF/star-burst episode.
However, the [OII] emission line as an estimator of SF is fraught with problems (e.g. Kennicutt 1992), the most important of which is that it suffers from strong dust extinction. As a consequence, the SF activity can be strongly underestimated (or even not detected) if only determined with [OII]. Low-power radio emission from galaxies is, on the contrary, an extinction-free tracer of SF. Moreover, in our case the spectral range covered by the optical observations ( 3000–6000 Å) was not sufficient to discriminate between star-forming/bursting objects and AGNs among the emission-line galaxies. In order to test if the merging event has affected the star formation history (SFH) of A3921 galaxies we still need to:
-
•
divide emission line galaxies into star-forming/bursting objects and AGN;
-
•
verify that the emission line galaxies are really located in the collision region and not infalling field galaxies seen in projection at the cluster centre. In such a case the merging event would not be affecting either the SF or the nuclear activity of these objects;
-
•
test the hypothesis that all the detected k+a-type objects are in a post-star-bursting/post-star-forming phase. k+a galaxies could also be strongly obscured star-burst galaxies (e.g. Smail et al. 1999; Poggianti & Wu 2000), in which the [OII] line is totally extinguished. In such a case, star-bursting galaxies would not be concentrated only in the collision region of A3921, but spread all over the cluster (see Fig. 18 of F05). The connection between the sub-clusters’ merger and the on-going star-burst episode would obviously be less probable.
We thus combined the optical and radio observations in order to measure the SFR of the cluster members independently from dust extinction and classify the active galaxies of the A3921 central field either as star-forming/bursting objects or AGNs.
4.1 Emission-line galaxies: optical/radio comparison
4.1.1 Optical and radio SFR
To obtain star-formation rates from radio luminosities, we used the relation from Condon (1992), which was estimated assuming solar abundances and a Salpeter initial mass function (IMF) above 5 M⊙. In order to estimate the SFR of stars more massive than 0.1 M⊙, we divided Condon’s relation by 0.18 (e.g. Serjeant et al. 2002):
| (4) |
where is the non-thermal luminosity at the frequency (in our case 1.344 GHz), and is the non-thermal spectral index. The SFR of the 11 emission line galaxies detected in A3921 central field are summarised in Table 5.
We also estimated the SFR of the star-forming galaxies in A3921 from their [OII] emission, adopting the relation by Kennicutt (1998)333SFRs from EW([OII]) had already been estimated in F05. Here we re-estimated these SFRs with the same IMF adopted in the previous radio relation.:
| (5) | |||||
where we used the relation by Kennicutt (1992) to determine the luminosity of the [OII] emission line from a) its equivalent widths (EW([OII])), b) the integrated broad-band luminosity of the galaxy in solar units (), and c) a reasonable value for the extinction correction (). In Table 5 we give the SFR from EW([OII]) both with and without a correction for dust-extinction. When included, a canonical value for extinction (1 mag for ) has been applied. In Eq. 5 the errors can be considerably large ( 30–50%), mostly due to the adopted relation between the B-band and [OII] line luminosities (Kennicutt 1992).
The results are summarised in the upper part of Table 5, which lists:
-
-
Columns (1) & (2): optical and radio ID (corresponding to Table A in F05 and Table 3 in this paper, respectively).
-
-
Columns (3) & (4): optical coordinates.
-
-
Columns (5) & (6): redshift and spectral type of the source.
-
-
Column (7): Log of the absolute spectral luminosity at 1.344 GHz (W/Hz). For the sources not detected at radio wavelengths, we estimated an upper limit (at 3 significance level) using 0.147 mJy/beam and =0.8.
-
-
Columns (8) & (9): SFR of the source estimated from its [OII] line luminosities, without () and with () the extinction correction.
-
-
Column (10): SFR estimated from the 1.344 GHz luminosity of the source.
| Sp. Type | |||||||||
| (J2000) | (J2000) | ( | ( | ( | ( | ||||
| # | # | ) | M) | M) | M) | ||||
| 17 | — | 22 48 59.0 | 64 21 11.8 | 0.094 | e(a) | 21.42 | 0.28 | 0.70 | 3.68 |
| 45 | — | 22 49 41.5 | 64 26 24.1 | 0.085 | e(c) | 21.33 | 0.04 | 0.11 | 2.98 |
| 57 | R2 | 22 48 39.8 | 64 19 22.2 | 0.091 | e(c) | 21.82 | 0.25 | 0.62 | 7.94 |
| 69 | R3 | 22 48 49.0 | 64 23 11.2 | 0.097 | e(b) | 22.59 | 5.64 | 14.09 | 50.35 |
| 73 | — | 22 48 34.8 | 64 23 39.9 | 0.095 | e(c) | 21.43 | 0.26 | 0.64 | 3.76 |
| 81 | — | 22 49 41.1 | 64 24 05.6 | 0.097 | e(a) | 21.45 | 0.05 | 0.12 | 3.93 |
| 82 | — | 22 49 38.4 | 64 23 23.8 | 0.099 | e(a) | 21.47 | 0.16 | 0.40 | 4.11 |
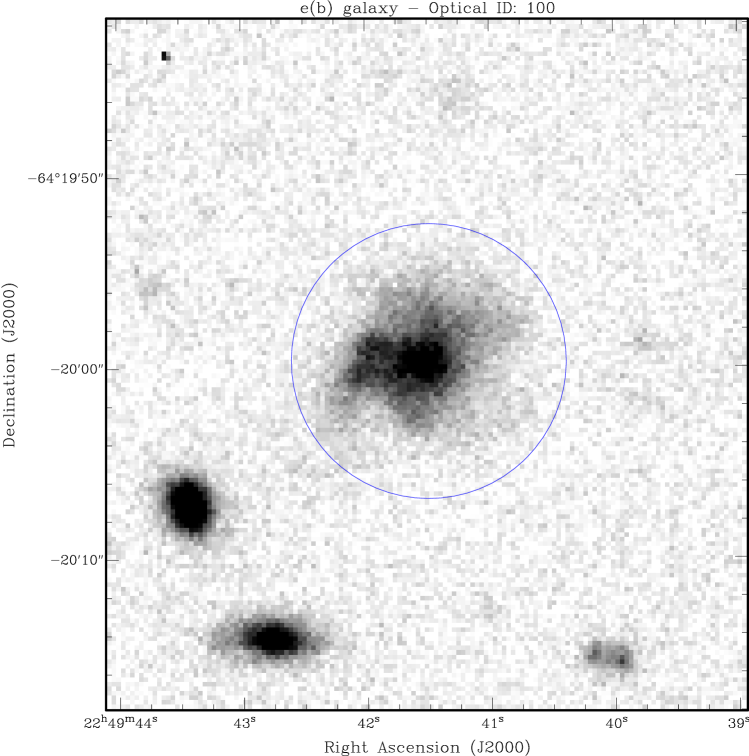
| 100 | — | 22 49 41.6 | 64 19 59.0 | 0.086 | e(b) | 21.34 | 0.70 | 1.74 | 3.05 |
| 169 | — | 22 50 01.8 | 64 22 21.8 | 0.085 | e(a) | 21.33 | 0.12 | 0.31 | 2.98 |
| 181 | — | 22 49 26.1 | 64 23 21.4 | 0.095 | e(c) | 21.43 | 0.10 | 0.24 | 3.76 |
| 226 | — | 22 49 12.0 | 64 16 03.9 | 0.100 | e(a) | 21.48 | 0.17 | 0.43 | 4.20 |
| 39 | R9 | 22 50 06.4 | 64 24 42.4 | 0.094 | k | 24.12 | |||
| 52 | R5 | 22 49 04.8 | 64 20 35.6 | 0.093 | k | 24.00 | |||
| —∗ | R14 | 22 50 38.2 | 64 20 21.1 | 0.093 | — | 22.20 | |||
| — | R10 | 22 50 13.6 | 64 19 36.1 | — | — | 22.26 | |||
| — | R11 | 22 50 26.5 | 64 28 20.1 | — | — | 22.67 |
These results are discussed in the following section.
4.1.2 Emission line galaxies with detected radio emission
Among the 11 emission-line cluster members detected in A3921 by F05, only two have detectable radio emission at our flux limit (0.15 mJy/beam, 3 level).
One (R2) is very likely a classical spiral galaxy, as suggested by most of its observed properties. Firstly, based on the presence and strength of [OII] emission and absorption lines, F05 classified R2 as an e(c)-type object (MORPHS classification; Dressler et al. 1999). Following Poggianti et al. (1999), e(c) spectra are typical for present-day spirals. This conclusion agrees with the optical morphology and the radio SFR of R2, typical of late-type objects. The red colour of this galaxy and the low SFR[OII] (significantly lower than the radio estimate) could be due to the fact that, in the optical, the younger (disk) component of the galaxy is much more obscured by dust lanes than the old bulge.
The other emission-line galaxy detected at radio wavelengths (R3) is associated with the third brightest cluster galaxy (BG3 in F05), and it is located at the barycentre of the X-ray emission of A3921-B (B05). In optical it is characterised by: a) an elliptical morphology; b) red and colours; c) a high radial velocity offset from the mean cluster redshift (+788 km/s); d) strong [OII] emission (EW([OII])=65 Å). Based on its spectral properties BG3 was classified as a star-burst galaxy by F05, but, based on its nebular emission line ([OII]), it could also be a Seyfert or a LINER. Unfortunately, the very limited spectral range covered by the optical observations did not allow F05 to use any diagnostic diagrams to distinguish between these two hypotheses.
We therefore analysed in detail the radio and X-ray (B05) properties of BG3. Following Morrison & Owen (2003) and correcting for our cosmology, we considered as AGNs the radio galaxies with Log (22.73, and as star-forming objects those below this limit. The radio luminosity of BG3 (=22.59) is on the upper side of the luminosity distribution of star-forming galaxies, albeit very close to the boundary with AGNs. Thus, from a statistical point of view, BG3 has radio properties typical of star-forming/bursting objects, but we cannot completely exclude the faint AGN hypothesis.
The XMM analysis of A3921 by B05 revealed a diffuse extended X-ray emission for BG3, with a thermal spectrum. This points against an AGN origin of the emission, and we suggest that the intense star-burst episode observed in BG3 has probably injected hot gas into the galaxy’s inter-stellar medium (ISM). Both the red colours and the strong difference between the optical and radio SFR estimates (see Table 5) could be due to dust extinction. Actually, it has been shown that, in clusters, star-forming galaxies heavily affected by dust extinction are more centrally concentrated than star-forming galaxies in general (Miller & Owen 2002). MIR observations also revealed a higher fraction of dusty-star-burst galaxies in dynamically young clusters (Coia et al. 2005), as in the case of A3921. Therefore, we concluded that the red colours of R2 and R3 are probably due to their dusty star-forming/bursting nature (e.g. Wolf, Grey & Meisenheimer 2005).
4.1.3 Emission line galaxies without detected radio emission
None of the other nine emission line cluster members were detected at the 3 sensitivity limit of our radio observations. These galaxies are thus characterised by SFRs lower than .
We suggest that the SF properties of the emission-line galaxies detected in the collision region of A3921 may be due to cluster environmental effects. Most of them are brighter than the “dwarfs/giants” magnitude cut applied by Poggianti et al. (2004) in their analysis of the Coma cluster (see F05), and they all have SFRs lower than those typical of gas-rich spirals (, e.g. Kennicutt 1998). They could be gas-poor objects, whose gas deficiency is related to cluster environmental effects, and in particular to hydrodynamical interactions between the galaxy ISM and the ICM (ram-pressure and viscous stripping, thermal evaporation; see Boselli & Gavazzi 2006 for a recent and complete review).
The sub-cluster merger in A3921 could have subsequently enhanced the SF activity of the galaxies located in the collision region. It has been shown that both dynamical interactions with the ICM and tidal interactions with nearby companions and/or the cluster potential can induce SF in cluster galaxies (e.g. Gavazzi et al. 1995; Moss & Whittle 2000; Bekki 1999). Actually, these physical mechanisms are particularly effective in merging clusters since: a) the ISM compression due to galaxy-ICM interactions is most efficient where the density and the temperature of the ICM reach their maximum (i.e. around the ICM compression bar in A3921 detected by B05), and b) the time-varying gravitational potential of merging clusters enhances the rate of galaxy encounters and drives efficient transfer of gas to the central region of galaxies, triggering a starburst.
We can extract more physical information about some of the emission-line galaxies without radio emission at the 3 level by comparing in more detail their optical and radio properties. One of these objects has spectral features typical of star-bursting galaxies (IDO=100 in Table 5), i.e. strong [OII] emission (EW40 Å). Its distorted optical morphology (Fig. 4) suggests that the observed star-burst episode could be due to interaction with another galaxy.
Three galaxies have spectra typical of spirals forming stars at a constant rate (e(c)), while the remaining 5 belong to the e(a) class, that, based on spectral modelling (Poggianti et al. 1999), could be either dusty star-burst or post-star-burst galaxies with some residual SF. Up to now only e(a) galaxies belonging to the first class have been detected, showing extremely strong dust extinction factors (median value 12 mag, Duc et al. 2002). For our e(a) objects, by dividing the 8th and 10th columns of Table 5, we find SFR1.4GHz/SFR13–79, corresponding to dust extinction values 5–30 mag (lower than 12 mag for 4/5 of the sample). This means that, for extinction higher than these lower limits, we should observe the e(a) galaxies if they were dusty star-burst. Since the estimated extinction factors are comparable to those found by Duc et al. (2002) and we detected none of the e(a) galaxies at radio wavelengths, we suggest that at least a fraction of them could not be dusty star-burst, but post-star-burst galaxies with some residual SF. This hypothesis has to be tested with more sensitive observations (e.g. higher-resolution spectroscopy covering a wider wavelength range, IR and deeper radio observations) as our SFR determination has big errors. The highest uncertainty is related to the SFR derived from the [OII] line, which suffers from several problems other than extinction (e.g. slit aperture and metallicity effects).
4.1.4 k+a galaxies
Among the cluster members observed by F05, 13 are characterised by an intermediate or strong line in absorption and no detectable [OII]3727 line in emission (k+a galaxies; Dressler et al. 1999). These galaxies are generally interpreted as objects that have no significant ongoing SF, but that were forming stars in the recent past (1-1.5 Gyr). They are therefore usually classified as post-star-forming (moderate Balmer lines, EW(4–5 Å) or post-star-bursting objects (strong Balmer lines, EW(4–5 Å). However, it has been suggested that k+a (like e(a)) might also be star-bursting galaxies whose emission lines are invisible in the optical due to heavy or selective dust extinction (e.g. Smail et al. 1999; Poggianti & Wu 2000; Goto 2004). Understanding the SF properties of the k+a galaxies in A3921 is important firstly to address the debated nature of this class of objects, and secondly to confirm (or reject) the spatial correlation between the detected star-forming objects and the collision region of the cluster.
None of our target k+a galaxies was detected down to our 2 sensitivity limit (SFR at the mean redshift of the cluster and assuming =0.8). This means that no galaxies of this spectral class host dust obscured SF activity up to our sensitivity limit (). Based also on the moderate equivalent width and on the red colours of the k+a galaxies detected in A3921 (F05), we can therefore conclude that they are not strong dusty star-burst, and, in agreement with the results found by Duc et al. (2002) in the cluster A1689, we suggest that these objects are in a post-star-forming phase as predicted by their spectral properties. Due to the limit in sensitivity of our radio observations, we cannot, however, totally exclude the possibility that they are dust-obscured galaxies forming stars at a very low rate. The biggest issue in this respect is that the spectroscopic classification of these objects is based solely on the [OII] emission and Balmer absorption lines. The importance of having information as well on the line has been shown (Goto 2004). An ongoing spectroscopic follow-up covering a wider spectral range will allow us to definitively test the post-star-forming nature of the k+a galaxies in A3921.
4.2 Radio galaxies
In the bottom panel of Table 5 we list the five confirmed or candidate cluster members i) with detected radio emission, and ii) without emission lines, or for which the spectral type is unknown. Three of them (R10, R11 and R14) are located in the Eastern region of A3921-A (i.e. not in the collision region), and they are very likely gas rich, dusty star-forming late-type galaxies, since they have: i) radio luminosities below the AGN/SF boundary (Log (22.73, see Sect. 4.1.2), ii) spiral-like morphologies (R14 also shows a disturbed morphology, suggesting that the SF activity could be triggered by galaxy-galaxy interaction), and iii) red colours probably due to dust extinction. The remaining two radio emitting cluster members (R9 and R5) are on the contrary AGNs, their optical morphology and spectrum being typical of early-type galaxies and their radio luminosity being well above the AGN/SF boundary. We therefore detected only two AGNs in the central field of A3921. A similar number of AGNs was detected in the nearby clusters Coma and A1367 (Gavazzi & Boselli 1999). In the central 1.81.5 region of these two systems, 3 and 2 galaxies respectively have radio luminosities above the adopted AGN/SF boundary (from Table 1 of Gavazzi & Boselli 1999).
The small number of radio galaxies did not allow us to determine the radio luminosity function (RLF) for early-type galaxies. We compared the number of detected radio galaxies with the result of Ledlow and Owen (1996), who detected 12% of galaxies with optical magnitude R17.5 and radio luminosity Log 22.02 (scaled to our cosmological parameters). In the same radio and optical range, we found six cluster members, of which three have clear elliptical morphology, and two can be safely classified as AGN. Due to the lack of complete spectroscopy, we assumed that all the red sequence galaxies with R17.5 belong to A3921, finding in total 36 galaxies. Therefore, the fraction of radio emitting elliptical galaxies in our sample is 8%, and the fraction of AGN is 6%. Taking into account the uncertainty on the total number of galaxies and the fact that these percentages are derived from very small numbers, we conclude that our result is not significantly different from that of Ledlow and Owen (1996).
5 The peculiar radio source SUMSS J224857642059 (R5).
5.1 Total intensity and spectral index images
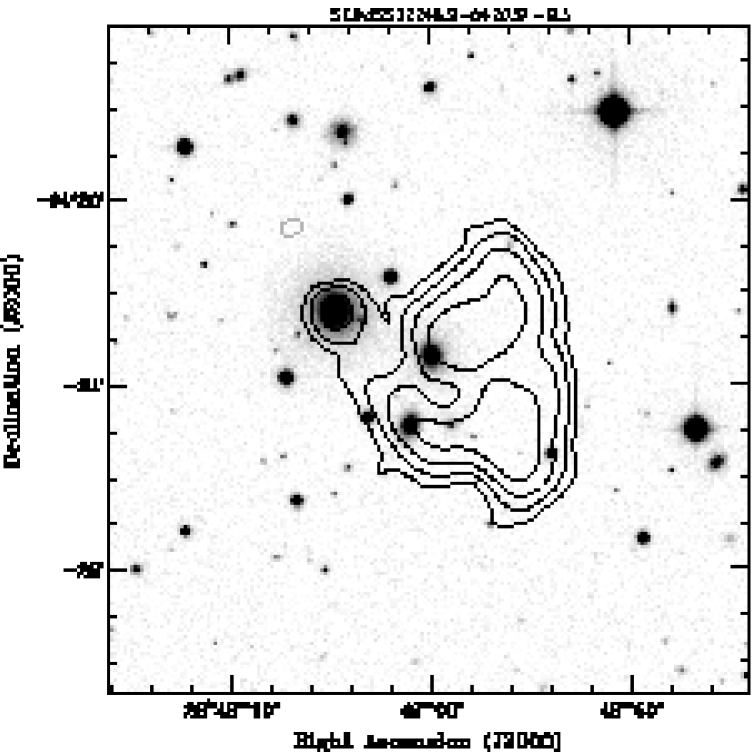
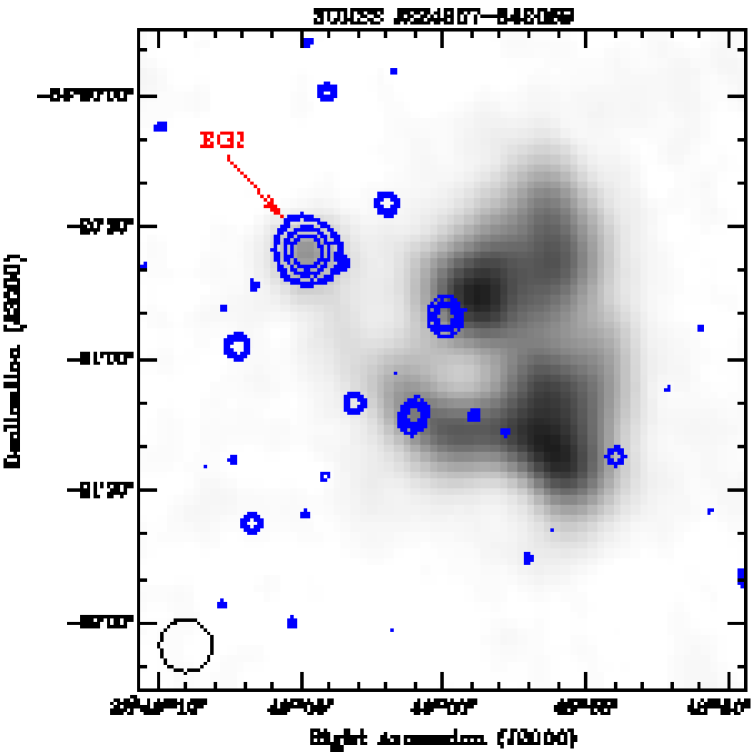
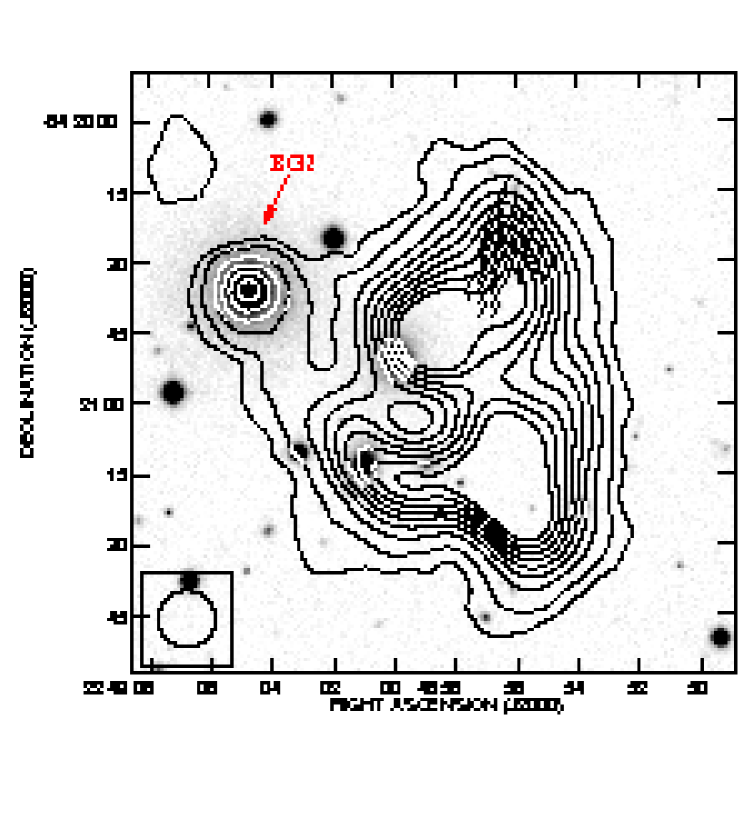
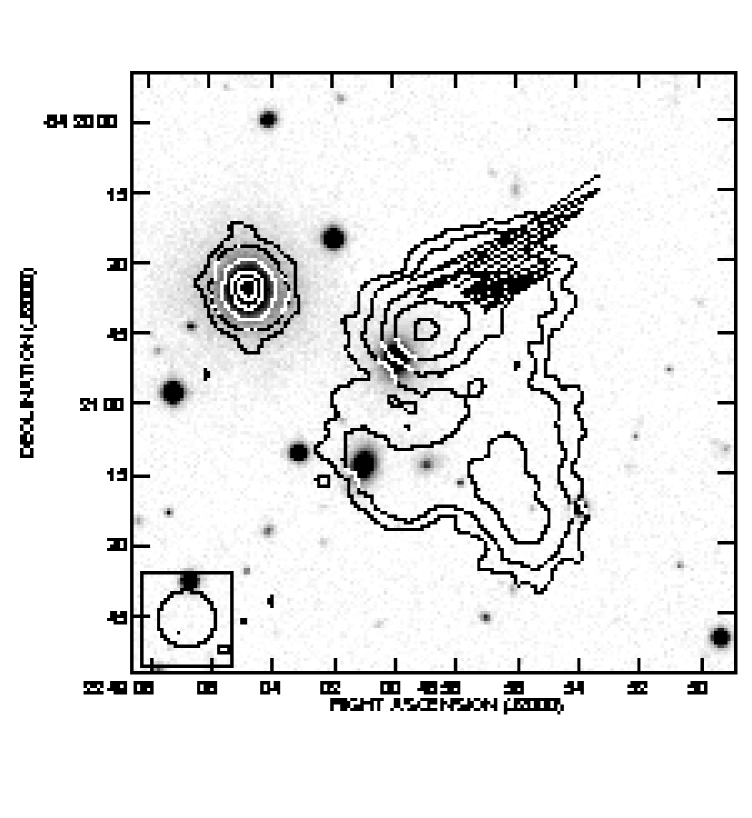
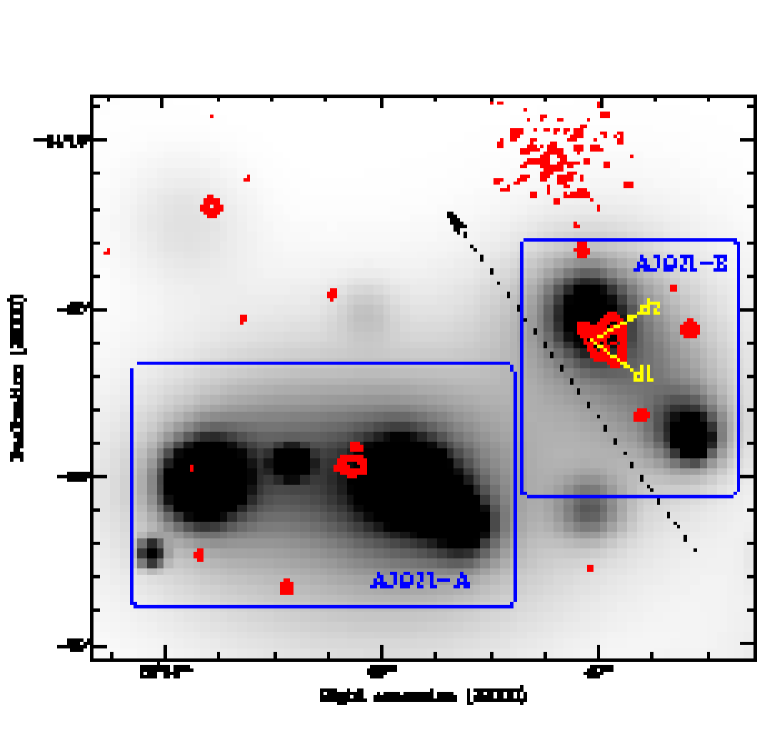
The most interesting radio emission observed in the central field of A3921 is the extended source SUMSS J224857-642059 (R5) (see Fig. 5). In Fig. 6, we have superimposed the 1.344 GHz radio contours on the R-band optical image of A3921 from F05. The radio component in the North-East extremity of R5 is coincident with a very bright galaxy () corresponding to the second brightest cluster member (“BG2” in F05), whose colour and spectrum are typical of an early-type object. BG2 is the dominant galaxy of one of the two colliding sub-clusters revealed by the combined optical/X-ray analyses of the cluster by F05 and B05.
The most likely hypothesis is that R5 is a narrow-angle tail (NAT) radio galaxy, whose core component is associated with the galaxy BG2. A source with very similar structure has been detected by Gregorini & Bondi (1989) in A115. The jets in R5 are not visible at our resolution, and the tails of diffuse emission, embedded in a common low-brightness envelope, are oriented along a NE/SW (d1) and a SE/NW (d2) axis (Fig. 8). The main elongation axis of the tail (d1) is roughly aligned with the direction along which A3921-B is tangentially traversing A3921-A (SW/NE, see Fig. 7). This agrees with the accepted view that NAT morphologies are the result of the ram-pressure exerted by the ICM on the radio plasma, the ram-pressure being due to relative motion between the ICM and the radio emitting galaxy (Blandford & Rees 1974). The radial velocity offset of BG2 from the mean radial velocity of the cluster is 145 79 km/s. However, the proper velocity of BG2 with respect to the ICM could be higher, since it has been shown that the merging axis of A3921-B is nearly on the plane of the sky (F05), resulting in a small velocity component along the line of sight.
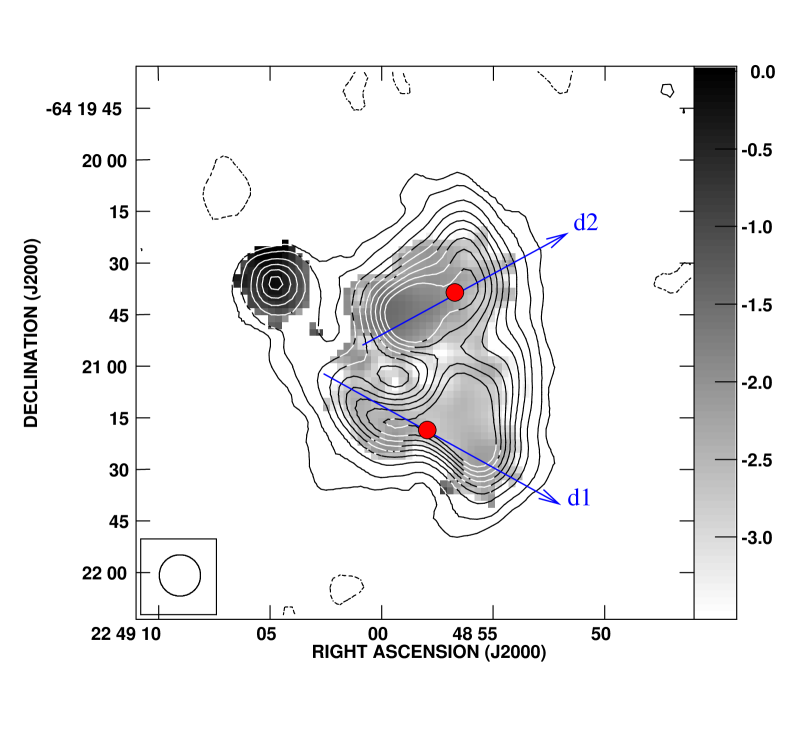
We obtained the spectral index map of the radio source R5 by combining the images at 1.344 GHz and 2.368 GHz with the AIPS task COMB (Fig. 8). We note a steepening of the spectrum going from the region around BG2 to the extended emission, supporting the classification of R5 as a tailed radio galaxy. In particular, the core component coincident with BG2 shows a significantly flat spectral index (), with a steepening of the spectrum to on the SW side.
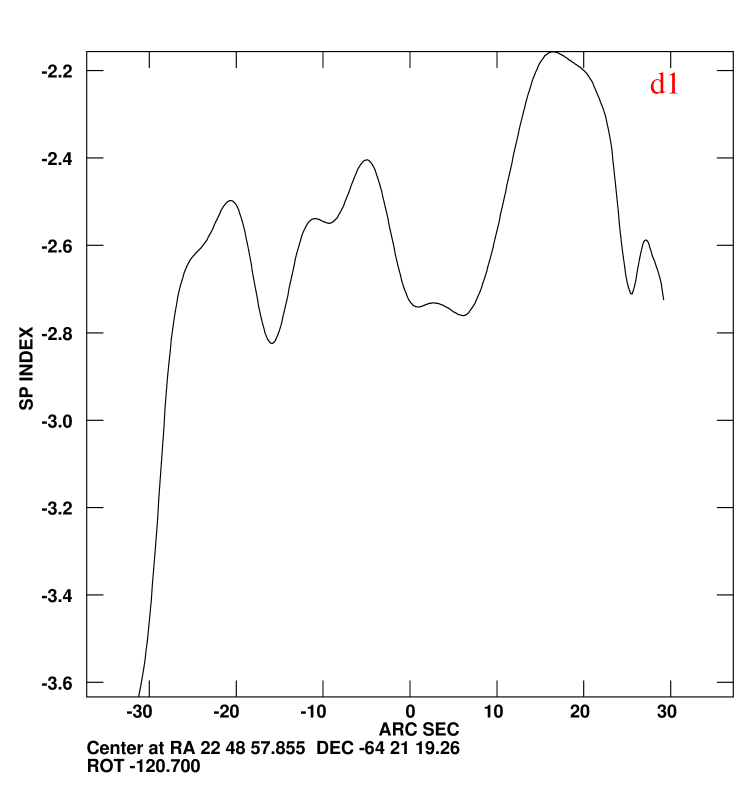
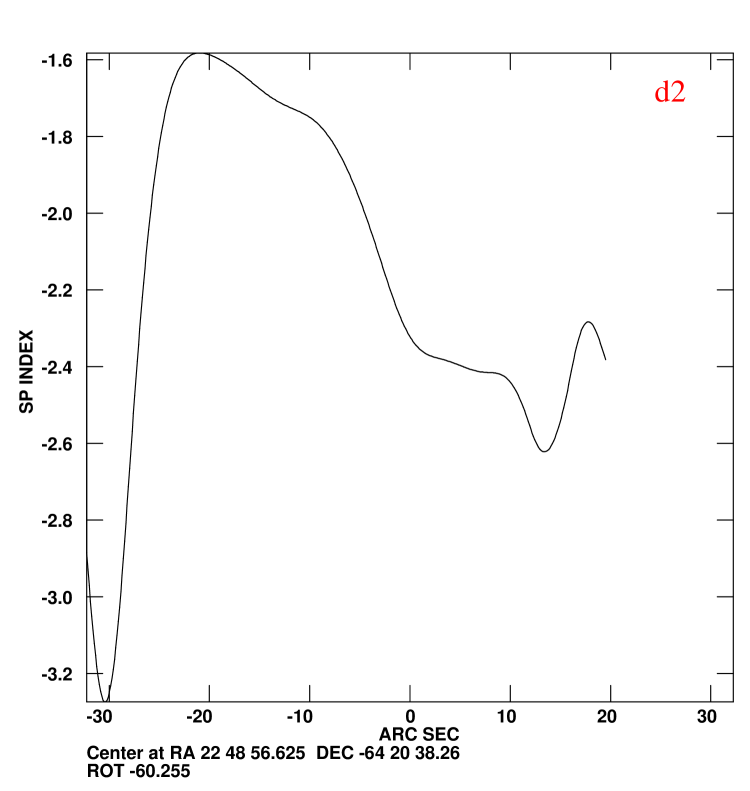
The trend of the spectral index of the R5 tails along the main axes (d1 and d2 in Fig. 8) is shown in Fig. 9. The tail spectrum is very steep in both directions. We found a steepening spectral index going away from BG2 along d2, while the spectrum shows more jumps along d1.
The physical properties of the extended radio source R5 are summarised in Table 6. Equipartition magnetic field was calculated with the standard assumptions of equal energy density in protons and electrons, a magnetic field filling factor of 1, and a spectrum extending from 10 MHz to 100 GHz. The spectral index was taken =1.5 and the source depth along the line of sight of 50 kpc. The source age given in the Table refers to lifetime of electrons radiating at 1.4 GHz in a magnetic field taken at the equipartition value.
| Core | |
|---|---|
| Core | |
| Optical id. | |
| Optical id. | |
| Angular size (1.344 GHz) | |
| Physical size (1.344 GHz) | |
| Flux density (1.344 GHz) | 43.7 mJy |
| Power (1.344 GHz) | |
| 22.5 rad/ | |
| 4.8 rad/ | |
| 33.5 rad/ | |
| Heq | 3.6 G |
| Age | 8.7 yr |
5.2 Polarization images
Images in the Stokes parameters U and Q were produced analogously to the I maps of the cluster by INVERTing, CLEANing and RESTORing the data with the MIRIAD software. In particular, for each pointing, the () data at the same frequency of all the different configurations were handled together. We restored the 2.368 GHz maps with a beam size of both (i.e. 13 cm beam size), and (i.e. 22 cm beam size). The images of each field were then mosaiced using the task LINMOS.
Using the MIRIAD task IMPOL, we derived from the I, Q and U maps the images of: a) the polarised intensity , b) the degree of polarization , c) the position angle of polarization (defined to be positive North through East) , and d) the associated errors. These maps were all blanked when the error in the position angle image was greater than or when the ratio in the polarised intensity map was less than three.
The source R5 is polarized in the Northern region both at 1.344 and 2.368 GHz. In the radio images presented in Fig. 6 the vectors indicate the orientation of the projected E-field and are proportional in length to the fractional polarization. The mean fractional polarization is 11% and 40% respectively at 1.344 and 2.368 GHz, reaching values of 34% and 60% at the Northern boundary of the source, whereas for the Southern tail we can set upper limits of 6% and 20% at 1.344 and 2.368 GHz respectively. A possible interpretation of the different polarization percentage in the two tails is that the source is strongly affected by projection effects.
As the polarized emission from a radio source passes through a magnetized, ionized plasma, its plane of polarization will be rotated by the Faraday effect:
| (6) |
where and are the observed and intrinsic polarization angles respectively and is the wavelength at which observations are performed. is the Rotation Measure, which depends on the product of the electron density () and magnetic field along the line of sight (). Due to this effect, the plane of polarized radiation from cluster and background radio galaxies may be rotated if magnetic fields are present in the ICM.
We derived the rotation measure () and the zero-wavelength position angle () maps by fitting Eq. 6 to the position angle images of the radio galaxy R5 at 1.344 GHz and 2.368 GHz with a resolution of 12.0′′. For this, we used the MIRIAD task IMRM. The measured RM values range from 11.2 to 33.5 rad/. They are consistent with the Galactic contribution, which in the region of A3921 is expected to be about 30 rad/ (Simard-Normandin et al. 1981). This suggests that the cluster magnetic field in this region may be low or mostly perpendicular to the line of sight. The orientation of the magnetic field of R5 is roughly longitudinal as commonly found in tailed radio sources (Dallacasa et al. 1989; Feretti et al. 1998).
6 Discussion and conclusions
6.1 Star-forming galaxies and AGNs: possible connections with the ongoing merger
In this paper we presented the 22 and 13 cm ATCA observations of the galaxy cluster A3921. We concentrated our analysis on the central field of the cluster (0.075 deg2), which hosts two merging sub-clusters (A3921-A and A3921-B) that have not yet undergone the first core-core encounter (B05; F05; Kapferer et al. 2006). Our main aim was to closely investigate the possible connection between the on-going merging event and the SF properties of cluster members suggested by F05. We detected 17 radio sources, among which seven are cluster galaxies (confirmed or candidate). Based also on their optical and X-ray properties, the latter were classified as: a) two AGNs (R5 and R9), b) four late-type, gas rich galaxies (R2, R10, R11 and R14), and c) one (R3) strong star-burst.
Seven radio emitting galaxies were therefore detected in the central field of A3921 at our 5 sensitivity level, of which four are late-type objects. In an equivalent cluster region and at the same flux limit (scaled to the proper ), 12 galaxies were detected at 1.4 GHz both in A1367 and in Coma, of which nine and seven, respectively, have late-type morphologies (from Table 1 by Gavazzi & Boselli 1999). Assuming Poissonian noise, we thus found a slight deficiency ( level) of radio galaxies in A3921 with respect to the lower- merging clusters Coma and A1367.
Among the 11 emission-line galaxies identified by F05, only two (the previously mentioned R2 and R3) were detected at our 3 sensitivity level (Log 21.4. The remaining nine objects are located in the collision region of the merging cluster. The lack of radio emission gave us an upper limit for their SFR unbiased by dust extinction (SFR). Based on their observational properties (optical and radio luminosity, colour, presence and strength of emission lines in their spectra, SFR) and on their position in the cluster, we thus suggested that most of the emission-line galaxies detected in the collision region of A3921 are not infalling, gas-rich objects. Their SF episode would instead be related to the on-going sub-cluster collision. The merging event could have favoured both ICM-galaxy and tidal (galaxy-galaxy and cluster-galaxy) interactions, which have been shown to be able to trigger SF (e.g. Evrard 1991; Moss & Whittle 2000; Poggianti et al. 2004; Bekki 1999; Kapferer et al. 2005; Boselli & Gavazzi 2006). The cluster merger is probably also responsible for the strong star-burst in R3 (BG3 in F05 and B05): the compression of the ICM on the ISM of this object is probably very strong, due both to the high ICM density (it is located at the X-ray centre of A3921-B, B05) and to the high proper velocity of this object (F05).
Note that, excluding R3, we did not detect any gas-rich, star-forming galaxy in the collision region (Fig. 1 and Table 5). As summarised at the beginning of this Sect. (point b)), four gas-rich, star-forming galaxies have been detected through our radio observations. All of them are located in the external parts of the merging sub-clusters, and they probably are infalling, field spirals, whose gas reservoir has not yet been emptied by cluster environmental effects (Dressler & Gunn 1983).
The absence of radio emission in all the k+a galaxies detected in A3921 confirms that they are not dusty star-bursting objects. This result agree with the conclusion of F05 and of previous analyses (e.g. Duc et al. 2002) that k+a objects are observed during a post-star-forming phase. It also confirms that, in the A3921 central field, star-forming objects are concentrated in the collision region.
Our counts of radio emitting elliptical galaxies are not significantly different from the general cluster RLF derived by Ledlow and Owen (1996). Similar numbers of early-type objects with radio luminosity typical of AGNs were detected in two other low- clusters, i.e. Coma and A1367 (Gavazzi & Boselli 1999). Analogous results were also found by Venturi et al. (2001) in the pre-merging cluster A3528, suggesting that, in their early stages, cluster mergers do not influence the emission from radio-loud AGNs.
6.2 The peculiar radio galaxy SUMSS J224857-642059 (R5)
In order to understand the nature of the radio galaxy SUMSS J224857-642059 (R5) and the origin of its peculiar morphology, we have to take into account the following observational evidence:
- •
-
•
its location at the centre of the less massive of two merging sub-clusters (A3921-B);
-
•
its distorted tailed radio emission, without collimated jets, and roughly aligned with the merging axis (SW/NE). A NW elongation is, however, also present, and this shows a high polarized fraction and a nearly transverse intrinsic magnetic field;
-
•
its steep total spectral index (=2.4), typical of tailed radio sources in clusters of galaxies;
-
•
the significantly flatter spectrum of the component associated with BG2 with respect to the extended emission ( and ).
We therefore consider that R5 is a NAT radio source associated with BG2, with a core component in its Northernmost side, and an extended ( kpc) tail. This latter is distorted towards NW, possibly due to a lower local density of the intra-cluster gas revealed by the XMM observations of B05. The tail morphology is very likely explained by ram-pressure effects due to the relative motion between the ICM and BG2, in turn related to the merging event of the host sub-cluster (A3921-B). The total radio power of R5 at 1.344 GHz is Log =24.0. Its total flux density is dominated by the extended emission located outside the optical galaxy, with a flux density ratio of 18 between the extended and the core component ( and mJy respectively).
R5 does not show visible jets and the emission in the tail is very steep (), suggesting that electrons are suffering strong radiation losses. The diffuse component of R5 would therefore be a ‘dying’ tail, which has been partly detached from an earlier period of activity of the BG2 radio galaxy and whose final evolution is dominated by synchrotron losses. The extended emission is now presumably supported and distorted by the ICM pressure. The strong polarization at the extreme of the NW component of the tail suggests that the radio jet has encountered a denser (or higher pressure) region leading to magnetic field compression.
Acknowledgements.
CF is very grateful to Lister Staveley-Smith for his valuable help in ATCA data reduction. We warmly thank Vincent McIntyre for having provided the new version of the script “quickfit”. We thank Christophe Benoist, Wolfgang Kapferer, Rocco Piffaretti, Alberto Cappi, Pierre-Alain Duc, Elaine Sadler and Jean-Luc Sauvageot for very fruitful discussions. We are indebted to the referee, Giuseppe Gavazzi, for useful suggestions which helped to improve the paper. CF acknowledges financial support of Sydney University, Australia Telescope National Facility, Marie Curie individual fellowship MEIF-CT-2003-900773, Austrian Science Foundation (FWF) through grant number P15868, and Tiroler Wissenschaftsfonds (TWF). The Australia Telescope Compact Array is part of the Australia Telescope which is funded by the Commonwealth of Australia for operation as a National Facility managed by CSIRO.References
- (1) Arnaud , M., Rothenflug, R., Böhringer, H., Neumann, D., & Yamashita, K., 1996, uxsa.coll, 163
- (2) Baldi, A., Bardelli, S., & Zucca, E., 2001, MNRAS, 324, 509
- (3) Bekki, K., 1999, ApJL, 510, 15
- (4) Belsole, E., Sauvageot, J.-L., Pratt, G. W., & Bourdin, H., 2005, A&A, 430, 385 (B05)
- (5) Blandford, R.D., & Rees, M.J., 1974, MNRAS, 169, 395
- (6) Boselli, A., & Gavazzi, G., 2006, PASP, 118, 517
- (7) Butcher, H., & Oemler, A., 1978, ApJ, 219, 18
- (8) Caldwell, N., Rose, J. A., Sharples, R. M., Ellis, R. S., & Bower, R. G., 1993, AJ, 106, 473
- (9) Coia, D., McBreen, B., Metcalfe, L., et al., 2005, A&A, 431, 433
- (10) Condon, J.J., 1997, PASP, 109, 166
- (11) Condon, J.J., 1992, ARA&A, 30, 575
- (12) Dallacasa, D., Feretti, L., Giovannini, G., & Venturi, T., 1989, A&AS, 79, 391
- (13) Dressler A., Smail, I., Poggianti, B.M., Butcher, H., Couch, W.J., Ellis, R.S., & Oemler, A., 1999, ApJ, 122, 51
- (14) Dressler, A., 1987, in Nearly Normal Galaxies: From the Planck Time to the Present, ed S. Faber (New York: Springer), 276
- (15) Dressler A., & Gunn, J.E., 1983, ApJ, 270, 7
- (16) Duc, P.A., Poggianti, B.M., Fadda, D., Elbaz, D., Flores, H., Chanila, P., Franceschini, A., Moorwood, A., & Cesarsky, C., 2002, A&A, 382, 60
- (17) Dwarakanath, K.S., & Owen, F.N. 1999, AJ, 118, 625
- (18) Evrard, A.E., 1991, MNRAS, 248, 8
- (19) Feretti, L., Giovannini, G., Klein, U., Mack, K.-H., Sijbring L.G., & Zech, G., 1998, A&A, 331, 475
- (20) Ferrari, C., Benoist, C., Maurogordato, S., Cappi, A., & Slezak, E., 2005, A&A, 430, 19 (F05)
- (21) Fujita, Y., Takizawa, M., Nagashima, M., & Enoki, M., 1999, PASJ, 51, L1
- (22) Gavazzi, G., Cortese, L., Boselli, A., et al., 2003, ApJ, 597, 210
- (23) Gavazzi, G., & Boselli, A., 1999, A&A, 343, 93
- (24) Gavazzi, G., Contursi, A., Carrasco, L., Boselli, A., Kennicutt, R., Scodeggio, M., & Jaffe, W., 1995, A&A, 304, 325
- (25) Giacintucci, S., Venturi, T., Bardelli, S., Dallacasa, D., & Zucca, E., 2004, A&A, 419, 71
- (26) Goto, T., 2004, A&A, 427, 125
- (27) Gregorini, L., & Bondi, M., 1989, A&A, 225, 333
- (28) Hopkins, A.M., Afonso, J., Chan, B., Cram, L.E., Georgakakis, A., & Mobasher, B., 2003, AJ, 125, 465
- (29) Kapferer, W., Ferrari, C., Domainko, W., et al., 2006, A&A, 447, 827
- (30) Kapferer, W., Knapp, A., Schindler, S., Kimeswenger, S., & van Kampen, E., 2005, A&A, 438, 87
- (31) Kennicutt, R.C., 1998, ARA&A, 36, 189
- (32) Kennicutt, R.C., 1992, ApJ, 388, 310
- (33) Katgert, P., Mazure, A., den Hartog, R., Adami, C., Biviano, A., & Perea, J., 1998, A&AS, 129, 399
- (34) Katgert, P., Mazure, A., Perea, J., et al., 1996, A&A, 310, 8
- (35) Ledlow, M.J., & Owen, F.N., 1996, AJ, 112, 9
- (36) Mazure, A., Katgert, P., den Hartog, R., et al., 1996, A&A, 310, 31
- (37) Miller, N.A., Owen, F.N., & Hill, J.M., 2003, AJ, 125, 2393
- (38) Miller, N.A., & Owen, F.N., 2002, AJ, 124, 2453
- (39) Morrison, G.E., & Owen, F.N., 2003, AJ, 125, 506
- (40) Moss, C., & Whittle, M., 2000, MNRAS, 317, 667
- (41) Murgia, M., Parma, P., de Ruiter, H. R., Mack, K.-H., & Fanti, R., 2004, in “X-Ray and Radio Connections”, eds. Sjouwerman, L.O. & Dyer, K.K., http://www.aoc.nrao.edu/events/xraydio/[meetingcont/8.15_murgia.pdf]
- (42) Owen, F.N., Keel, W.C., Ledlow, M.J., Morrison G.E., & Windhorst, R.A., 2005a, AJ, 129, 26
- (43) Owen, F.N., Ledlow, M.J., Keel, W.C., Wang, Q.D., & Morrison, G.E, 2005b, AJ, 129, 31.
- (44) Owen, F.N., Ledlow, M.J., Keel, W.C. & Morrison, G.E., 1999, AJ, 118, 633
- (45) Petrosian, V., & Dickey, J., 1973, ApJ, 186, 403
- (46) Poggianti, B.M., Bridges, T.J., Komiyama, Y., Yagi, M., Carter, D., Mobasher, B., Okamura, S., & Kashikawa, N., 2004, ApJ, 601, 197
- (47) Poggianti, B.M., & Wu, H., 2000, ApJ, 529, 157
- (48) Poggianti, B.M., Smail, I., Dressler, A., Couch, W.J., Barger, A.J., Butcher, H., Ellis, R.S., & Oemler, A., 1999, ApJ, 518, 576
- (49) Rizza, E., Morrison, G.E., Owen, F.N., Ledlow, M.J., Burns, J.O., & Hill, J., 2003, AJ, 126, 119
- (50) Sault, R.J., Staveley-Smith, L., & Brouw, W.N., 1996, A&AS, 120, 375
- (51) Serjeant, S., Gruppioni, C., & Oliver, S., 2002, MNRAS, 330, 621
- (52) Simard-Normandin, M., Kronberg, P.P., & Button S., 1981, ApJS, 45, 97
- (53) Smail, I., Morrison, G., Gray, M. E., et al. 1999, ApJ, 525, 609
- (54) Struck, C., 1999, Physics Report, 1999, 321, 1
- (55) Venturi, T., Bardelli, S., Zagaria, M., Prandoni, I., & Morganti, R., 2002, A&A, 385, 39
- (56) Venturi, T., Bardelli, S., Zambelli, G., Morganti, R., & Hunstead, R.W., 2001, MNRAS, 324, 1131
- (57) Venturi, T., Bardelli, S., Morganti, R., & Hunstead, R.W., 2000, MNRAS, 314, 594
- (58) Wolf, C., Gray, M.E., & Meisenheimer, K., 2005, A&A, 443, 435