Evidences on Secular Dynamical Evolution of Detached Active Binary Orbits and Contact Binary Formation
Abstract
Evidence of secular dynamical evolution for detached active binary orbits are presented. First order decreasing rates of orbital angular momentum (OAM), systemic mass () and orbital period of detached active binaries have been determined as yr-1, yr-1 and yr-1 from the kinematical ages of 62 field detached systems. The ratio of implies that either there are mechanisms which amplify AM loss times with respect to isotropic AM loss of hypothetical isotropic winds or there exist external causes contributing AM loss in order to produce this mean rate of decrease for orbital periods. Various decreasing rates of OAM () and systemic mass () determine various speeds of dynamical evolutions towards a contact configuration. According to average dynamical evolution with , the fraction of 11, 23 and 39 per cent of current detached sample is expected to be contact system within 2, 4 and 6 Gyr respectively.
Çanakkale University Observatory, 17100 Çanakkale, Turkey
Çanakkale University Observatory, 17100 Çanakkale, Turkey
Istanbul University, Faculty of Science, Department of Astronomy and Space Sciences, 34119, Istanbul, Turkey
Istanbul University, Faculty of Science, Department of Astronomy and Space Sciences, 34119, Istanbul, Turkey
1. Introduction
Observational data and theory of contact binaries revised extensively by Mohnachi (1981), Vilhu (1981) and Rucinski (1982). According to Rucinski (1986) the most promising mechanism of formation for contact binaries involves the orbital angular momentum loss (AML) and the resulting orbital decay of detached but close synchronized binaries. AML by magnetic breaking (Schatzman 1959, Kraft 1967, Mestel 1968) became popular especially after Skumanich (1972) who presented observational evidence of decaying rotation rates for single stars. Magnetic breaking and tidal locking have been considered as a main route to form W UMa-type contact binaries from the systems initially detached (cf. Huang 1966, Okamoto & Sato 1970, van’t Veer 1979, Vilhu & Rahunen 1980, Mestel 1984, Guinan & Bradstreet 1988, Maceroni & van’t Veer 1991, Stepien 1995, Demircan 1999).
Orbital period evolutions and time scale for forming contact systems from detached progenitors are predicted differently among the authors above. Since tidal locking is more effective at short periods, secular orbital period decreases were estimated slow at the beginning. Only the binaries of few days orbital periods were predicted to become contact systems within the order of years. Shrinking orbits and related orbital period decreases, unfortunately, are not detectable on commonly used O-C diagrams formed by eclipse times due to: (1) short time-span covered by existing O-C data (at most 100 years), (2) large scattering of unevenly distributed O-C data, (3) existence of complicated larger amplitude shorter time-scale fluctuations by many different effects such as mass transfer, third companion and/or magnetic cycles etc. (cf. Demircan 2000,2002; Kreiner, Kim & Nha 2001). Observed period decreases on O-C diagrams, thus, cannot be counted as observational evidence for the secular orbital period decreases.
There exists an opposing theory which predicts different scenario of contact binary formation by a fission process (Roxburgh 1966) enabling contact binaries to form at the end of the pre-main sequence contraction. Considering the brief lifetime of contact stages ( Gyr) estimated by Guinan & Bradstreet (1988), this theory would fail to produce older population of W UMa binaries unless AM is conserved. However, conservation of AM would refute formation of contact systems from the detached progenitors.
Debate on the formation mechanism continues. Low space density of contact binaries (0.2% in the solar neighborhood, Rucinski 2002, 2006) implies limited lifetimes for contact stages and favors the formation mechanism from the detached progenitors. However, if tidal locking is efficient only at orbital periods comparable (1 days) to contact systems, then the 0.2% space density becomes too much that “contact binaries appear out of nowhere” (Paczynski et al. 2006). Other mechanisms of OAM loss besides tidal locking must occur to account this observed space density in the solar neighborhood.
This presentation aims to summarize the evidences of secular dynamical evolution for detached binary orbits recently obtained by us from the kinematics of chromospherically active binaries (Karataş et al. 2004) and from the kinematics of W UMa systems (Bilir et al. 2005). After a brief summary of orbital dynamics, mean dynamical evolution according to Demircan et al. (2006) will be described on , and diagrams.
2. Evidence of secular decrease of orbital periods and masses
First, Guinan & Bradstreet (1988) estimated a kinematical age of 8-10 Gyr for W UMa systems from their galactic space velocity dispersions. Theory of formation from detached progenitors appears consistent even if this age is compared to an earlier estimate of Gyr kinematical age (Eker 1992) of possible progenitors; the chromospherically active binaries (CAB). Being comparable to nuclear time-scale, the 8-10 Gyr age of W UMa systems implies that contact systems either have been retaining their original AM according to Roxburgh (1966) or have been formed from detached binaries if orbits are unstable against AM loss. However, according to the space velocities and the dispersions by Aslan et al. (1999), W UMa binaries are not older than RS CVn systems.
Increased size of the samples (CAB & W UMa) together with greatly improved astrometric data (parallaxes & proper motions) by Hipparcos (Perryman et al. 1997) motivated us to reanalyze the problem once more. First, identifying possible members of young moving groups (MG) from 237 CAB binaries, we had spitted them into two sub samples of kinematically young ( Gyr, N=95) and older field (3.86 Gyr, N=142) systems.
MGs are kinematically coherent groups of stars that share a common origin. Eggen (1994) defined a super cluster of stars gravitationally unbound in the solar neighborhood, but having a same kinematics while occupying the extended regions in the Galaxy. Therefore a MG, unlike well known open clusters covering only a limited sky, can be observed at all directions. Kinematical criteria originally defined by Eggen (1958a, b, 1989, 1995) for determining possible members of the best-documented MGs are summarized by Montes et al. (2001a, b). The basic idea is that a test star s space velocity vector must be equal and parallel, or at least with deviations smaller than the pre-determined limits, to the space velocity vector of a MG. The ages of MGs are known as open cluster ages from the main-sequence turn-off point. Ages of MG groups considered in this study are given in Table 1 together with kinematical parameters to identify them.
| Name | Age | (U, V, W) | C.P. | ||
|---|---|---|---|---|---|
| (Myr) | (km/s) | (km/s) | (, ) | ||
| Local Association | 20 – 150 | (-11.6,-21.0,-11.4) | 26.5 | (5.98,-35.15) | |
| (Pleiades, a Per, M34, | |||||
| Lyr, NGC 2516, IC2602) | |||||
| IC 2391 Supercluster | 35 – 55 | (-20.6,-15.7,-9.1) | 27.4 | (5.82,-12.44) | |
| (IC 2391) | |||||
| Castor MG | 200 | (-10.7,-8.0,-9.7) | 16.5 | (4.75,-18.44) | |
| Ursa Major Group | 300 | (14.9,1.0,-10.7) | 18.4 | (20.55,-38.10) | |
| (Sirius Supercluster) | |||||
| Hyades Supercluster | 600 | (-39.7,-17.7,-2.4) | 43.5 | (6.40,6.50) | |
| (Hyades, Praesepe) |
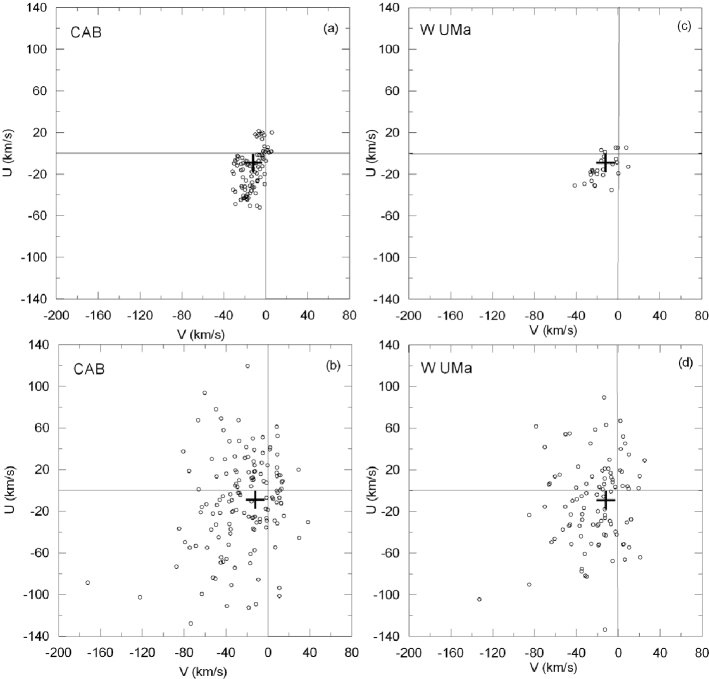
Dispersions of CAB and W UMa stars on the diagrams are compared in Fig. 1, where possible MG members are also shown. & are space velocity components towards the Galactic center and in the direction of Galactic rotation. ¿From the galactic space velocity dispersions, 3.86 and 5.47 Gyr of kinematical ages were assigned to field CABs and W UMa s (Karataş et al. 2004, Bilir et al. 2005). Although being smaller than earlier determinations, these ages too do not show a conflict with the theory of formation from detached progenitors. Moreover, the difference (1.61 Gyr) between these ages was interpreted as a mean lifetime of contact stages by Bilir et al. (2005).
Formed by kinematical criteria, young groups allowed us to compare period and total mass histograms as well as other physical parameters between a young group and corresponding field systems in order to search further evidences of OAM loss. Since kinematical criteria determine only possible members for a MG, wrong identifications are always possible since the space velocity of a star coincidently may imply a membership. We believe number of wrong identifications are small and thus unable to spoil statistics that evidences of dynamical evolution from detached to contact stages could still be found.
Being much younger than field systems, histograms of MG group CAB could be taken as initial distributions of field CAB. Consequently, it becomes clear that smooth shaped initial distribution (see Fig. 6 of Karataş et al. 2004) is changed to a distribution with a peak at 10 days indicating the relative number of longer and shorter period systems were decreased. Secular OAM loss forcing orbital periods to decrease could explain the reduction of the relative number of systems with periods longer than 10 days. On the other hand, period decrease and radius increase as a result of dynamical and nuclear evolutions must have changed the missing short period systems into contact or semi-contact form thus they are no longer in the list of current CABs. We think the difference of period histograms between the MG group and the field CABs presents clear hints of OAM loss and secular decrease of orbital periods.
It is not as clear, but similar kind of trends are also noticeable in the total mass () histograms (see Fig. 8 of Karataş et al. 2004). The tails rather than peaks support the prediction of mass decrease as a consequence of mass loss which carries away OAM of active binaries. The gradual decrease of the high mass tail of young group is changed to a sharper decrease in the older group. Similarly sharp decrease towards the less massive systems changed to rather a gradual decrease in the older population. Heterogeneity of samples containing giants (G), sub-giants (SG) and main-sequence (MS) systems and the evolution into contact or semi-contact configurations complicates the histograms and makes the interpretation of the peaks more difficult. See Karataş et al. (2004) for the details and further interpretations about sub-groups discriminating G, SG and MS systems.
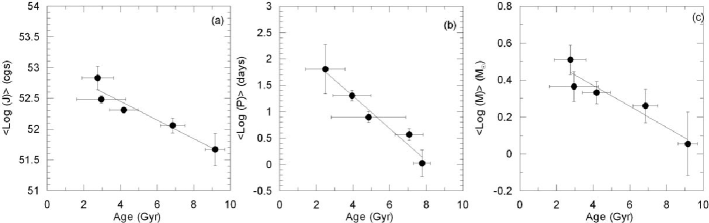
Increase of kinematical ages towards the short period systems (see Table 5 of Karataş et al. 2004) could be taken as the clearest evidence of orbital period decrease as a consequence of OAM loss. Dynamical evolution has been further quantized with mean decreasing rates of OAM, total masses and periods from the kinematical ages of carefully selected detached CABs with most reliable physical parameters by Demircan et al. (2006), who preferred to form sub-samples according to OAM ranges. Mean OAM (), period () and mass () of these sub groups versus the kinematical ages are displayed in Fig. 2. The decreases of , and by age are obvious. As a first approximation linear lines were fitted by the least squares method and the inclinations were found to be yr-1, yr-1, and yr-1.
A linear change in the logarithmic scale implies a constant rate of change. Consequently, the mean relative decreasing rates yr-1, yr-1and yr-1 were determined from kinematics to represent a mean dynamical evolution have been occurring among the detached CAB stars in the solar neighborhood.
Similar histograms and tables were also produced for W UMa stars. However, similar kind of interpretations are not possible for them because lifetime in the contact stage is too short, e.g. Gyr (Guinan & Bradstreet 1988) or Gyr (Bilir et al. 2005). The MG group systems would disappear before reaching to an age of even the youngest group of field contacts with a mean kinematical age 3.21 Gyrs (See Table 6 of Bilir et al. 2005). The four sub-groups formed from 97 field contact binaries according to orbital period ranges (ages 3.21, 3.51, 7.14 and 8.89 Gyrs) dominate over 27 systems which are possible MG members with ages less than 0.6 Gyrs. This fact implies that pre-contact dynamical evolution must exist dominantly among W UMa stars. Nevertheless, being out of the ordinary, direct formation at the end of pre-main sequence contraction by fission process (Roxburgh 1966) must also be occurring because ages of MG groups ( Gyrs) give no space for pre-contact detached phases. Due to complexities of various lengths of pre-contact stages, it is not possible to evaluate the total mass and the period histograms for W UMa systems in a similar manner as CAB systems.
3. Orbital dynamics
The most basic definition of OAM () can be given as
| (1) |
where is moment of inertia and is angular speed for an orbital motion, thus .
OAM () is needed dynamically to keep the orbital motion. Therefore, and are physical quantities which determine a unique period () and a unique size for the orbit as
| (2) |
where the mass ratio () can be considered as an auxiliary parameter used in the definition of . The size represents the semi–major axis of a relative orbit of one star around the other. Stability of an orbit (, ) requires OAM and mass to be constant (, ) provided with no mass transfer (). If there is no mass transfer, which must be true for detached binaries, it is obvious that OAM loss will cause an orbit to reduce its period and size. On the contrary, mass loss has an affect of increasing the period and size. Logarithmic derivatives of (2) give possible relative changes as
| (3) |
Because has higher power than , the affect of mass loss would dominate. For example, in the case of same relative changes of OAM and mass (isotropic stellar winds, if ), according to (1), then
| (4) |
which means mass loss and corresponding OAM loss will have a net effect on the orbit to increase both the period and the size. However, there could be additional causes to increase relative OAM loss, e.g. OAM loss of gravity waves, or stellar encounters in the galactic space, or a third body in an eccentric orbit around the binary system, or existence of an amplification mechanism as in some tidally locked binaries, in which tidal interactions transfer OAM to spinning components and AM is lost at the Alfven radius. After considering all possibilities, one has to compare the grant total relative OAM loss to the relative mass loss which could be expressed by a parameter defined as
| (5) |
which can be called dynamical parameter because dynamical respond of the orbit depends on the value of . Using this definition of , equation (3) becomes
| (6) |
if is neglected. Mass ratio change could be zero just because relative mass loss of components would be equal. Even if , the term could be very small especially for high mass ratio () systems. Thus, ignoring it in the first approximation is acceptable.
For decreasing an orbital period, is required. But, is sufficient to shrink an orbit. If , orbital size decreases despite period is increasing. The size and the period of an orbit both increase if .
Using the mean decreasing rates of OAM and mass from the kinematical ages of detached CAB stars, a mean value for the dynamical parameter () can be estimated for them as
| (7) |
in the solar neighborhood.
4. Mean dynamical evolution on diagrams
4.1. The diagram
CAB and W UMa stars with available OAM are plotted on a diagram (Fig. 3). The CAB stars containing giants, sub-giants, and main sequence and A & W type W UMa are indicated. W UMa stars are located at the lower left. Having larger masses and orbital periods, the CAB systems display a band like distribution on the right of W UMa stars as elongated from lower left to upper right. The constant total mass lines are computed with , which is the median value of mass ratios of CAB stars, using
| (8) |
at which is varied while chosen values are fixed.
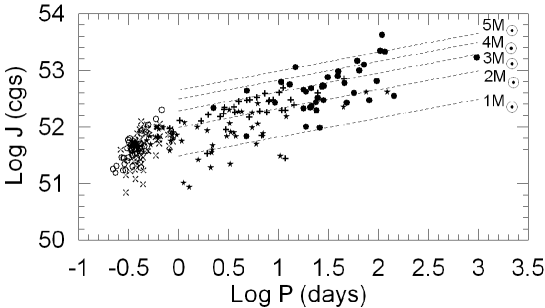
Well defined smooth upper boundary of CAB systems appears as if tracing the path of dynamical evolution for them. OAM loss, mass loss and associated orbital period decrease would move a system from upper right to lower left as if parallel to the upper boundary. Finally, some systems would enter in the region of W UMa stars. However, this description is not quite correct according to the mean dynamical evolution with , which is marked by an arrow at the upper end of the upper boundary in Fig. 4b. The magnitude of the arrow symbolizes an interval of 2 Gyrs. The right sides of the triangle in the lower right show the amount of OAM loss and corresponding orbital period decrease.
Fig. 4b plotted with symbols to indicate kinematically young (MG) and old (field) stars. The random distribution of the young and old CAB systems in implies that a detached system may start its dynamical evolution anywhere on the diagram in the region of CAB stars. So, it is not possible to distinguish younger and older systems according to their location on these diagrams unlike the nuclear evolution on H-R diagram which has a well defined starting point on the Zero Age Main Sequence (ZAMS). It is well known that the location of a star on H-R diagram indicates its stage of evolution as well as its age.
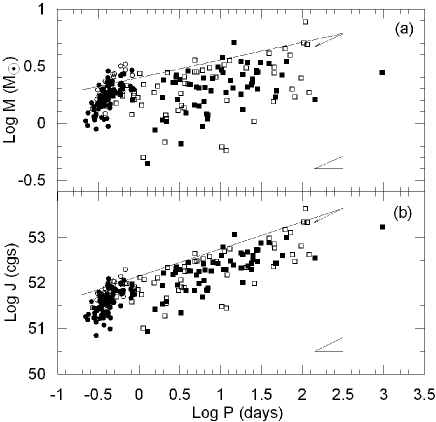
4.2. The diagram
The diagram resembles a similar type distribution as the diagram. First, the upper boundary of CAB stars on the diagram (Fig. 4a) was eye estimated and digitized by computer. Then using its numerical , points together with , the solid line on the diagram was computed by (8). Since the computed line fits even better to the CAB upper boundary of distribution, the upper boundaries of both diagrams in Fig. 4 are not independent and appears to be determined by the upper mass limits of orbital periods. Non-existence of CAB stars above those upper boundaries could be related to binary formation mechanism since initial Roche lobes may put limits on the masses of forming binaries. The binaries above, if they exist, they are not chromospherically active because being brighter they would have been easier to be noticed as CAB stars, then upper boundaries on those diagrams mark only the upper mass limit for a binary of a given period to have choromosphric activity.
Moreover, If period decrease occurs because of OAM loss but without mass loss and mass transfer, a dynamical evolution would follow a path parallel to the constant mass lines in Fig. 3, which would carry binaries into the empty region. This requires for a CAB system to seize chromospheric activity if it moves into the empty region by such a process. Therefore, it is most likely the CAB upper boundary on diagram represent a dynamical evolution with a minimum mass loss. Nevertheless, mean decreases determined from the kinematical ages of CAB stars shown by the right sides of the triangles in Fig. 4 indicates that the direction of mean dynamical evolution neither is parallel nor towards the empty region as it is shown by the arrows at the upper ends of the upper boundaries in Fig. 4.
4.3. The diagram
Because and are basic quantities to determine & and because OAM loss & mass loss are parameters controlling the magnitude and direction of dynamical evolution, the diagram is a natural choice to study dynamical evolution of orbits. Once, Fig. 5 is produced, a sharp separation between the detached and contact systems stroke to our attention. Goodness of separation is out striking that despite crowding along the border, there are only two systems (OO Aql, Cap) on the wrong side, which could be due to a wrong identification of the state of being contact or just because of observational errors. Separation of such a degree does not occur on the diagrams discussed before.
Marking several positions on the borderline between CABs and W UMas following quadratic equation was produced.
| (9) |
where is in solar units and is in cgs. Physical significance of this line is that it marks the maximum OAM for a contact system to survive. It is like in single stars, spin AM has to be less than a certain value otherwise gravity cannot hold stellar mass together. It is same for contact binaries, if OAM is more than the value computed above, the contact configuration brakes. CAB systems (RT Lac, AR Mon, UMi, RV Lib, BH CVn), which were eliminated from the list of Demircan et al. (2006) when the mean decreasing rates of , and were determined (since they are filling or about to fill one of the Roche lobes that mass transfer possibly occurring in them), are marked on Fig. 6. Since those systems are not close to the contact border and scattered randomly all over in the detached region, the state of being detached and semi-detached must be same physically.
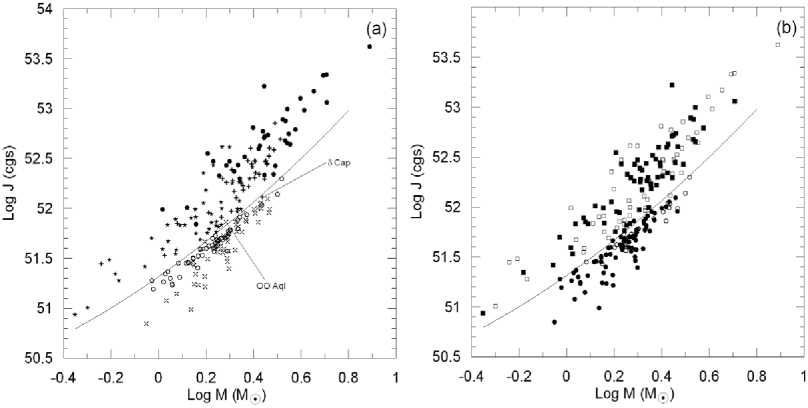
A detached system must lose OAM to go into the region of contacts in order to be a contact binary. This possibility, however, very much depends on the position on the diagram together with the direction and the speed of the dynamical evolution, which could be very different from one system to another. The diagram too gives no clue on individual dynamical evolutions since there is no information about initial positions. Random mix of young (MG) and old (field) systems (Fig. 5b) indicates that a same position could be belonging to both a young and an old system.
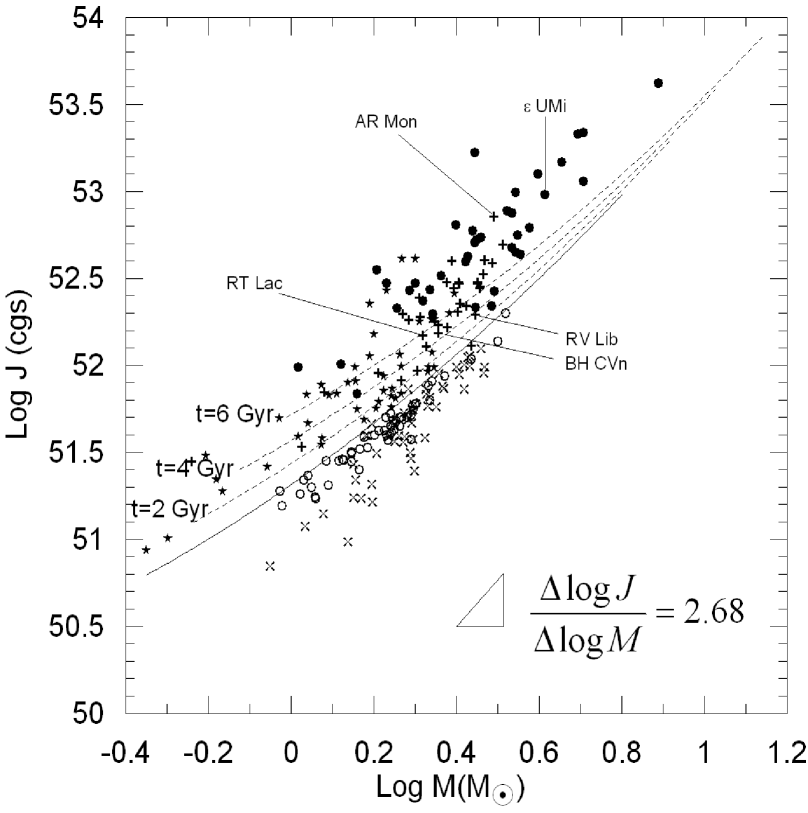
Nevertheless, the contact border (eq. 9) could be helpful to determine contact binary candidates. The amount of mean losses ( and ) corresponding to 2, 4 and 6 Gyr are subtracted from the and values of the border. That is, the contact border is shifted accordingly. Dotted lines in Fig. 6 represent shifted borders that the systems between a dotted line and the contact border are the ones which are predicted to be contact systems within the time intervals indicated if their nuclear evolutions permit them to live untill the predicted times. After counting, it becomes clear that 11, 23 and 39 per cent of the current sample of CABs could pass over the contact border within the next 2, 4 and 6 Gyr according to the mean dynamical evolution with .
4.4. Period and size evolution of orbits
It is possible to draw constant period lines using (8). On the other hand,
| (10) |
can be used to compute constant orbital size lines similarly. From the statistics of present samples, median values and are found to represent CAB and W UMa stars. The constant orbital period and orbital size lines run almost parallel to the contact border and both values decrease towards it (Fig. 7). Further decrease into the region of contacts is also clear.
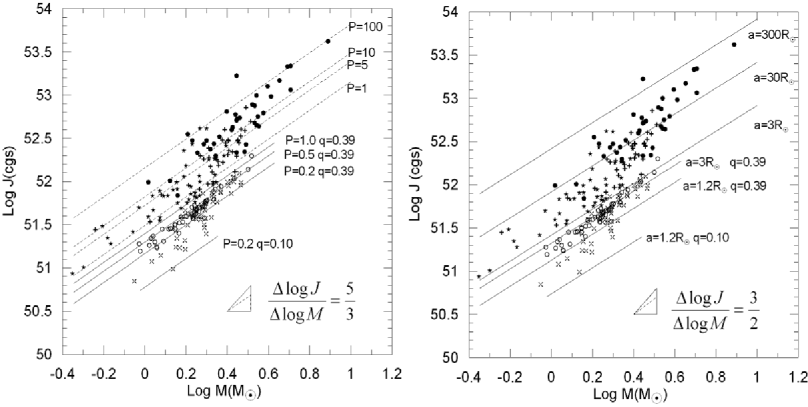
Constant period and constant size lines are sensitive to small values. One can feel the sensitivity by comparing day (or ) lines of and , also days (or ) computed with and . Decreasing periods (or sizes) towards the lower right is deceptive as if evolution to contact stage is occurring from upper left to lower right which is impossible since such an evolution requires a mass gain. Mass loss, however, changes the direction from vertically down (OAM loss only) towards to the lower left (if OAM and mass both are lost). Because the affect of mass loss dominates over OAM loss (eq. 3), there are lower limits; one for orbital periods and one for the orbital sizes. Both limits are indicated by the dotted lines in the triangles and the corresponding numerical values () in Fig. 7. Any dynamical evolution with a smaller than those limits indicates an increase rather than a decrease on both .
5. Conclusions
Since for detached CAB in the solar neighbourhood is greater than both limits, (5/3 for , 3/2 for ) orbits are shrinking and periods are decreasing. A well defined borderline sharply separating detached and contact systems are discovered empirically on diagram. It is possible for a detached system to pass over the contact border and become a contact system by OAM loss. Not only day period detached systems, but also some days period systems can pass over this border according to the constant period lines in Fig. 7 and loci of equal times to reach at the contact border in Fig. 6. Significant number of current CABs (39 per cent) were found as canditates to pass over the contact border within the next 6 Gyrs according to their positions on the diagram. Nevertheless, contact binary formation from detached progenitors is not the only mechanism to form contact systems. Although, it is rare, direct formation at the end of the pre-main sequence evolution must also be occurring. Statistical studies are encouraged to include these new findings if one can still say “contact binaries appear out of nowhere” while they are already known to be rare systems (Rucinski 2002, 2006).
Acknowledgements: This work has been partially supported by COMU BAP 2005/108, Research Fund of the University of Istanbul (244/23082004) and TUBITAK 104T508.
References
- Aslan et al. (1999) Aslan, Z., Őzdemir, T., Yeşilyaprak, C., İskender, A., 1999, Tr. J. of Physics, 23, 45
- Bilir et al. (2005) Bilir, S., Karataş, Y., Demircan, O., Eker, Z., 2005, MNRAS, 357, 497
- Demircan (1999) Demircan, O., 1999, Tr. J. Phys., 23, 425
- Demircan (2000) Demircan, O., 2000, in Variable Stars as Essential Astrophysical Tools, ed. C İbanoğlu. Dordrecht; Boston (NATO Science Series. Series C. Mathematical and Physical Sciences; Vol 544), p.615
- Demircan (2002) Demircan, O., 2002, in The Royal Road to Stars, ed. O Demircan, E Budding. Publications of COMU, Çanakkale, Turkey, p. 130
- Demircan et al. (2006) Demircan, O., Eker, Z., Karataş, Y., Bilir, S., 2006, MNRAS, 366, 1511
- Eggen (1958a) Eggen, O.J., 1958a, MNRAS, 118, 65
- Eggen (1958b) Eggen, O.J., 1958b, MNRAS, 118, 154
- Eggen (1989) Eggen, O.J., 1989, PASP, 101, 366
- Eggen (1994) Eggen, O.J., 1994, in Morrison L. V., Gilmore G., eds, Galactic and Solar System Optical Astrometry. Cambridge Univ. Press, Cambridge, p.191
- Eggen (1995) Eggen, O. J., 1995, AJ, 110, 2862
- Eker (1992) Eker, Z., 1992, ApJS, 79, 481
- Huang (1966) Huang, S.S., 1966, ARA&A, 4, 35
- Guinan & Bradstreet (1988) Guinan, E.F., Bradstreet, D.H., 1988, in Dupree A.K., Lago M.T., eds, Formation and Evolution of Low Mass Stars, Kluwer, Dordrecht, p. 345
- Karataş et al. (2004) Karataş, Y., Bilir, S., Eker, Z., Demircan, O., 2004, MNRAS, 349, 1069
- Kreiner, Kim & Nha (2001) Kreiner, J.M., Kim, C., Nha, II-Seung, 2001, on Atlas of O C Diagrams of Eclipsing binary Stars, Poland: Wydawnictwo Noukowe Akademii
- Kraft (1967) Kraft, R.P., 1967, ApJ, 150, 551
- Maceroni & van’t Veer (1991) Maceroni, C., van’t Veer, F., 1991, A&A, 246, 91
- Mestel (1968) Mestel, L., 1968, MNRAS, 138, 359
- Mestel (1984) Mestel, L., 1984, in S.L. Baliunas and L. Hartmann, eds, the Third Cambridge Workshop Cool Stars, Stellar Systems, and the Sun, Lecture Notes in Physics, Vol. 193, Springer-Verlag, Berlin, Heidelberg, New York, p. 49
- Mohnachi (1981) Mohnachi, S.W., 1981, ApJ, 245, 650
- Montes et al. (2001a) Montes, D., Lopez-Santiago, J., Galvez, M.C., Fernandez-Figueroa, M.J., De Castro, E., Cornide, M., 2001a, MNRAS, 328, 45
- Montes et al. (2001b) Montes, D., Fernandez-Figueroa, M. J., De Castro, E., Cornide, M., Latorre, A., 2001b, 11th Cambridge Workshop on Cool Stars, Stellar Systems and the Sun, ASP Conference Proceedings, Vol. 223. Edited by Ramon J. Garcia Lopez, Rafael Rebolo, & Maria Rosa Zapaterio Osorio. San Francisco: Astronomical Society of the Pacific, p.1477
- Okamoto & Sato (1970) Okamoto, I., Sato, K., 1970, PASJ, 22, 317
- Paczynski et al. (2006) Paczynski, B., Szczygiel, D., Pilecki, B., and Pojmanski, G., 2006, MNRAS, 368, 1311
- Perryman et al. (1997) Perryman, M.A.C., et al., 1997, A&A, 323L, 49
- Rucinski (1982) Rucinski, S.M., 1982, A&A, 112, 273
- Rucinski (1986) Rucinski, S.M., 1986, IAU Symp., 118, 159
- Rucinski (2002) Rucinski, S.M., 2002, PASP, 114, 1124
- Rucinski (2006) Rucinski, S.M., 2006, MNRAS, 368, 1319
- Roxburgh (1966) Roxburgh, I.W., 1966, ApJ, 143, 111
- Schatzman (1959) Schatzman, E., 1959, A&AS, 8, 129
- Skumanich (1972) Skumanich, A., 1972, ApJ, 171, 565
- Stepien (1995) Stepien, K., 1995, MNRAS, 274, 1019
- van’t Veer (1979) van’t Veer, F., 1979, A&A, 80, 287
- Vilhu & Rahunen (1980) Vilhu, O., Rahunen, T., 1980, in Plavec M.J., Popper D.M., Ulrich D.R., eds, Proc. IAU Symp. 88, Close Binary stars, Reidel, Dordrecht, p. 491
- Vilhu (1981) Vilhu, O., 1981, ApSS, 78, 401