MASS PROFILES OF GALAXY CLUSTERS FROM THE PROJECTED PHASE-SPACE DISTRIBUTION OF CLUSTER MEMBERS
I review our current knowledge of the mass distribution in clusters, as obtained from the analysis of the projected phase-space distribution of cluster galaxies. I discuss the methods of analysis, their relative advantages and disadvantages, and their reliabilities. I summarize the most recent and important results on the mass distributions of galaxy systems, from nearby to medium-distant systems, and from groups to clusters. In particular I consider how well different proposed models fit the observed cluster mass distribution, and which are the relative distributions of galaxies, baryons, and dark or total mass in clusters. I also discuss the current observational evidence for mass accretion onto galaxy systems, coming mostly from the analysis of the velocity anisotropy profiles.
1 Introduction
The determination of cluster masses dates back to Zwicky’s (1933, 1937) and Smith’s (1936) preliminary estimates of the masses of the Coma and the Virgo cluster. These early estimates were based on the virial theorem with galaxies used as unbiased tracers of the cluster potential (the light traces mass hyptohesis). These studies marked the discovery of dark matter (see, e.g., Biviano 2000 for a historical review of the subject). Only much later it was correctly pointed out (by The & White 1986 and Merritt 1987 among others) that cluster masses were in fact poorly known, since relaxing the light traces mass assumption widens the range of allowed mass models considerably. However, the limited amount of redshift data made it very difficult at that time, if not impossible, to constrain the relative distributions of cluster mass and cluster light.
With the advent of multi-object spectroscopy, a large number of redshifts for cluster galaxies has become available, in large part thanks to the ESO Nearby Abell Cluster Survey (ENACS, Katgert et al. 1996, 1998), and the Canadian Network for Observational Cosmology (CNOC, Yee et al 1996; Ellingson et al. 1998). Moreover, field galaxy surveys have also contributed to increase the number of redshifts for cluster galaxies, in particular, the Two Degree Field Galaxy Redshift Survey (2dFGRS, e.g. Colless et al. 2001; De Propris et al. 2002) and the Sloan Digital Sky Survey (SDSS, e.g. Adelman-McCarthy et al. 2006; Miller et al. 2005). More recent spectroscopic surveys of cluster galaxies include the Las Campanas/Anglo Australian Telescope Rich Cluster Survey (Pimbblet et al. 2001), the Cluster and Infall Region Nearby Survey (CAIRNS, Rines et al. 2003), the WIde Field Nearby Galaxy-clusters Survey (WINGS, Fasano et al. 2006), and the ESO Distant Cluster Survey (EDisCS, White et al. 2005). This large amount of spectroscopic data now available for cluster galaxies provides the observational material for the analysis of cluster mass distributions. Knowledge of the mass distribution within clusters (also in relation to the distributions of the different cluster components) gives important clues about the way clusters of galaxies and their components form and evolve (see, e.g., El Zant et al. 2004), and about the nature of dark matter (see, e.g., Meneghetti et al. 2001). In particular, the discovery of the universal ’NFW’ mass density profile of dark matter haloes by Navarro et al. (1996, 1997) has stimulated many studies on the subject of mass profiles over the last decade.
One way to determine the mass profile of a cluster is by the use of its member galaxies as tracer of the gravitational potential. Another very useful tracer is the intracluster (IC) diffuse gas component. In both cases one uses the observed distribution of these tracers in projected phase-space to infer the cluster mass distribution, very often through the application of the spherically-symmetric, collisionless Jeans equation (e.g. Binney & Tremaine 1987). A more direct method for the determination of a cluster mass profile is through the analysis of the shapes and distribution of gravitationally lensed galaxies in the cluster background. None of these methods is without problems. The lensing method suffers from the mass-sheet degeneracy (e.g. Dye et al. 2001; Cypriano et al. 2004), projection effects (e.g. Metzler et al. 2001; Wambsganss et al. 2005), and low- inefficiency (e.g. Natarajan & Kneib 1997). The main problem with the use of the X-ray emitting IC gas as a tracer of the potential is that X-ray observations generally sample only the inner cluster regions (see, e.g., Pratt & Arnaud 2002; but see also Neumann 2005). Additional problems exist, such as incomplete thermalization and the presence of bulk motions in the IC gas (e.g. Henriksen & Tittley 2002) leading to the violation of the conditions of hydrostatic equilibrium required for an unbiased determination of the cluster mass (Bartelmann & Steinmetz 1996; Kay et al. 2004; Rasia et al. 2004).
The problems that affect the cluster mass determinations obtained using galaxies as tracers will be extensively discussed in Sect. 2.1. Here I rather emphasize the main advantage of this method, namely the fact that it allows sampling the mass profiles of galaxy clusters out to large radii, well beyond the virialized region (see, e.g., Reisenegger et al. 2000; Rines et al. 2002). An additional advantage is that by using galaxies as tracers we can (or in fact, must) learn about their orbital distribution within clusters (see, e.g., van der Marel et al. 2000, vdM00 hereafter; Biviano & Katgert 2004), a useful piece of information for constraining models of galaxy evolution in clusters. In the end, however, the main rationale for using galaxies as tracers of the cluster potential is that three is better than one! Given that each method has its own, difficult to correct for, biases, it is wise to determine cluster mass profiles using several, independent methods. In this paper, I review recent results on cluster mass and mass-to-light ratio ( hereafter) profiles as obtained from the analysis of the spatial and velocity distributions of cluster member galaxies. I will also discuss the evidence for mass accretion coming from these studies. The interested reader may find complementary informations in my previous reviews on these topics (Biviano 2002, 2005).
2 Methods
A cluster mass profile, , can be determined from the projected phase-space distribution of its member galaxies by means of the virial theorem (see, e.g., Rines & Diaferio 2006), the Jeans analysis (see, e.g., Binney & Tremaine 1987), and the ’caustic’ method recently introduced by Diaferio & Geller (1997; see also Diaferio 1999). When also galaxy distance estimates are available, one can apply the least-action method (Peebles 1989) and variants of it (see, e.g., Mohayee & Tully 2005). Given the current uncertainties on galaxy distances, this method is only applicable to the very local Universe (typically, out to the Virgo cluster distance).
Use of the virial theorem requires correction for the surface pressure term, unless the radius at which the virial mass is estimated effectively contains the whole system (The & White 1986; Girardi et al. 1998). The surface pressure term depends on the orbital distribution of the population of tracers.
In the Jeans analysis the observable projected phase-space distribution of galaxies is related to the cluster , using the Abel and Jeans equations (eqs. 4-55, 4-57, and 4-58 in Binney & Tremaine 1987, for the simplified case of a stable, non-rotating, spherically symmetric system), through knowledge of the velocity anisotropy profile, , which characterizes the orbits of cluster galaxies. The classical Abel inversion equation has recently been extended by Mamon & Boué (in preparation) to the case of a costant anisotropic velocity distribution.
In the caustic method, one infers of a given cluster from the amplitude of the caustics in the space of line-of-sight velocities vs. projected clustercentric distances. Formally, the caustic amplitude is related to the gravitational potential through a function of the potential itself, and of (see eqs. 9 and 10 in Diaferio 1999). Numerical simulations indicate , but only at radii larger than the cluster virial radius, (see Fig. 2 in Diaferio 1999). Hence, for the Caustic mass estimate is not very accurate. On the other hand, since the method does not rely on the assumption of dynamical equilibrium, it is a very powerful tool to constrain at large radii.
Note that with all these methods one samples the total, not the dark mass of a cluster. This must be taken into consideration when observational results are compared with results from numerical simulations of collisionless dark matter haloes. The total matter being the sum of the dark and baryonic matter, the dark matter component can be estimated by subtracting the baryonic component from the total matter. Most of the baryons are in the diffuse IC gas component, hence X-ray data are needed in addition to galaxy data to determine the dark matter distribution (see Łokas & Mamon 2003; Biviano & Salucci 2006).
2.1 Problems
A fundamental problem of the Jeans analysis (and, to a lesser extent, also of the virial and caustic analyses) is the ’mass–orbit’ degeneracy, i.e. the fact that the solution obtained for is degenerate with respect to the solution obtained for . In order to break this degeneracy, must be constrained independently from . This can be achieved by the comparison of the projected phase-space distribution of cluster galaxies with distribution function models, where generally a constant is assumed (see, e.g., Kent & Gunn 1982; vdM00; Mahdavi & Geller 2004), or via the analysis of the shape of the galaxy velocity distribution, that contains the required information about the orbital anisotropy of cluster galaxies (e.g. Merritt 1987; vdM00; Łokas & Mamon 2003). Alternatively, if several tracers of the gravitational potential are available, the Jeans equation can be solved for independently for each of the tracers, thus restricting the range of possible solutions (Biviano & Katgert 2004).
Another relevant problem in the virial and Jeans analysis occurs if the cluster is not in steady state and dynamical equilibrium (this is not a serious problem for the caustic method, see Rines et al. 2003). Since clusters grow by accretion of field galaxies (e.g. Moss & Dickens 1977; Biviano et al. 1997), they are not steady-state systems. Formally, inclusion of the time derivative in the Jeans equation (eq. 4-29c in Binney & Tremaine 1987) is then needed. On the other hand, the fractional mass infall rate is estimated to be small for nearby clusters (Ellingson et al. 2001). Moreover, most of the mass is accreted in big, discrete clumps (Zabludoff & Franx 1993). Hence, those clusters undergoing substantial mass accretion can be identified through the presence of substructures in their galaxies distribution, and these clusters (or their main subclusters) excluded from the sample (vdM00; Biviano & Girardi 2003; Katgert et al. 2004). The problem gets tougher when one is dealing with small galaxy systems (galaxy groups) most of which are probably still in a pre-virialized collapse phase (e.g. Giuricin et al. 1988).
Interlopers are another potential problem in cluster mass estimates. Interlopers are foreground/background galaxies in the cluster region with velocities in the range of the velocity distribution of cluster members. The methods for identifying interlopers have become increasingly sophisticated over the years (e.g. Yahil & Vidal 1977; den Hartog & Katgert 1996; Fadda et al. 1996; Carlberg et al. 1997a; Łokas et al. 2006). These methods have been tested vs. numerical simulations and shown to produce robust results (van Kampen & Katgert 1997; Sanchis et al. 2004; Łokas et al. 2006; Biviano et al. 2006; Wojtak et al. 2006). The different methods produce in general quite consistent results for the cluster velocity dispersions (Girardi et al. 1993). It is nevertheless advisable to use robust estimators of the moments of the velocity distribution, both for the velocity dispersion (such as the biweight, see Beers et al. 1990) and even more so for the kurtosis (often used to constrain , see Łokas & Mamon 2003), which can be effectively replaced by the Gauss-Hermite moments (see vdM00).
As the number of available redshifts for cluster galaxies increases, the interloper selection procedure becomes more robust (e.g. Biviano et al. 2006). Since in practice spectroscopic samples of several hundreds member galaxies per cluster are rare, quite often a ’composite’ cluster is built by stacking together the data for several clusters (see, e.g., Carlberg et al. 1997a; vdM00; Katgert et al. 2004). The procedure is justified if clusters form a homologous family, as suggested by the existence of a fundamental plane of cluster properties (Schaeffer et al. 1993; Adami et al. 1998), and if the mass range of the stacked clusters is not too large, since the concentrations of dark matter haloes are expected to depend (albeit only mildly) on the halo masses (e.g. Dolag et al. 2004).
In the Jeans analysis it is generally assumed that clusters are spherical and do not rotate. The composite cluster is spherically symmetric by construction, and deviation from spherical symmetry is unlikely to be a major problem for individual clusters either (see vdM00; Sanchis et al. 2004). While evidence for cluster rotation has been claimed for a couple of clusters (see, e.g., Dupke & Bregman 2001), the energy content in the rotational component is marginal.
Dynamical friction and galaxy mergers could in principle invalidate the use of the collisionless Jeans equation. However, the cluster velocity dispersion is too high for galaxy mergers to take place, and the dynamical friction timescale is too long for most cluster galaxies, except for very massive galaxies (e.g. Biviano et al. 1992). These can be removed from the sample (Katgert et al. 2004) before going through the Jeans analysis. The situation is probably different in low-velocity dispersion systems, like groups, where the galaxy merging process may be rather efficient (see, e.g., Conselice 2006).
2.2 Reliability
The reliability of the different estimators of mass profiles can be assessed via numerical simulations, and via direct comparison of the results obtained with the different estimators. Comparison with numerical simulations indicate that the Jeans and caustic methods produce reliable mass profile estimates (Diaferio 1999; Sanchis et al. 2004; Łokas et al. 2006). Comparison of the mass profiles obtained for 72 nearby clusters using either the caustic or virial methods show consistency in 2/3 of the cases (Rines & Diaferio 2006). The mass profile of an ensemble of 43 nearby clusters determined via the Jeans analysis assuming isotropic orbits is found to be consistent with the one determined via the caustic analysis (Biviano & Girardi 2003). Viceversa, the mass profile of an ensemble of 8 nearby clusters determined via the caustic analysis is found to be consistent with the one determined via the Jeans analysis if the orbits are close to isotropic (Rines et al. 2003).
Very little is known so far about the consistency of mass profiles obtained using either cluster galaxies or the IC gas as tracers. The agreement between the X-ray- and caustic-determined masses is not very good for the sample of three medium- clusters analysed by Diaferio et al. (2005). A better agreement is found by Benatov et al. (2006) for two of the same clusters analysed by Diaferio et al. (2005), as well as for another three nearby clusters, using the Jeans rather than the caustic method. In this case, different orbital anisotropies are inferred for the different clusters (although the significance of these differences is rather low). The lensing mass profiles obtained for the three clusters analysed by Diaferio et al. (2005) are in reasonable agreement with the caustic mass profiles, and the lensing mass profile obtained for the A2218 cluster analysed by Natarajan & Kneib (1996) is consistent with the Jeans mass profile, is one drops the isotropic assumption.
3 Mass profiles
In a series of papers, Geller et al. (1999) and Rines et al. (2000, 2001, 2003, 2004) applied the caustic technique to 9 nearby clusters of the CAIRNS survey (including the Coma cluster). They found that the mass density profile decreases like near the center, and the best-fit asymptotic slope of the mass density profile at large is either (NFW) or (Hernquist 1990). When the NFW profile is adopted, the best-fit values of the concentration parameter aaaThroughout this paper I adopt the definition , where is the scale radius parameter in the NFW profile, see Navarro et al. (1997). vary between 5 and 17. Using the mass profiles obtained from the caustic technique in the Jeans analysis, is obtained. These results have recently been confirmed by a new caustic analysis of a sample of 72 clusters extracted from the SDSS (Rines & Diaferio 2006).
Biviano & Girardi (2003) analysed a composite cluster of 1345 member galaxies, obtained from stacking together 43 nearby clusters from the 2dFGRS. They performed a joint Jeans and caustic analysis, using the former method to determine the mass profile in the virialized region (), and the latter to extend to . I.e. they used each of the two methods in the cluster region where it is expected to perform best. A NFW profile was found to fit the data over the whole radial range explored. Cored profiles are also acceptable but only if the size of the core radius is small, .
Katgert et al. (2004) analysed a composite of 1129 galaxies from 59 nearby clusters from the ENACS. was determined in a fully non-parametric way. Only early-type galaxies (ellipticals and S0s) were used in the analysis. Their velocity distribution was showed to imply nearly isotropic orbits, hence was adopted in the Jeans analysis. The resulting mass density profile has a slope of at , fully consistent with an asymptotic slope of at larger radii. Both a NFW profile, and a Burkert (1995) profile with a rather small core radius () are acceptable. The solution obtained by Katgert et al. (2004) was confirmed by Biviano & Katgert (2004) by using another tracer of the gravitational potential, early-type spirals (Sa–Sb) in lieu of early-type galaxies.
Łokas & Mamon (2003) and Łokas et al. (2006) determined the mass distribution of 7 nearby clusters (including Coma) using the Jeans method, and fitting simultaneously the velocity dispersion and kurtosis profile, in order to break the mass-anisotropy degeneracy (see Sect. 2.1). Their cluster mass profiles are generally well described by the NFW model, with ranging from 2 to 11, with a median of 7.
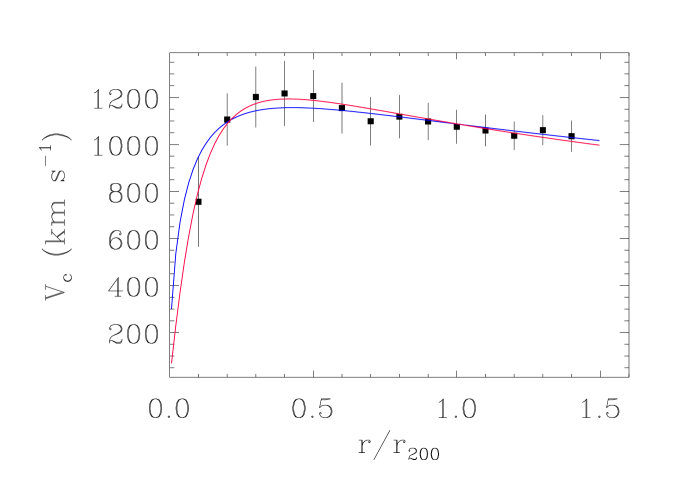
All of these works, except for the analysis of the Coma cluster by Łokas & Mamon (2003), actually constrained the total, not the dark mass profile. Recently, Biviano & Salucci (2006) have re-analysed the ENACS data-set to split the total matter profile into its dark and baryonic components. They find that the dark matter profile is consistent with both a Burkert (1995) and a NFW model. Their best-fitting models (see Figure 1) are slightly more concentrated than those fitting the total mass profile. They hardly change whether one considers the whole dark matter, or only its diffuse component, obtained by subtracting the contribution from individual dark matter subhaloes.
Similar results are obtained for the of higher- clusters. Following up the previous analyses of Carlberg et al. (1997a, 1997b), vdM00 stacked together 16 clusters at –0.55 from the CNOC survey, to build a composite cluster with galaxies. From the Jeans analysis they then determined a mass profile which is fully consistent with a NFW model.
At the low-mass end, results are still controversial. Mahdavi et al. (1999) used 588 galaxies in 20 groups to conclude that their mass density profile is consistent with a Hernquist (1990) model. Mahdavi & Geller (2004) determined the average mass density profile of groups from the RASSCALS sample (893 galaxies in 41 nearby groups, see Mahdavi et al. 2000). They find it to be well described by a single power-law model over a wide radial range (0–). Finally, Carlberg et al. (2001) analysed galaxies in groups from the CNOC2 survey, at redshifts –0.55. They determined a very shallow mass density profile, with a central core.
Discrepant results on the mass profiles of groups probably origin from the fact that not all groups are dynamically virialized systems (Giuricin et al. 1988; Diaferio et al. 1993; Mamon 1995; Mahdavi et al. 1999). Alternatively, since the merger process is expected to be efficient in some groups (Mamon 1995), the use of the collisionless Jeans equation may not be justified (see Sect. 2.1). Mamon et al. (in preparation) are currently trying to determine the average mass profile of the GEMS groups (Osmond & Ponman 2004), for which both X-ray and optical data are available. The comparison of optical and X-ray properties should help constraining the groups dynamical status (see, e.g. Brough et al. 2006). Preliminary results seem to indicate that the virialized groups have mass profiles consistent with the NFW model, with a higher concentration parameter than clusters.
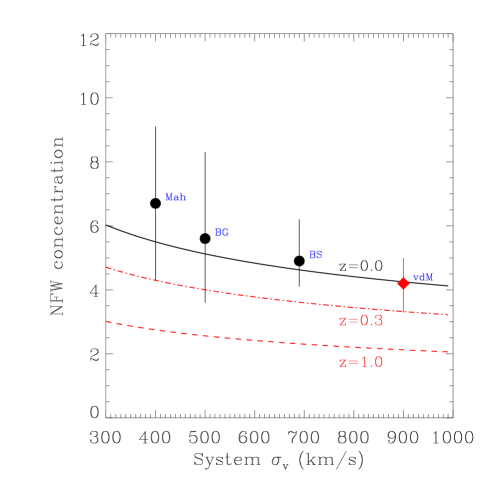
By assembling several results from the literature, I show in Figure 2 how the best-fit concentration parameter of the NFW model changes with the velocity dispersion of the systems considered. The trend is consistent with expectations from cosmological numerical simulations.
4 Mass accretion
The hierarchical model for the formation of cosmological structures has been so successful over the years that it has now become a paradigm. A way to test the paradigm is to look for evidence of the hierarchical build-up of cosmological structures. Direct evidence for the infall of field galaxies into galaxy systems has been recently provided by Ceccarelli et al. (2005), from the analysis of the pattern of peculiar velocities around nearby groups. In other galaxy systems, for which galaxy distances are generally not available, evidences for mass accretion can be obtained from the analysis of their mass profiles. In particular, using cluster mass profiles determined via the caustic method, Rines & Diaferio (2006) have recently estimated that the mass within the turnaround radius of a cluster is about twice the mass within its virial radius, on average. Hence nearby clusters are still forming and will eventually double their virial mass in the future.
Another evidence for mass accretion comes from the Jeans analysis. Most studies find evidences that the velocity anisotropies for cluster and group galaxies are not strong, (Carlberg et al. 1997b; Mahdavi et al. 1999; vdM00; Łokas & Mamon 2003; Rines et al. 2003; Katgert et al. 2004; Łokas et al. 2006), particularly so when only early-type galaxies are considered. The situation is different when late-type galaxies are examined. The suggestion that late-type galaxies may be an infalling population dates back to Moss & Dickens’ (1977) discovery that this population has a wider velocity distribution than the early-type population. Through the modelling of the projected phase-space distribution of blue galaxies in the CNOC clusters, Carlberg et al. (1997b) suggested that these galaxies are actually in equilibrium with the cluster potential, but on slightly radial orbits (). The same conclusion was reached by Mahdavi et al. (1999) for nearby groups, and by Biviano (2002) and Biviano & Katgert (2004) for nearby clusters.
Given the mass profile determined by Katgert et al. (2004), Biviano & Katgert (2004) inverted the Jeans equation (following Binney & Mamon 1982 and Solanes & Salvador-Solé 1990) and determined the velocity anisotropy profiles of different classes of galaxy types. They found that the isotropic solution is acceptable for ellipticals and S0s, for early-type spirals (Sa–Sb), but not for late-type spirals (Sbc-type and later). These galaxies are characterized by only near the center, and have increasingly radial orbits outsidebbbA similar, albeit preliminary, analysis performed on a larger cluster sample extracted from the SDSS, confirm this result with greater statistical accuracy., a profile remarkably similar to those obtained for dark matter particles in numerical simulations (e.g. Ghigna et al. 1998; Diaferio 1999). By analogy, it is tempting to suggest that late-type spirals, just like dark matter particles in numerical simulations, still retain memory of the process of (mostly radial) gravitational infall along the filaments connecting to the cluster, and are therefore recent arrivals into the cluster (which would also explain why their internal properties have not been affected by the cluster potential, see the discussion in Biviano & Katgert 2004).
The projected phase-space distributions of early- and late-type galaxies in the nearby ENACS clusters are remarkably similar to those of, respectively, red and blue galaxies in the medium- CNOC clusters. Unsurprisingly then, also their orbital distributions are similar, nearly isotropic that of early-type ENACS and red CNOC galaxies, and mildly radial that of late-type ENACS and blue CNOC galaxies. The only remarkable difference is the substantially higher fraction of blue galaxies in the CNOC clusters, as compared to the fraction of late-type galaxies in the ENACS clusters. If blue/late-type galaxies are newcomers from the field in the cluster potential, as suggested by their radial orbits, we infer that the accretion rate of field galaxies into clusters was higher in the past (Ellingson et al. 2001). In order to reduce the late-type cluster galaxy fraction from to , blue, late-type cluster galaxies must either transform and/or dim with time. If they transform, changing their type and colour, they need at the same time change their orbits, from radial to nearly isotropic. This is a powerful constraint for models of galaxy evolution in clusters, since not all transformation mechanisms are able to affect galaxy properties as well as their orbits.
5 profiles
Most of the studies addressing the determination of cluster s, also address the determination of cluster s (in particular: Biviano & Girardi 2003; Katgert et al. 2004; Rines et al. 2004). We therefore refer the reader to Section 3 for details on the data samples used. The results obtained by the different authors show a great degree of consistency, modulo the selection in type or colour of the cluster galaxy population used to build the luminosity (or number) density profile. In fact, it is well known that galaxies of different types have different luminosity and number density profiles (Dressler 1980; see also Biviano et al. 2002 and references therein).
For nearby clusters it is generally found that the profile is rather flat out to , and decreases beyond that, by a factor out to the turnaround radius. The decreasing trend is due to the increasing contribution of late-type galaxies in the external regions. Approaching the cluster centers (at radii ) there is a drop of mainly caused by the presence of a brightest cluster galaxy (BCG) at the bottom of the cluster potential well. When red (or early-type) galaxies are selected, or when the selection of cluster galaxies is made in a very red photometric band (e.g. the band), and the cluster BCG contribution is removed, the light of cluster galaxies is found to trace the mass. This is good news for the determination of masses using the virial theorem (see Sect. 1), which is therefore expected to produce unbiased results when the red sequence cluster galaxies are used as tracers (as confirmed by the analysis of clusters extracted from a cosmological simulation, see Biviano et al. 2006).
The profile of more distant clusters is not so well constrained as that of nearby clusters. Like the profile of nearby clusters, it is consistent with being constant out to the virial radius, if only red galaxies are selected (vdM00).
At lower masses, results on the profile are controversial. Popesso et al. (2006) have recently shown that the central slope of the number density profiles of galaxy systems flattens with decreasing system mass. Mass density profiles are instead thought to be more concentrated for less massive haloes (e.g. Navarro et al. 1997; Dolag et al. 2004). Hence galaxy groups should have decreasing profiles with radius. Instead, group profiles are found to be flat (Mahdavi et al. 1999), if not even increasing (Carlberg et al. 2001). The discrepant results for the group profiles are a consequence of the poor knowledge of the group mass profiles (see Sect. 3).
Widening the scope of the analyses, Biviano & Salucci (2006) have recently determined the baryonic-to-total mass fraction as a function of radius for a sample of 59 nearby clusters from the ENACS data-base. They find that the total baryonic mass is less concentrated than the total mass, except in the central region. The excess baryonic mass near the center is due to the BCG, while the overall trend at radii is due to the IC gas that dominates the cluster baryon budget. The IC gas-to-total mass fraction increases with radius as .
6 Summary and perspectives
Useful constraints on the mass distribution within clusters have been obtained in recent years from the analysis of the projected phase-space distribution of cluster member galaxies. The constraints near the center ( with ) are not strong because of an intrinsic finite resolution (the size of the BCG). Both cored and cuspy profiles are allowed. Stronger constraints are obtained at large radii ( with ), and they are stronger than those obtained with any other methods. The isothermal sphere is ruled out, while the NFW, Burkert (1995) and Hernquist (1990) models are acceptable. If the mass density profile has a core, this has to be small, i.e. the radius where the mass density drops to half its central value is . By comparison with the results of numerical simulations of Meneghetti et al. (2001), Katgert et al. (2004) have used this result to set an upper limit to the scattering cross-section of dark matter particles. If, on the other hand, NFW is taken to be the correct model, then its concentration parameter is found to scale with the system mass as expected from cosmological numerical simulations (see Figure 2).
Old, passively evolving cluster galaxies have a nearly isotropic orbital distribution. On the other hand, the radial orbital distribution of late-type galaxies suggests they are recent newcomers into the cluster environment, which is therefore still accreting mass from the surrounding field, but at a lower rate than they used to at .
Overall, galaxy luminosity has a more concentrated distribution than cluster mass, but mass is traced quite well by galaxy light within the cluster virial radius, when only red, early-type galaxies (excluding the BCG) are considered. Blue, late-type galaxies, as well as the IC gas, have a more extended distribution than the mass.
The average mass profiles of nearby clusters and medium-distant clusters are similar, insofar as relatively relaxed clusters are selected. Hence, little or no evolution of the cluster dynamics from to is implied (see also Girardi & Mezzetti 2001), but this may simply reflect an observational bias, since clusters undergoing mergers are not eligible for the classical dynamical analyses. When comparing the and velocity anisotropy profiles of nearby and medium-distant clusters, one needs to take into account that the fraction of late-type galaxies increases with (e.g. Dressler et al. 1997; Fasano et al. 2000). When the comparisons are made separately for early- and late-type galaxies, there is no evidence for significant evolution of either the or the velocity anisotropy profilescccBenatov et al.’s (2006) suggestion that the velocity anisotropy profile of clusters evolves with , finds its natural explanation in the evolving fractions of early- and late-type galaxies, the former on isotropic and the latter on radial orbits..
All the above results must be considered valid for clusters on average, since projection effects and cosmic variance may lead to rather different results for different individual clusters (e.g. Rines et al. 2003; Sanchis et al. 2004).
Progress on these topics is to be expected from the use of the SDSS data-set (e.g. Miller et al. 2005), which will allow to reduce the current uncertainties on the dynamics of nearby clusters. Much is still to be learned about the dynamics of lower-mass galaxy systems (groups). It is important to determine the mass profile of galaxy groups, intermediate in size between clusters and galaxies, because galaxy clusters have mass profiles that are reasonably well described by the NFW profile, but galaxies may not (de Blok & Bosma 2002; de Blok et al. 2003; Borriello et al. 2003; Gentile et al. 2004). A promising data-set in this respect is the GEMS groups sample of Osmond & Ponman (2004), for which also X-ray temperatures are available. These can provide robust scaling parameters for the build-up of a composite group sample. Finally, as more and more data become available for clusters (e.g. Demarco et al. 2005; Girardi et al. 2005; White et al. 2005), it will perhaps be possible to determine the evolution of cluster mass, , and velocity anisotropy profiles, although the young dynamical age of high- clusters is an additional problem we will have to deal with.
Acknowledgments
I dedicate this paper to the memory of my dear friend Daniel Gerbal. I wish to thank Sophie Maurogordato and Laurence Tresse for organizing such an exciting and enjoyable meeting, and the Program and Scientific Advisory Committees for inviting me to give this review, as well as for providing partial financial support. This work has been partially supported by funds from the INAF Progetto di Ricerca di Interesse Nazionale: “The WINGS Project and Follow-Ups”.
References
References
- [1] Adami, C., Mazure, A., Biviano, A., Katgert, P., & Rhee, G. 1998, A&A, 331, 493
- [2] Adelman-McCarthy, J.K. et al. 2006, ApJS, 162, 38
- [3] Bartelmann, M. & Steinmetz, M. 1996, MNRAS, 283, 431
- [4] Beers, T.C., Flynn, K., & Gebhardt 1990, AJ, 100, 32
- [5] Benatov, L., Rines, K., Natarajan, P., Kravtosv, A., & Nagai, D. 2006, astro-ph/0605105
- [6] Binney, J., & Mamon, G. 1982, MNRAS, 200, 361
- [7] Binney, J., & Tremaine, S. 1987, ’Galactic Dynamics’, Princeton Univ. Press (BT87)
- [8] Biviano, A. 2000, in ’Constructing the Universe with Clusters of Galaxies’, IAP meeting, Paris, France, F. Durret & D. Gerbal Eds., http://nedwww.ipac.caltech.edu/level5/Biviano2/frames.html, astro-ph/0010409
- [9] Biviano, A. 2002, in ’Tracing Cosmic Evolution with Galaxy Clusters’, S. Borgani, M. Mezzetti, & R. Valdarnini Eds., ASP Conf. Series 268; also astro-ph/0110053
- [10] Biviano, A. 2005, in ’Mass Profiles and Shapes of Cosmological Structures’, IAP meeting, Paris, France, G. Mamon, F. Combes, C. Deffayet, & B. Fort Eds., astro-ph/0509679
- [11] Biviano, A. & Girardi, M. 2003, ApJ, 585, 205
- [12] Biviano, A., Girardi, M., Giuricin, G., et al. 1992, ApJ, 396, 35
- [13] Biviano, A. & Katgert, P. 2004, A&A, 424, 779
- [14] Biviano, A., Katgert, P., Mazure, A., Moles, M., et al. 1997, A&A, 321, 84
- [15] Biviano, A., Katgert, P., Thomas, T., & Adami, C. 2002, A&A, 387, 8
- [16] Biviano, A., Murante, G., Borgani, S., et al. 2006, astro-ph/0605151
- [17] Biviano, A. & Salucci, P. 2006, A&A, 452, 75
- [18] Borriello, A., Salucci, P., & Danese, L. 2003, MNRAS, 341, 1109
- [19] Brough, S., Forbes, D.A., Kilborn, V.A., & Couch, W. 2006, astro-ph/0605279
- [20] Burkert, A. 1995, ApJ, 447, L25
- [21] Carlberg, R.G., Yee, H.K.C., & Ellingson, E. 1997a, ApJ, 478, 462
- [22] Carlberg, R.G., Yee, H.K.C., Ellingson, E., et al. 1997b, ApJ, 476, L7
- [23] Carlberg, R.G., Yee, H.K.C., Morris, S.L. et al. 2001, ApJ, 552, 427
- [24] Ceccarelli, M.L., Valotto, C., Lambas, D.G., et al. 2005, ApJ, 622, 853
- [25] Colless, M., et al. 2001, MNRAS, 328, 1039
- [26] Conselice, C.J. 2006, astro-ph/0605531
- [27] Cypriano, E.S., Sodré, L.Jr., Kneib, J.-P., & Campusano, L.E. 2004, ApJ, 613, 95
- [28] de Blok, W.J.G., & Bosma, A. 2002, A&A, 385, 816
- [29] de Blok, W.J.G., Bosma, A., McGaugh, S. 2003, MNRAS, 340, 657
- [30] Demarco, R., Rosati, P., Lidman, C., et al. 2005, A&A, 432, 381
- [31] den Hartog, R., & Katgert, P. 1996, MNRAS, 279, 349
- [32] De Propris, R., et al. 2002, MNRAS, 329, 87
- [33] Diaferio, A. 1999, MNRAS, 309, 610
- [34] Diaferio, A. & Geller, M.J. 1997, ApJ, 481, 633
- [35] Diaferio, A., Geller, M.J., & Rines, K.J. 2005, ApJ, 628, L97
- [36] Diaferio, A., Ramella, M., Geller, M.J., & Ferrari, A. 1993, AJ, 105, 2035
- [37] Dolag, K., Bartelmann, M., Perrotta, F., et al. 2004, A&A, 416, 853
- [38] Dressler, A. 1980, ApJ, 236, 351
- [39] Dressler, A., Oemler, A. Jr., Sparks, W.B., et al. 1997, ApJ, 490, 577
- [40] Dupke, R.A., & Bregman, J.N. 2001, ApJ, 547, 705
- [41] Dye, S., Taylor, A.N., Thommes, E.M., et al. 2001, MNRAS, 321, 685
- [42] Ellingson, E., Lin, H., Yee, H.K.C. & Carlberg, R.G. 2001, ApJ, 547, 609
- [43] Ellingson, E., Yee, H. K. C., Abraham, R. G, Morris, S. L., & Carlberg, R. G. 1998, ApJS, 116, 247
- [44] El-Zant, A.A., Hoffman, Y., Primack, J., Combes, F., & Shlosman, I. 2004, ApJ, 607, L75
- [45] Fadda, D., Girardi, M., Giuricin, G., Mardirossian, F., & Mezzetti, M. 1996, ApJ, 473, 670
- [46] Fasano, G., Marmo, C., Varela, J., et al. 2006, A&A, 445, 805
- [47] Fasano, G., Poggianti, B.M., Couch, W.J., et al. 2000, ApJ, 452, 673
- [48] Geller, M.J., Diaferio, A., & Kurtz, M.J. 1999, ApJ, 517, L23
- [49] Gentile, G., Salucci, P., Klein, U., Vergani, D., & Kalberla, P. 2004, MNRAS, 351, 903
- [50] Ghigna, S., Moore, B., Governato, F., et al. 1998, MNRAS, 300, 146
- [51] Girardi, M., Biviano, A., Giuricin, G., et al. 1993, ApJ, 404, 38
- [52] Girardi, M., Demarco, R., Rosati, P., & Borgani, S. 2005, A&A, 442, 29
- [53] Girardi, M., Giuricin, G., Mardirossian, F., Mezzetti, M., & Boschin, W. 1998, ApJ, 505, 74
- [54] Girardi, M. & Mezzetti, M. 2001, ApJ, 548, 79
- [55] Giuricin, G., Gondolo, P., Mardirossian, F., et al. 1988, A&A, 199, 85
- [56] Henriksen, M.J., & Tittley, E.R. 2002, ApJ, 577, 701
- [57] Hernquist, L. 1990, ApJ, 356, 359
- [58] Katgert, P., Biviano, A., & Mazure, A. 2004, ApJ, 600, 657
- [59] Katgert, P., Mazure, A., den Hartog, R., et al. 1998, A&AS, 129, 399
- [60] Katgert, P., Mazure, A., Perea, J. et al. 1996, A&A, 310, 8
- [61] Kay, S.T., Thomas, P.A., Jenkins, A., & Pearce, F. 2004, MNRAS, 355, 1091
- [62] Kent S. M., & Gunn J. E., 1982, AJ, 87, 945
- [63] Łokas, E.L., & Mamon, G.A. 2003, MNRAS, 343, 401
- [64] Łokas, E.L., Wojtak, R., Gottlöber, S., Mamon, G.A., & Prada, F. 2006, MNRAS, 367, 1463
- [65] Mahdavi, A., Böhringer, H., Geller, M.J., & Ramella, M. 2000, ApJ, 534, 114
- [66] Mahdavi, A., & Geller, M.J. 2004, ApJ, 607, 202
- [67] Mahdavi, A., Geller, M.J., Böhringer, H., et al. 1999, ApJ, 518, 69
- [68] Mamon, G. 1995, in 3rd Chalonge Colloque Cosmologie, H. de Vega & N. S. Sánchez Eds. (Singapore: World Scientific), 95 – astro-ph/9511101
- [69] Meneghetti, M., Yoshida, N., Bartelmann, M., et al. 2001, MNRAS, 325, 435
- [70] Merritt, D. 1987, ApJ, 313, 121
- [71] Metzler, C.A., White, M., Norman, M., & Loken, C. 1999, ApJ, 520, L9
- [72] Miller, C.J., Nichol, R.C., Reichart, D., et al. 2005, AJ, 130, 968
- [73] Mohayee, R. & Tully, R.B. 2005, ApJ, 635, L113
- [74] Moss, C. & Dickens, R.J. 1977, MNRAS, 178, 701
- [75] Natarajan, P., & Kneib, J.-P. 1996, MNRAS, 283, 1031
- [76] Natarajan, P., & Kneib, J.-P. 1997, MNRAS, 287, 833
- [77] Navarro, J.F., Frenk, C.S., & White, S.D.M. 1996, ApJ, 462, 536
- [78] Navarro, J.F., Frenk, C.S., & White, S.D.M. 1997, ApJ, 490, 493
- [79] Neumann, D.M. 2005, A&A, 439, 465
- [80] Osmond, J.P.F. & Ponman, T.J. 2004, MNRAS, 350, 1511
- [81] Peebles, P.J.E. 1989, ApJ, 344, L53
- [82] Pimbblet, K.A., Smail, I., Edge, A.C., et al. 2001, MNRAS, 327, 588
- [83] Popesso, P., Biviano, A., Böhringer, H., & Romaniello, M. 2006, astro-ph/0606260
- [84] Pratt, G.W., & Arnaud, M. 2002, A&A, 394, 375
- [85] Rasia, E., Tormen, G., & Moscardini, L. 2004, MNRAS, 351, 237
- [86] Reisenegger, A., Quintana, H., Carrasco, E.R., & Maze, J. 2000, AJ, 120, 523
- [87] Rines, K., & Diaferio, A. 2006, astro-ph/0602032
- [88] Rines, K., Geller, M.J., Diaferio, A., et al. 2000, AJ, 120, 2338
- [89] Rines, K., Geller, M.J., Diaferio, A., et al. 2002, AJ, 124, 1266
- [90] Rines, K., Geller, M.J., Diaferio, A., et al. 2004, AJ, 128, 1078
- [91] Rines, K., Geller, M.J., Kurtz, M.J., & Diaferio, A. 2003, AJ, 126, 2152
- [92] Rines, K., Geller, M.J., Kurtz, M.J., et al. 2001, ApJ, 561, L41
- [93] Sanchis, T., Łokas, E.L., & Mamon, G.A. 2004, MNRAS, 347, 1198
- [94] Schaeffer, R., Maurogordato, S., Cappi, A., & Bernardeau, F. 1993, MNRAS, 263, L21
- [95] Smith, S. 1936, ApJ, 83, 23
- [96] Solanes, J.M. & Salvador-Solé 1990, A&A, 234, 93
- [97] The, L.S. & White, S.D.M. 1986, AJ, 92, 1248
- [98] van der Marel, R., Magorrian, J., Carlberg, R.G., et al. 2000, AJ, 119, 2038 (vdM00)
- [99] van Kampen, E., & Katgert, P. 1997, MNRAS, 289, 327
- [100] Wambsganss, J., Bode, P., & Ostriker, J.P. 2005, ApJ, 635, L1
- [101] White, S.D.M., Clowe, D.I., Simard, L., et al. 2005, A&A, 444, 365
- [102] Wojtak, R., Łokas, E.L., Mamon, G.A., Gottlöber, S., Prada, F., & Moles, M. 2006, astro-ph/0606579
- [103] Yahil, A., & Vidal, N.V. 1977, ApJ, 214, 347
- [104] Yee, H.K.C., Ellingson, E. & Carlberg, R.G. 1996, ApJS, 102, 269
- [105] Zabludoff, A.I., & Franx, M. 1993, AJ, 106, 1314
- [106] Zwicky, F. 1933, Helv. Phys. Acta, 6, 10
- [107] Zwicky, F. 1937, ApJ, 86, 217