2Max Planck Institut für Radioastronomie, Auf dem Hügel, 69, D-53121 Bonn, Germany
A statistical analysis of a Galactic all sky survey at 1.4 GHz
Abstract
Radio surveys at frequencies of GHz allow to map the synchrotron emission (SE) in a frequency range where (except for very low Galactic latitudes or towards localized regions) it dominates over the other radio components. New all sky total intensity and polarization data at 1.4 GHz have been recently collected. We focus on the Galactic radio emission correlation properties described in terms of angular power spectrum (APS). We present for the first time the APS, in both total intensity and polarization modes, for some representative Galactic cuts and suitable APS power law (PL) parametrizations.
keywords:
Galaxy: general – polarization – magnetic fields – cosmic microwave backgroundburigana@iasfbo.inaf.it
1 Introduction
In the recent years a complete coverage of the radio sky at 1420 MHz, both in total intensity and in polarization intensity, has been achieved. It derives from the combination of total intensity surveys (Reich 1982, Reich & Reich 1986, Reich et al. 2001) and of the DRAO (Wolleben et al. 2004) and the Villa Elisa (Testori et al. 2004) polarization surveys, covering respectively the Northern and Southern celestial hemisphere, sensitive to the Stokes parameters and . All these surveys have a FWHM resolution of . The sky has been sampled at steps of in the total intensity and Villa Elisa surveys. The preliminary version of the DRAO survey used in this work has a sky sampling much better than that of the Leiden surveys (Brouw & Spoelstra 1976). The typical sensitivities of these surveys are of few tens of mK. These properties allow a reliable study of the Galactic correlation properties up to a multipole (, where is the smallest angular scale at which accurate information can be extracted).
2 Results
We have properly projected (La Porta et al. 2005) these surveys from their original equidistant cylindrical pixelization into the HEALPix scheme (Górski et al. 2005) and computed their APS with the Anafast facility.
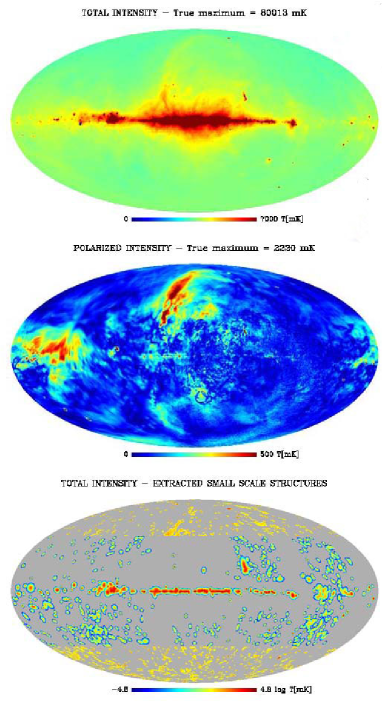
Fig. 1 shows the maps derived from our projection. As evident, the radio sky appears very different in total intensity () and polarization (): the polarized intensity on the Galactic plane is relatively less bright than in total intensity and exibits important structures at high Galactic latitudes. We then expect a dependence of the APS amplitude on the Galactic latitude, , stronger in total intensity than in polarization.
From the HEALPix maps of total and polarized intensity and of and parameters we have computed the APS, namely the , , , and modes, by applying various Galactic cuts. In particular, we exclude in the present analysis the region at where the Galactic free-free emission cannot be neglected to focus on the SE correlation properties. Fig. 2 shows some representative results. As evident, all the polarization modes, and in particular the and modes, are very similar and exibit PL shapes (left panel). Their typical slopes are in the range , in good agreement with the results found by La Porta & Burigana (2005) in the analysis of the Leiden surveys at 1411 MHz. By varying the Galatic cut, the APS amplitudes change by a factor . At they are in the range mK2. The mode (right panel) is in general not well approximated by a single PL but tends to flatten at (while the power decreasing at is the obvious effect of beam smoothing), particularly at high . To better understand this aspect we performed a dedicated subtraction of the discrete structures (DSs) in the total intensity map. The different level of the diffuse Galactic emission at low and high implies a dependent source detection level. We are confident to have identified DSs (see Fig. 1) with fluxes above Jy (resp. Jy) at (resp. at ). We computed the APS of the map including only the detected DSs and of the diffuse component (plus, obviously, the undetected sources) derived subtracting DSs from the original total intensity map. DSs explain the flattening found at for Galactic cuts and while at high Galactic latitudes () they provide the major contribution to the APS also at . At (where beam smoothing is negligible) the APS of detected DSs is nearly flat for and , as expected in the case of a bulk contribution from extragalactic radiosources. On the contrary, including also the region at the APS of DSs decreases with , as expected since the large scale correlation of the Galactic discrete sources. Finally, the APSs found for the diffuse component are again well described by PLs, with typical slopes in the range . As expected, the APS amplitude strongly depends on the applied Galactic cuts, being not very different for or ( mK2 at ) but significantly larger ( mK2 at ) for .
The accurate modelling of the Galactic diffuse SE in both total intensity and polarization, necessary to properly map the intrinsic cosmic microwave background anisotropies, provides relevant information on the Galactic magnetic field structure and the cosmic ray electron density distribution.

References
- [1] Brouw, W.N., Spoelstra, T.A.T.: 1976, A&AS 26, 129
- [2] Górski, K. M., et al.: 2005, ApJ 622, 759
- [3] La Porta, L., Burigana, C.: 2005, A&A, submitted
- [4] La Porta, L., et al.: 2005, MPIfR, Memo 2005/1
- [5] Reich, W.: 1982, A&AS 48, 219
- [6] Reich, P., Reich, W.: 1986, A&AS 63, 205
- [7] Reich, P., et al.: 2001, A&A 376, 861
- [8] Testori, J.C., et al.: 2004, in: B. Uyaniker, W. Reich, R. Wielebinski (eds.), The Magnetized Interstellar Medium, (Katlenberg-Lindau: Copernicus GmbH), p. 57
- [9] Wolleben, M., et al.: 2004, in: B. Uyaniker, W. Reich, R. Wielebinski (eds.), The Magnetized Interstellar Medium, (Katlenberg-Lindau: Copernicus GmbH), p. 51