Star formation bursts in isolated spiral galaxies
Abstract
We study the response of the gaseous component of a galactic disc to the time dependent potential generated by N-body simulations of a spiral galaxy. The results show significant variation of the spiral structure of the gas which might be expected to result in significant fluctuations in the Star Formation Rate (SFR). Pronounced local variations of the SFR are anticipated in all cases. Bursty histories for the global SFR, however, require that the mean surface density is much less (around an order of magnitude less) than the putative threshold for star formation. We thus suggest that bursty star formation histories, normally attributed to mergers and/or tidal interactions, may be a normal pattern for gas poor isolated spiral galaxies.
keywords:
hydrodynamics – methods: numerical – galaxies: ISM – galaxies: spiral – galaxies: structure1 Introduction
The local Universe furnishes many illustrations of the fact that vigorous star formation is highly localised in both space and time. The most spectacular examples, circumnuclear starbursts can, over timescales of Myr, sustain star formation rates comparable to entire galaxies from a region less than a kiloparsec across (Lehnert and Heckman 1996). Equally intense, but more spatially distributed, is the current burst of star formation (and Super Star Cluster formation) in the Antennae Galaxy (Whitmore et al 1999). Star formation in the Antennaa is self-evidently triggered by a major merger; there is also ample evidence, however, that bursts of star and cluster formation can be triggered by interactions with small satellite galaxies (i.e. by minor mergers; see, for example, Homeier and Gallagher 2002).
In isolated galaxies, however, it is usually assumed that the global star formation rate (henceforth SFR) shows little time variation although, in the case of disc galaxies, star formation is clearly spatially localised along spiral arms. This assumption (of a roughly constant quiescent SFR) is partly based on the expectations of spiral density wave theory in which the disc is susceptible to non-axisymmetric instabilities that generate a long lived pattern of spiral arms (Bertin et al 1989). Thus whereas the SFR may vary locally as material is compressed by the passage of spiral density waves, the pattern is invariant in a frame corotating with the spiral disturbance and therefore the global SFR is expected to be roughly constant. N-body simulations of self-gravitating discs however paint a very different picture of the development and longevity of spiral structures. For example, Sellwood and Carlberg 1984 performed N-body simulations of a stellar disc subject to both self-gravity and to a rigid halo potential. They found that the spiral structures that developed in their simulations were transient features which formed and re-formed on a timescale comparable with the galactic rotation period. (See also Huber and Pfenniger 2001, Gerritsen and Icke 1997 and Bottema 2003 for further simulations producing transient, regenerative spiral structures). The development and dissolution of such structures means that at a given location the gas is no longer subject to periodic variations in the potential, as in classical spiral density wave theory, and thus one would expect irregular variations in the resulting SFR. Likewise, the pattern of evanescent structures may not even give rise to SFRs that are globally constant, an impression that is strengthened by inspecting snapshots of the N-body simulations (see Figure 5 of Sellwood and Carlberg 1984), which suggest that potential troughs are much more pronounced at some epochs than others.
In this paper we undertake a preliminary investigation of the response of a galaxy’s gaseous component to such irregular potential variations. In this simple approach, we neglect the self-gravity of the gas, and its potential role in amplifying the structures in the N-body simulations, and instead study the response of non-self gravitating isothermal gas. In order to make qualitative statements about the spatial and temporal variations of the resulting SFR we have to make some assumption about how SFR depends on the surface density distribution. Here we simply associate the SFR with the fraction of the gas mass that is instantaneously compressed to a column density greater than some adjustable threshold value, (see Kennicutt 1989 and Martin and Kennicutt 2001 for a discussion of such a star formation threshold in disc galaxies). Note that we do not actually deplete the gas surface density in response to this nominal star formation rate but that since the simulations extend only over a few galactic rotation periods, this is not a major shortcoming.
The structure of the paper is as follows. In Section 2 we describe the N-body and gas dynamical simulations on which the study is based, in Section 3 we describe the resulting gas structures and in Section 4 interpret these time dependent structures in terms of a nominal star formation rate. Section 5 summarises our conclusions.
2 Numerical Method
The calculations are based on the gravitational potential formed in an N-body simulation of a spiral galaxy, which was performed by J. Sellwood, who kindly supplied the resulting data. This simulation is described below in section 2.1. The two-dimensional potential in the galactic plane was then applied as an external potential to an isothermal hydrodynamical gas disc, using the two-dimensional PPMLR grid code CMHOG, which was provided by P. Teuben. This second calculation is described in section 2.2.
2.1 The N-body galaxy simulation
The simulation from which the potential data are taken is a high resolution, three dimensional version of those presented in Sellwood and Carlberg 1984. J. Sellwood kindly supplied us with data on the potential variations by re-running in three dimensions (and at greater resolution) the timespan between and in Figure 2 of Sellwood and Carlberg. In this simulation the stellar velocity dispersion is allowed to rise due to heating of the disc by gravitational instabilities. After several rotation periods, the rising velocity dispersion stabilises the disc against non-axisymmetric instability and the Toomre Q parameter (Toomre 1964) attains a limiting value of around . At this point (latter panels in Sellwood and Carlberg’s Figure 2) the spiral arms become broader and fainter. However, Sellwood and Carlberg showed that a recurrent pattern of transient spiral arms will persist indefinitely if the disc is subject to a cooling agent that prevents the secular rise of the stellar velocity dispersion. They argued that in a real galaxy, accretion and dissipation in the gas phase would provide suitable cooling. In their second set of simulations, however, they instead mimicked cooling by the continual injection of disc particles on ‘cool’ (i.e. circular) orbits. The resulting spiral patterns (Figure 5) are very similar to those seen in the uncooled simulations over time , but now persist over many galactic rotation periods. In order to avoid the computational complications involved by introducing a pseudo cooling prescription into the calculations, we here just use the uncooled simulation over the timescale , noting its similarity to the long term state of the cooled calculations.
The simulation described here consists of 1M particles, whose gravitational field is evaluated over a cylindrical polar grid consisting of planes of points. The dimensionless galaxy model is scaled to real units by choosing a maximum radius of 30 kpc and a rotation velocity at the peak of the rotation curve of 220 km s-1. With this choice of units, the spacing between grid planes is parsecs, and the gravitational softening parameter (see Sellwood and Carlberg 1984) is parsecs.
The N-body calculation places particles in a surface-density distribution corresponding to the chosen rotation curve, while an additional rigid halo potential, corresponding to the same rotation curve, is added, which suppresses the bar instability (Ostriker and Peebles 1973). The disc and halo respectively comprise and of the total mass and the resulting rotation curve (in real units) is shown in Figure 1. The disc particles are spread vertically according to the isothermal sheet solution of Spitzer (1942) with scale parameter (see problem of Binney and Tremaine 1987 for definition) parsecs and a vertical velocity dispersion appropriate to such a system in equilibrium. The other components of the velocity dispersion are chosen so as to satisfy the Toomre stability criterion, i.e. to ensure that . Spiral structure naturally emerges as the simulation proceeds.

2.2 Two-dimensional Piecewise Parabolic Method
The 2D grid code CMHOG, provided by P. Teuben, uses the Piecewise Parabolic Method in the Lagrangian Remap formalism (PPMLR), and includes isothermal hydrodynamics in polar coordinates. The code is based on that described in Piner et al 1995; for a description of the Piecewise Parabolic Method, see Colella and Woodward 1984. In the simulations conducted here, the grid consists of 512 angular by 328 (logarithmically spaced) radial zones, and constant pressure boundary conditions are applied at the disc inner and outer edge.
An initially uniform gas disc is subject to the potential generated by the N-body calculation, this comprising a rigid halo component and a time dependent potential produced by the particles in the N-body code. The only remaining parameter to be adjusted is the sound speed111Here, the sound speed used is an ‘effective’ sound speed equal to the velocity dispersion of the ISM, a good approximation for the time and length scales involved (Cowie 1980) in the gas, ; the calculation was repeated with values km s-1 and km s-1.
This calculation therefore represents the response of the gaseous disc in a galaxy in which the mass is dominated by the stars. The spiral structure, which arises naturally in the stellar orbits, generates a corresponding response in the gas. We note that in real galaxies, the gas surface density declines roughly exponentially with radius, so that our use of uniform initial surface density in the gas will weight the global response of the gas towards conditions at the outside. In fact, we will find that the fluctuating spiral structure is stronger in the inner disc, so that the fractional variations in ‘star formation’ that we present are lower limits to what would occur in a galaxy whose gas disc was realistically centrally concentrated.
3 Numerical results
Surface density maps of the response of the initially uniform gas disc are shown in Figure 2 (for the case km s-1). The gas develops a complex structure of spiral shocks, showing multiple arms and significant deviation from straightforward spiral structure. Bifurcation of shocks, bending and merging of spiral arms and substructure perpendicular to the main shocks are all seen. At larger radii, shocks become weaker and are more tightly wound than those closer to the centre. Very little qualitative difference is visible between the calculations at different sound speeds; at lower sound speed, the shocks in the outer part of the disc are somewhat sharper, as expected.
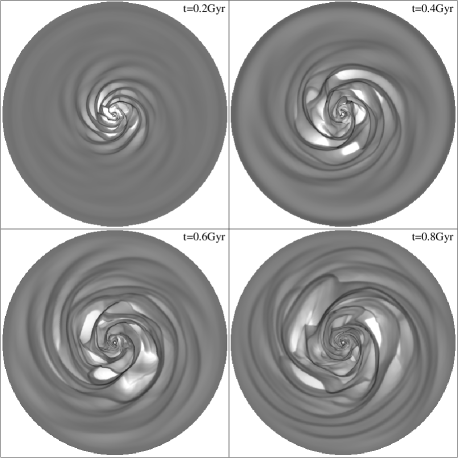
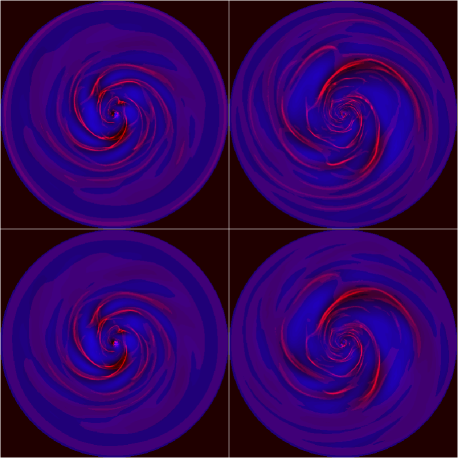
An animation of the calculation result shows that the spiral shocks tend to continually break and re-join, with the portions at smaller radii rotating more rapidly than those at larger radii. Where the shocks collide, very high densities can be reached temporarily. This continual disruption of the spiral structure originates in the spiral form of the gravitational potential. In Figure 3, images are shown indicating the potential value in blue, with the gas density superposed in red. Only the non-axisymmetric potential is shown, i.e. the colour at any point is proportional to the deviation of the potential from the mean value at that radius. These images show that the major spiral shocks do form in the deepest potential valleys, which means that (in this ‘galaxy’) the morphology of the shock structure is effectively determined by the potential structure222 We note that this behaviour is in contrast to that expected in the case of a long lived spiral mode, since the steady state response of the disc in this case involves an angular offset between the shock and the potential minimum (Gittins and Clarke 2004). Once again, the effect of a reduced sound speed is only visible in the outer regions of the galaxy.
The spiral structures formed in the gas disc do not correspond to one dominating spiral mode, but they do represent clear spiral arms. We have analysed the non-axisymmetric structure in the stellar potential by computing the function :
| (1) |
(where is the gravitational potential at the mid-plane of the N-body simulations) as a function of radius for different snapshots of the stellar distribution. represents the local amplitude of the th Fourier mode. The fact that is a function of radius at a given time indicates that the structure is not describable as a superposition of global modes. In fact, the region of the disc that is subject to strong non-axisymmetric disturbances progressively expands outwards as the simulation progresses (Figure 3), as can also be deduced from Figure 2. We find that the maximum value of is generally for and , with higher order modes contributing up to only333The cut-off in the mode spectrum at can readily be understood as corresponding to the minimum unstable wavelength for a disc with , for which and we estimated the pitch angle () from Figure 3.. As one would expect, given the variable appearance of the pattern in Figures 2 and 3, the relative contribution of the various modes fluctuates on a roughly dynamical timescale: for example, the mode is predominant at Gyr (upper right panel of Figure 2), whilst at Gyr, the mode is of comparable strength and becomes the dominant mode at Gyr.
If such a galaxy were observed, the densest regions of gas would correspond to observable features (e.g. enhanced H emission, concentration of H iiregions or enhanced surface brightness). There are numerous examples of galaxies that do not show grand design structure but in which such complex and multi-armed structure is nevertheless apparent (see, for example, the images contained in Elmegreen et al 1992, Fuchs and Moellenhoff 1999). Such snapshots give no hint of the fact that in the simulation, these features are rather short lived (of order an orbital time). Structures in the simulations include arms, spurs, loops and dense ‘knots’, some of which rotate in the opposite sense to the galaxy. The interpretation of these features, observationally, might involve more complex mechanisms such as self-gravity in the gas, feedback from star formation or the influence of a galactic companion, but in this case they form simply from the response of non self-gravitating gas to the fluctuating stellar potential.
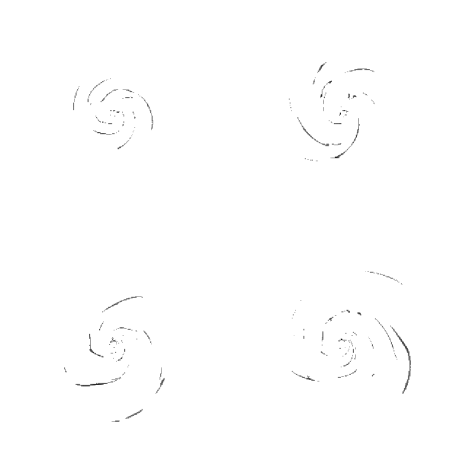
In figure 4, some images of the densest parts of the galaxy can be seen. These are a crude approximation of the shapes of spiral features that might be observed if the calculation were a real galaxy.
4 Star formation rate variations
The strong time dependence of these features means that the total mass of gas in the disc at high densities also varies significantly with time. The galaxy could therefore show significant variation in star formation rate. In this section, we discuss the application of the simulations to the star formation history of spiral galaxies.
4.1 Star formation history of the simulated galaxy
If vigorous star formation is only triggered above a critical density (as suggested by Kennicutt 1989) then it is reasonable to quantify the SFR in terms of the total mass instantaneously above that density (here denoted ). Following Martin and Kennicutt 2001, we adopt a star formation rate that scales with the mass above the critical threshold density raised to the power . The time-dependence of the resulting ‘star formation rate’ is then sensitive to the ratio of the mean gas density to the threshold density adopted. In general terms, if the mean density is close to the threshold, then the variation of star formation rate is rather smooth. There is an initial period of adjustment (over Gyr), when the gas density profile is reconfigured from the uniform initial conditions to one containing pronounced spiral structure: the azimuthally averaged density profile remains roughly uniform during the simulation, although the net effect of the torques from the non-axisymmetric stellar distribution results in a modest (factor three) enhancement in the azimuthally averaged density in the innermost regions (within kpc). Thereafter, in the case that the threshold density is close to the initial density, the variations in global star formation rate are rather modest (less than ).
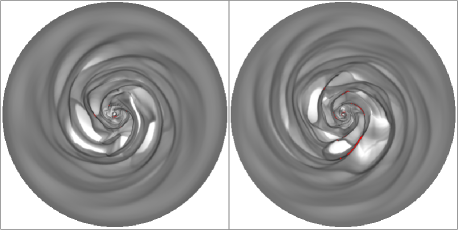
If, however, the critical density exceeds the mean density by a larger factor, the resulting star formation variations become much more pronounced, as bursts of star formation are associated only with epochs when the form of the spiral pattern in the gas results in regions of particularly high density. (For example, the collision of two spiral features can result in such localised regions of extreme enhancement). If the critical density is set to five times the mean density, then the star formation rate exhibits peaks on roughly the orbital timescale of around 200 Myr: in this simulation the global star formation rate can increase by a factor of about over Myr. More extreme variations are seen as the critical threshold is increased further: Figure 5 shows the mass of gas above in the case that the critical density threshold is times the initial density in the calculation with km s-1. Figure 6 shows the surface density of the disc, with the area above the density threshold highlighted in red, at a minimum and a maximum of the high-density mass (indicated with arrows on Figure 5).
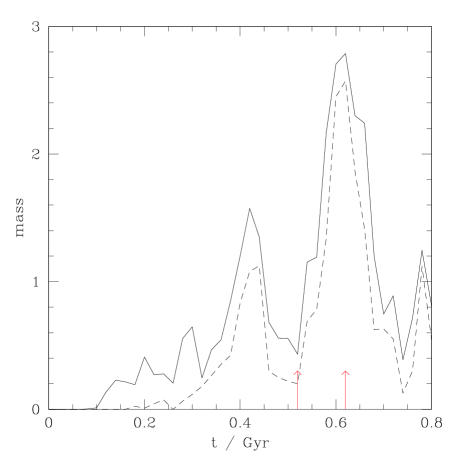
The simulations thus indicate that an isolated galaxy can develop a time dependent spiral structure in the gas which in turn may lead to a significantly varying star formation rate. The amplitude of this variation is strongly dependent on the ratio of the mean density in the galaxy to the critical threshold density, with large amplitude variations in global SFR being associated with the case that the average surface density is significantly less than the threshold value. The predominant timescale is roughly the orbital timescale at the galaxy’s half mass radius, although there are evidently smaller scale fluctuations on shorter timescales. The variations are aperiodic, with the burst amplitude varying strongly from burst to burst.
We note that fluctuations in star formation rate have also been recorded in the N-body/hydrodynamical simulations of Michel-Dansac and Wozniak 2004, although comparison with the present case is weakened by the fact that these simulations do not include a dark halo component, and hence develop a strong bar. In the Michel-Dansac and Wozniak 2004 simulations, star formation rate variations are mainly confined to the inner regions of the disc and result from time-dependent inflow along the bar, in contrast to the present case where regions of intense star formation are distributed in the disc, and correspond to events such as the merger of spiral arms. Another recent simulation that traced the evolution of the star formation rate is that of Semelin and Combes 2002 . However, in this case the spiral structure does not persist beyond about a galactic rotation period, this smoothing out being attributed by the authors to the effect of numerical heating by discrete dark matter particles. This being the case, it is unsurprising that the Semelin and Combes simulations show only smooth variations of the star formation rate after the first few hundred Myr. The simulations of Bottema 2003 are probably those which bear the closest comparison with the ones presented here, since they model non-barred galaxies in which the stellar potential exhibits transient but regenerative spiral structure as in the input (Sellwood and Carlberg 1984) potential employed here. In the Bottema 2003 simulations, however, the resulting star formation history depends critically on the degree of supernova feedback employed. In the absence of feedback, dense regions undergo runaway collapse (an outcome not possible, of course, in our non self-gravitating simulations), whereas the inclusion of feedback (modeled as localised injection of thermal energy) not only reduces the overall star formation level but also diminishes the amplitude of variations in the star formation rate, as star formation is self-quenched in dense regions.
There is evidently considerable uncertainty in how to model the relation between structures generated in the gas and the corresponding star formation history, when the critical processes (star formation and feedback) occur on a scale far smaller than the resolution elements of current simulations. For example, Li et al (2005) have modeled star formation in unstable disc galaxies through the introduction of hydrodynamic ‘sink particles’, at a mass scale of around , and have quantified the star formation rate in terms of the mass accumulated in such sink particles. These simulations also show a rather bursty star formation history; as in the simulations we report here, the stellar component of the galactic disc is not cooled efficiently and the spiral structure in the stars is very weak after a Gyr. Since this washing out of spiral structure proceeds from the inside out, and since the gas surface density distribution is exponential (rather than uniform as in the simulations here) this means that the burstiness of the star formation decreases more strongly than in our simulations, where the response is more heavily weighted towards conditions in the outer disc. We emphasise, however, that if the stellar population is subject to effective cooling, regenerative spiral structure persists over many Gyr at all disc radii (Sellwood and Carlberg 1984) and hence one would expect the bursty star formation history to be likewise a persistent phenomenon.
In summary, we emphasise the possible role of regenerative spiral structure in producing global variations in star formation rate, we consider that the expected amplitude of such star formation rate variations is far from clear.
4.2 Observational Constraints on SFR variations in disc galaxies
Given a stellar population where each star can be placed in an HR diagram, it is in principle possible to place some constraints on the star formation history (SFH) that is compatible with the observed distribution. Several authors have attempted this in the solar neighbourhood, e.g. Rocha-Pinto et al 2000, Hernandez et al 2000, Gizis et al 2002; the former two papers found evidence for approximately periodic star formation ‘bursts’ (involving enhancements in the SFR by a factor ) with typical spacing Gyr, i.e. comparable with the local galactic rotation period. The latter authors did not however find any evidence for such bursts over the last Gyr.
In external galaxies, SFR variations may be indirectly constrained through the application of population synthesis models to integrated stellar spectra, e.g. Kauffmann et al 2003. The absorption line indices used in this study are sensitive to isolated bursts during the last Gyr, but it is unclear whether they would be sensitive to the sort of continuously fluctuating star formation rate over this period as depicted in Figure 5. Likewise, element ratios may be used as a diagnostic of a bursty star formation history (Gilmore and Wyse 1991) but would again be insensitive to the SFH in Figure 5, since enhancement of iron to element ratios requires an extended (many Gyr) period of suppressed star formation. On the other hand, in the case of galaxies whose mean gas surface density is more than an order of magnitude below the threshold value, the SFH takes the form of discrete and well separated bursts which could leave an imprint on element ratios.
Another technique, in relatively nearby galaxies, is to trace local variations in SFR over the last few hundred Myr through photometric maps of resolved stellar populations. Unlike solar neighbourhood studies, or population synthesis models of entire galaxies, such mapping has the potential to disentangle local and global effects and could, in principle, distinguish between density wave theories (where a given location is periodically over-run by a star formation triggering event) or models involving material arms that corotate with the galaxy locally. Williams 2003 found evidence for temporal SFR variations at a given location but nevertheless found that there are regions with consistently higher SFRs than others over the time sampled. In our models, the interplay of spatial and temporal effects is complex: we expect neither the result of spiral density wave theory (where each region undergoes a phase lagged SFR variation of equal amplitude) nor that of rigid material arms, in which case each region is permanently in a state of high or low SFR. In our models, by contrast, the arms cross the disc but are themselves evolving on a similar timescale. Figure 7 shows the surface density vs. time for two different small patches in the disc, traced along circular orbits over the entire length of the calculation. We see that although some regions may pass through several arms with no significant activity (right hand panel), in other regions there is a continual variation in density. In the latter case (left hand panel), we would expect significant star formation variations even if the threshold density were set equal to the mean surface density (unity in these calculations). Thus we conclude that although large amplitude variations in global SFR require the mean density to be less than , the SFR will show strong local variations even when the mean density is similar to .


5 Conclusions
We have presented the response of an isothermal gas disc to the gravitational potential of an N-body simulation of an isolated spiral galaxy. Complex spiral structures are formed, which break and re-join continually on a timescale comparable with the local orbital period. This highly varying structure leads to the formation of many dense features, which are generally short-lived. This would be expected to correspond to variations in the global star formation rate, as events such as the merging of spiral features occur sporadically on timescales of a few galactic rotation periods. Since the amplitude of such bursts varies from burst to burst, it is possible that rarer, larger scale bursts (traditionally attributed to galactic interactions) may also occur in isolated disc galaxies, due purely to the regenerative nature of spiral structures in stellar discs. We however stress that large scale variations in global SFR are probably confined to galaxies with mean gas surface density considerably below the threshold value.
The simulations also imply spatial and temporal variations in star formation rates that are considerably more complex than those generated by a long lived spiral mode, since now the lifetime of individual spiral features is comparable with the timescale on which they cross the disc. Mapping of resolved stellar populations in nearby galaxies offers a potential tool to examine the observational evidence for such effects (Kodaira et al 1999, Williams 2003).
We stress that our simulations omit many processes that must be important in real galaxies (e.g. interconversion between the star and gas phase, the effects of stellar feedback, self-gravity and equation of state of the gas and back reaction of the gas on the stellar dynamics). For this reason, the results in this paper are more illustrative than quantitative (and indeed, as we discuss in 4.1, it is not obvious how to quantify star formation variations in any simulation where the scales on which star formation and feedback occur are so far below the resolution of the simulations).
Finally, we note that N-body simulations (such as those of Sellwood and Carlberg 1984), which find spiral structures to be recurrent, short-lived patterns, have attracted much interest from those studying the origin of spiral arms in galaxies. It is only rather recently that some of the observational signatures of such transient structures have begun to be explored (Sellwood and Preto 2002, Sellwood and Binney 2002). Irregular variations in star formation rate are an obvious corollary of such a picture. The study of temporal and spatial variations in star formation rates in nearby galaxies may thus shed some light on the nature and origin of spiral structure in disc galaxies.
Acknowledgments
Thanks are due to Jerry Sellwood for performing the N-body simulation of the galaxy and supplying the potential data, to Peter Teuben for providing the CMHOG code and support, and to Rob Kennicutt, Max Pettini and Gerry Gilmore for advice on star formation histories. We also thank Giuseppe Lodato for useful input on the mode spectrum in gravitationally unstable discs. CJC acknowledges support from the Leverhulme Trust in the form of a Philip Leverhulme Prize. We are grateful to the referee (Curtis Struck) for encouraging us to examine how our results depend on the ratio of threshold to mean gas surface density and for other comments that have improved the paper.
References
- (1) Bertin, G., Lin, C.C., Lowe, S.A., Thurstans, R.P., 1989, ApJ 338,104
- Binney & Tremaine ( 1987) Binney, J., Tremaine, S., 1987, Galactic Dynamics, Princeton University Pres s.
- Bottema (2003) Bottema R., 2003, MNRAS, 344, 358
- Colella & Woodward (1984) Colella P., Woodward P. R., 1984, Jour. Comp. Phys. , 54, 174
- Cowie (1980) Cowie L. L., 1980, ApJ, 236, 868
- (6) Elmegreen, B. G., Elmegreen, D. M. & Montenegro, L., 1992, ApJS 79,37
- Fuchs & Moellenhoff (1999) Fuchs, B., Moellenhoff, C., 1999 A&A 352,L36
- Gilmore & Wyse (1991) Gilmore G., Wyse R. F. G., 1991, ApJL, 367, L55
- Gerritsen & Icke (1997) Gerritsen J. P. E., Icke V., 1997, A & A 325, 986
- Gittins & Clarke (2004) Gittins D. M., Clarke C. J., 2004, MNRAS 349, 909
- Gizis et al. (2002) Gizis J. E., Reid I. N., Hawley S. L., 2002, AJ, 123, 3356
- Hernández et al. (2000) Hernández X., Valls-Gabaud D., Gilmore G., 2000, MNRAS, 316, 605
- Homeier & Gallagher (2002) Homeier, N., Gallagher, J.S., 2002. Ap&SS 281,417
- (14) Huber D., Pfenniger D., 2001, A & A 374,465
- Kauffmann et al. (2003) Kauffmann G., Heckman T. M., White S. D. M., Charlot S., Tremonti C., Brinchmann J., Bruzual G., Peng E. W., Seibert M., et. al. 2003, MNRAS, 341, 33
- Kennicutt (1989) Kennicutt R. C., 1989, ApJ, 344, 685
- Kodaira, Vansevevicius, Tamura & Miyazaki (1999) Kodaira, K., Vansevevicius, V., Tamura, M., Miyazaki, S., 1999, ApJ 519,153
- Lehnert & Heckman ( 1996) Lehnert, M.D., Heckman, T.M., 1996. ApJ 472,546
- Li, Mac Low & Klessen (2005) Li, Y., mac Low, M.-M., Klessen, R.S., 2005, ApJ in press.
- Martin & Kennicutt (2001) Martin, C.L., Kennicutt, R.C., 2001, ApJ 555,301
- Michel-Dansac & Wozniak (2004) Michel-Dansac, L., Wozniak, H., 2004, A & A 421,863
- Ostriker & Peebles (1973) Ostriker J. P., Peebles, P. J. E, 1973, ApJ 186,467.
- Piner et al. (1995) Piner B. G., Stone J. M., Teuben P. J., 1995, ApJ, 449, 508
- Rocha-Pinto et al. (2000) Rocha-Pinto H. J., Scalo J., Maciel W. J., Flynn C., 2000, A & A, 358, 869
- Sellwood & Carlberg (1984) Sellwood J. A., Carlberg R. G., 1984, ApJ, 282, 61
- (26) Sellwood, J., A., Preto , M., 2002 in Disks of Galaxies: Kinematics, Dynamics and Peturbations, ASP Conference Proceedings, Vol. 275. Edited by E. Athanassoula, A. Bosma, and R. Mujica, San Francisco: Astronomical Society of the Pacific, 2002, pp. 281-292
- (27) Sellwood, J., A., Binney, J., 2002, MNRAS 336,785
- Semelin & Combes ( 2002) Semelin, B., Combes, F., 2002, A & A 388,826
- Spitzer (1942) Spitzer, L., 1942, ApJ 95,329
- Toomre (1964) Toomre A., 1964, ApJ, 139, 1217
- (31) Whitmore, B., Zhang, Q., Leitherer, C., Fall, S.M., Schweizer, F., Miller, B.W., 1999, AJ 118,1551
- Williams (2003) Williams B. F., 2003, AJ, 126, 1312