Theory for the Secondary Eclipse Fluxes, Spectra, Atmospheres, and Light Curves of Transiting Extrasolar Giant Planets
Abstract
We have created a general methodology for calculating the wavelength-dependent light curves of close-in extrasolar giant planets (EGPs) as they traverse their orbits. Focussing on the transiting EGPs HD189733b, TrES-1, and HD209458b, we calculate planet/star flux ratios during secondary eclipse and compare them with the Spitzer data points obtained so far in the mid-infrared. We introduce a simple parametrization for the redistribution of heat to the planet’s nightside, derive constraints on this parameter (Pn), and provide a general set of predictions for planet/star contrast ratios as a function of wavelength, model, and phase. Moreover, we calculate average dayside and nightside atmospheric temperature/pressure profiles for each transiting planet/Pn pair with which existing and anticipated Spitzer data can be used to probe the atmospheric thermal structure of severely irradiated EGPs. We find that the baseline models do a good job of fitting the current secondary eclipse dataset, but that the Spitzer error bars are not yet small enough to discriminate cleanly between all the various possibilities.
Subject headings:
stars: individual (TrES-1, HD209458, HD189733)—(stars:) planetary systems—planets and satellites: general1. Introduction
Probing the atmospheres of extrasolar giant planets (EGPs) by measuring their spectra is the paramount means to determine their physical and chemical character (Burrows 2005). Such direct measurements complement the kinematic and orbital information obtained through the radial-velocity (RV) technique by which the vast majority of the EGPs have to date been discovered and studied. However, an EGP’s spectrum and phase-dependent light curve can in principle reveal or constrain the molecular and atomic compositions, atmospheric temperatures, cloud properties, albedos in the optical, and the degree to which the heat absorbed on the dayside is redistributed to the nightside before reradiation. The advection of heat and material from the dayside by jet streams and zonal winds will alter the dayside atmospheric temperatures and non-equilibrium compositions (Menou et al. 2002; Cho et al. 2003; Burkert et al. 2005; Iro, Bézard, & Guillot 2005; Showman & Guillot 2002; Guillot & Showman 2002), and might measurably shift the light curve with respect to the orbital ephemeris (Cooper & Showman 2005; Williams et al. 2006). Dynamic meteorology could also introduce zonal banding, as seen in Jupiter and Saturn, and temporal fluctuations, and does influence the rate with which heat is lost from the inner core (Burrows, Sudarsky, & Hubbard 2003; Burrows et al. 2004), and thereby the radius of the planet and its evolution. Moreover, such redistribution affects the near- and mid-infrared emissions from the night side, and as a result will affect the interpretation of nightside data when they become available.
The planet/star flux ratios of wide-separation EGPs ( AU) are quite low ( to 10-14) and vary widely as a function of wavelength and orbital separation (with the concomitant non-monotonic variations in geometric and Bond albedos) (Sudarsky, Burrows, & Pinto 2000; Burrows, Sudarsky, & Hubeny 2004; Sudarsky et al. 2005; Burrows 2005). Nevertheless, space-based coronagraphic techniques can be designed with inner working angles and contrast capabilities that will eventually image such planetary systems in the optical and mid-IR and distinguish planet from star (Trauger et al. 2000; Trauger, Hull, & Redding 2001). However, the close-in EGPs with orbital semi-major axes less than 0.1 AU will not be imaged separately any time soon. In these cases, distinguishing the planet’s spectrum from that of the star requires different techniques that don’t rely on imaging.
Fortunately, it has been shown recently by Charbonneau et al. (2005) and Deming et al. (2005,2006) that the Spitzer infrared space telescope can discern changes in the summed light of a transiting EGP and primary star due to the occultation of the planet by the star during secondary eclipse (phase angle, , near 0∘). The difference in the summed light just before and during planetary eclipse provides a measure of the irradiated planet’s emissions in the Spitzer IRAC bands at 3.6 m , 4.5 m , 5.8 m , and 8.0 m , in the MIPS band at 24 m , and via the Spitzer/IRS. To date, nine transiting EGPs have been discovered (Charbonneau, Brown, Burrows, & Laughlin 2006), four (HD209458b, TrES-1, HD189733b, and HD149026b) are close enough to attempt secondary eclipse measurements with adequate signals-to-noise, and, as of this writing, eclipses for three transiting EGPs have in fact been detected111The planet/star flux contrast ratio for HD149026b may, however, be too low for a successful Sptizer campaign.. The corresponding planet/star flux ratios222actually, detected electron ratios at superior conjunction are for TrES-1 0.000660.00013 and 0.002250.00036 at 4.5 m and 8.0 m , respectively (Charbonneau et al. 2005), for HD209458b 0.00260.00045 at 24 m (Deming et al. 2005), and for HD189733b 0.0055 0.00017 at 16 m in the IRS peak-up band (Deming et al. 2006). Along with the inferences using HST/STIS of the presence of sodium in the atmosphere of HD209458b (Charbonneau et al. 2002; Fortney et al. 2003; Allard et al. 2003) and of photolytic atomic hydrogen in its wind (Vidal-Madjar et al. 2003), these data are the first direct “spectral” measurements of extrasolar planet atmospheres and are early harbingers of the numerous programs of EGP remote sensing from the ground and from space being planned and/or proposed.
The secondary eclipse data for HD209458b and TrES-1 have been subjected to preliminary theoretical analysis by four groups. Burrows, Hubeny, & Sudarsky (2005) concluded that these data are best interpreted with atmospheres containing water and carbon monoxide for which redistribution to the night side is significant, but partial. They conclude that the metallicity dependence is very weak and predict that the flux at 3.6 m is higher than that at 4.5 m . They also predict a broad peak near 10 m , not so obvious in the theoretical results of others. Seager et al. (2005) emphasize the potential effects of non-solar C/O ratios above 1.0, in particular the associated lowering of the water abundance and weakening of the water absorption features. They also suggest that the dayside reradiates most of the stellar heat absorbed and incorporate into their arguments the upper limit near 2.2 m found for HD209458b by Richardson, Deming, & Seager (2003). Fortney et al. (2005) have trouble fitting the steep spectral slope seen in TrES-1 between 4.5 m and 8.0 m , without a significant enhancement in metallicity. With enhancements of 3 to 5, they fit the two TrES-1 data points to within 2- (8 m ) and 1- (4.5 m ). Furthermore, for both TrES-1 and HD209458b they prefer uniform reradiation of the absorbed stellar light over the entire planetary sphere and, hence, complete heat redistribution. Barman et al. (2005) calculate 2D planetary atmospheres and a set of light curves for TrES-1 and HD209458b and redistribute heat from the dayside with a redistribution factor (Burrows et al. 2000; Burrows, Sudarsky, & Hubbard 2003), also used by Burrows, Hubeny, & Sudarsky (2005) and Fortney et al. (2005). They assume nightside core fluxes consistent with fixed values of effective temperature (T) of 225 K and 500 K for TrES-1 and HD209458b, respectively. Barman et al. (2005) conclude that some redistribution must be occurring in the atmospheres of both HD209458b and TrES-1, but have trouble simultaneously fitting the two TrES-1 data points. All groups find that the atmospheric temperatures are, as expected, hot and above 1000 K, but the predicted planet/star contrast ratio spectra at superior conjunction vary perceptibly from group to group.
With the IRS peak-up measurement of HD189733b at 16 m , and the secondary eclipse data anticipated in the near future for the remaining combinations of object and Spitzer band 333bringing the total number of data points or constraints around secondary eclipse to 18 (!), the time is ripe for a new set of theoretical spectral models and predictions for HD209458b, TrES-1, and HD189733b at superior conjunction (), as well as for the corresponding light curves for the general phase angle, . In this paper, we provide such models and compare to the extant data to extract physical information about the atmospheres of these three transiting EGPs. We also make predictions for the light curves as a function of wavelength and the degree of redistribution to the nightside, and explore the metallicity dependence of the secondary eclipse predictions. To calculate the phase light curves, we use the 2D photon transport code and technique described in Sudarsky et al. (2005), but introduce the redistribution parameter, Pn, which is the fraction of the stellar energy intercepted by the planet that is redistributed to the nightside 444Note that with this definition, if the Bond albedo were large (which is the case only for cloudy models we don’t discuss in this paper), the Pn = 0.5 model would result in slightly greater IR fluxes from the nightside than the dayside.. Pn = 0 means no redistribution. We calculate for a given star/planet system and Pn both the dayside and nightside atmospheric temperature()/pressure() profiles and the associated spectra, and then for a given phase angle, , combine the emissions from the two hemispheres to derive the total planet fluxes at the Earth for 300 wavelengths logarithmically spaced from 2.5 m to 30 m and the corresponding planet/star flux ratios. Limb darkening effects for the day and night sides and planetary Bond, geometric, and spherical albedos for the day side are automatically derived in the calculations and are not imposed artificially.
We have opted in this paper for the Pn parametrization, and not the parametrization mentioned above and introduced by Burrows et al. (2000), because it is better tied to the core issue of heat redistribution, and because is definitionally tied to stellar irradiation, which is in fact absent on the nightside. Modeling the heating on the nightside with a flux at the base of the atmosphere that accounts for the advection of heat by winds seemed a bit more physical than heating the nightside by the ensatz of external insolation. The results are predictions for the three transiting EGPs as a function of wavelength or Spitzer band and six values of Pn ({0,0.1,0.2,0.3,0.4,0.5}). We thereby derive the dependence of the planet/star flux ratio spectra upon redistribution fraction and phase angle, albeit in the context of a simplified meteorological model. The spectral model, however, is state-of-the-art. In addition, we determine for the three close-in EGPs the approximate Pn dependence of the day and night side profiles and pay special attention to the temporal and phase dependence of the flux ratios in the IRAC bands and the 24-m MIPS band during a full orbit (), not just at superior conjunction (secondary eclipse). In this way, we provide a complete set of theoretical models both for comparison with current data and for predicting future measurements. Though our baseline models are for solar metallicity, we find that the metallicity dependence, without clouds and for solar abundance ratios, is small (see §5).
2. Why the Mid-Infrared is Best and New Theoretical Profiles
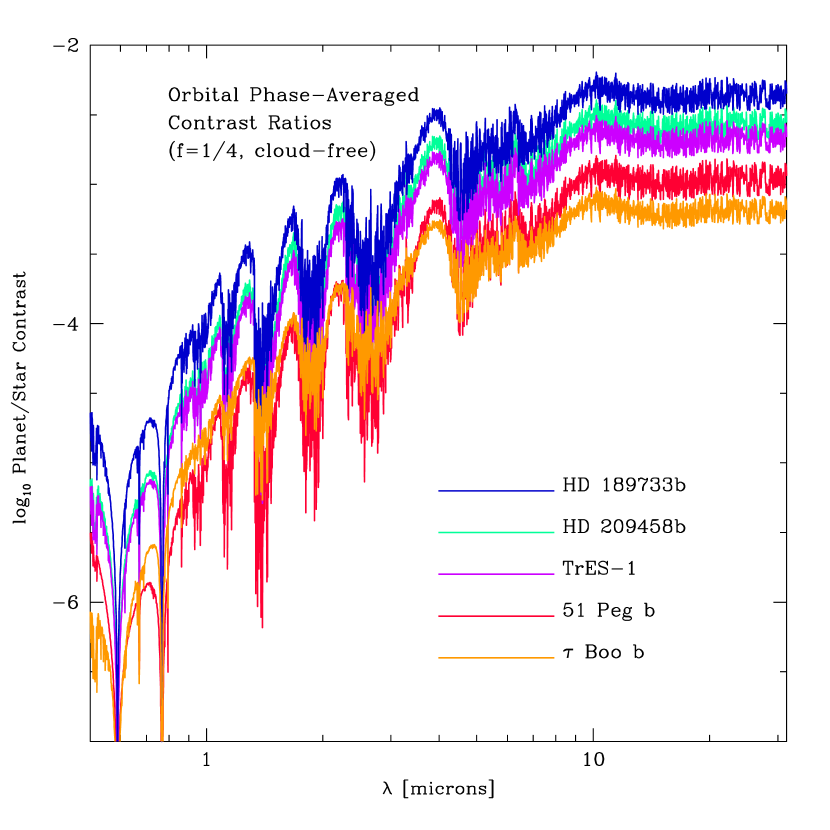
It is in the near- and mid-infrared that the planet-to-star flux ratio is most favorable for the direct detection of the light of a close-in EGP. The general theory makes this clear (Burrows et al. 2001; Burrows et al. 2004; Sudarsky et al. 2005; Burrows 2005), but this can be most easily demonstrated with a graph of the contrast ratio versus wavelength for a sample of the closest EGPs. Figure 1 depicts theoretical orbital-phase averaged (Sudarsky, Burrows, & Hubeny 2003) flux ratios from the optical through 30 m , under the assumption of complete redistribution and ignoring any possible cloud effects, for five of the most interesting close-in EGPs: HD209458b, HD189733b, TrES-1, 51 Peg b, and Boo b. The first three are transiting and are discussed in more detail in following sections.
Figure 1 demonstrates the advantages of working in the mid-IR. Not only is the stellar flux lower there, but absorption by nascent sodium and potassium in the optical and near-IR renders measurements at shorter wavelengths problematic, even for the most sensitive space telescopes. To date, only upper limits have been obtained to the planet/star contrasts in the optical and the corresponding albedos (e.g., Rowe et al. 2006). Contrasts in the optical of to are expected, improving to only to 10-3 in the near-IR.
However, as Fig. 1 suggests, in the mid-IR the planet/star contrasts rise above , making Spitzer, and later JWST, the preferred platforms for the spectral study of close-in and transiting giant planets. Note that there is a full order-of-magnitude range in the predicted average contrast ratio in the mid-IR, reflecting predominantly the range of stellar fluxes and orbital separations. Fortuitously, the transiting EGPs upon which we focus in this paper have the most favorable ratios of the set.
Table Theory for the Secondary Eclipse Fluxes, Spectra, Atmospheres, and Light Curves of Transiting Extrasolar Giant Planets lists the physical parameters we assume for the three transiting EGPs and their primaries. The most important are the orbital radius (), period (P), planetary radius (Rp), and planetary mass (Mp), along with the stellar properties that determine the stellar luminosity and spectrum. In addition, Table Theory for the Secondary Eclipse Fluxes, Spectra, Atmospheres, and Light Curves of Transiting Extrasolar Giant Planets gives the surface gravity () employed for each EGP. The stellar irradiation spectra are taken from Kurucz (1994) and we use the 1D and 2D atmosphere and irradiation codes outlined in Burrows, Sudarsky, & Hubeny (2004) and Sudarsky, Burrows, & Hubeny (2005).
Figures 2, 3, and 4 depict the profiles for both the day (solid) and night (dashed) sides of our models of HD209458b, TrES-1, and HD189733b for values of Pn from 0.0 (or 0.1) to 0.5, in steps of 0.1. Pn = 0 implies no redistribution to the nightside and Pn = 0.5 assumes that 50% of the stellar energy intercepted by the planet is advected to the night side, where it is radiated. The thicker line of the two hemisphere sequences for each EGP is for Pn = 0.5; as Figs. 2, 3, and 4 indicate, the dayside atmospheres are hotter for lower Pns, while the nightside atmospheres are cooler for lower Pns, as would be expected. Since for Pn = 0 the nightside atmosphere is so much cooler than for the other values, Pn = 0 nightside profiles are not shown.
Without clouds555In constructing the models present in this paper we have neglected clouds. This is sensible for TrES-1 and HD189733b, due to the fact that their profiles do not intercept at altitude the silicate or iron condensation curves. However, for HD209458b, clouds in its upper atmosphere may well have some effect. We plan to revisit this issue in a following paper., the albedos on the dayside are due solely to Rayleigh scattering. As a consequence, the Bond albedos are low (; Sudarsky, Burrows, & Pinto 2000) and Pn = 0.5 corresponds approximately to symmetric losses on the day and night sides. We point out that the roughly isothermal region on the dayside is an effect of stellar irradiation, which is absent on the nightside. This is the region where the outward core flux and the inwardly penetrating stellar flux are in rough balance (see Hubeny, Burrows, & Sudarsky 2003 for a more detailed explanation). It is important to note that despite the fact that the inner boundary condition for EGP atmospheres on both the day and the night sides should be that they have the same interior entropy and surface gravity, the nightside and dayside atmospheres depicted in Figs. 2, 3, and 4 clearly have different interior entropies. This is because the advection of heat to the nightside by winds and jet streams is an additional heat source. For the purposes of this study, we place this nightside source at the base of the nightside atmosphere, which as the Figures show is at much lower pressures than the convective zone on the dayside. Given that we have no model for the 3D general circulation, this is a reasonable ansatz and gives the proper emergent fluxes. The associated nightside Tis given by the formula:
| (1) |
where is the stellar flux dilution factor at the planet surface, (star) is the star’s effective temperature, and (intrinsic) is the planet’s core flux. is the Stefan-Boltzmann constant and is assumed to be 50 K for the three EGPs. At this value of , and for reasonable values (50-75 K), its effects on the emergent planet fluxes and the planet/star flux ratios are negligible, except on the nightside for Pn = 0.0.
As Figs. 2, 3, and 4 indicate, the atmosphere of HD209458b is hotter than those of TrES-1 and HD189733b. Furthermore, the atmospheric profiles of TrES-1 and HD189733b are quite similar. On HD209458b’s dayside and at a of 1 bar, ranges between 1800 K and 2100 K, while the corresponding s of TrES-1 and HD189733b range between 1500 K and 1900 K. At pressures of 0.1 bar, the difference in between the night and day sides of HD209458b ranges from +800 K to -200 K for Pn = 0.1 and Pn = 0.5, respectively, representing a wide, but reasonable, range (Showman & Guillot 2002; Guillot & Showman 2002; Iro, Bézard, & Guillot 2005). The corresponding numbers for TrES-1 and HD189733b are a bit smaller, +500 K to K. For all three transiting EGPs, one temperature does not represent the atmosphere very well. In particular, the temperatures at the wavelength-dependent photospheres range by more than 500 K. Hence, one should be cautious when inverting a “brightness” temperature to obtain an “atmospheric” temperature.
3. Orbital Variation of Planet/Star Flux Ratios in the Spitzer Bands
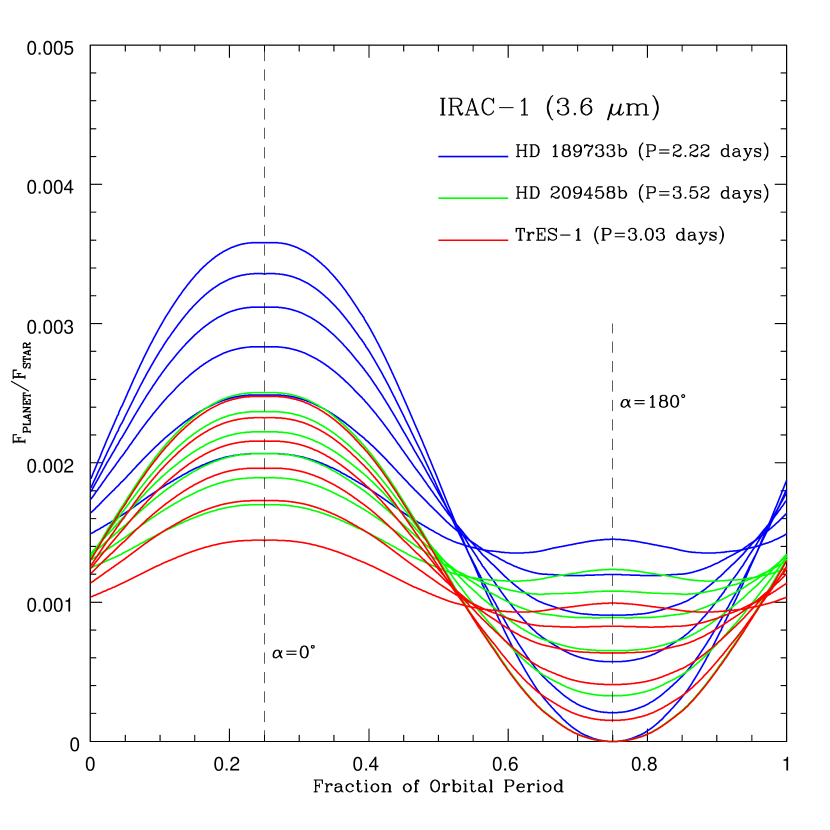
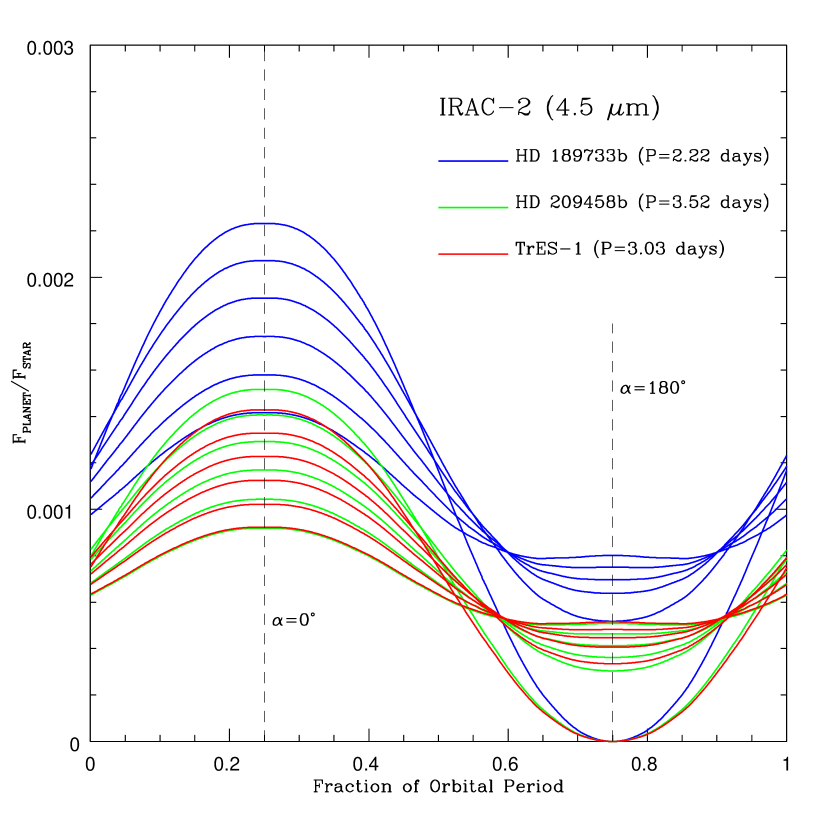
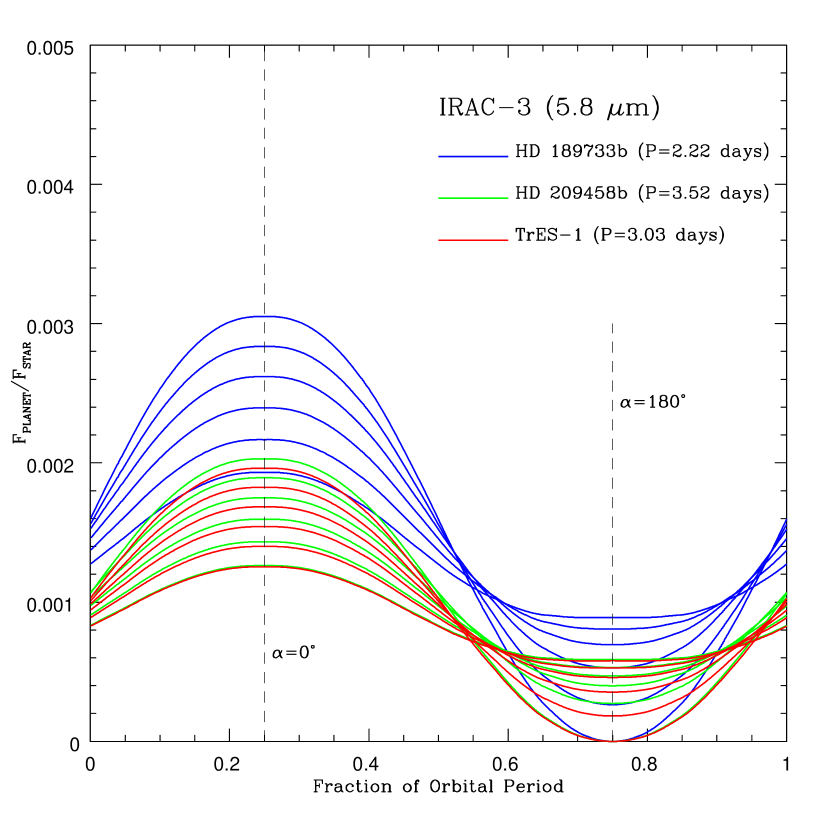
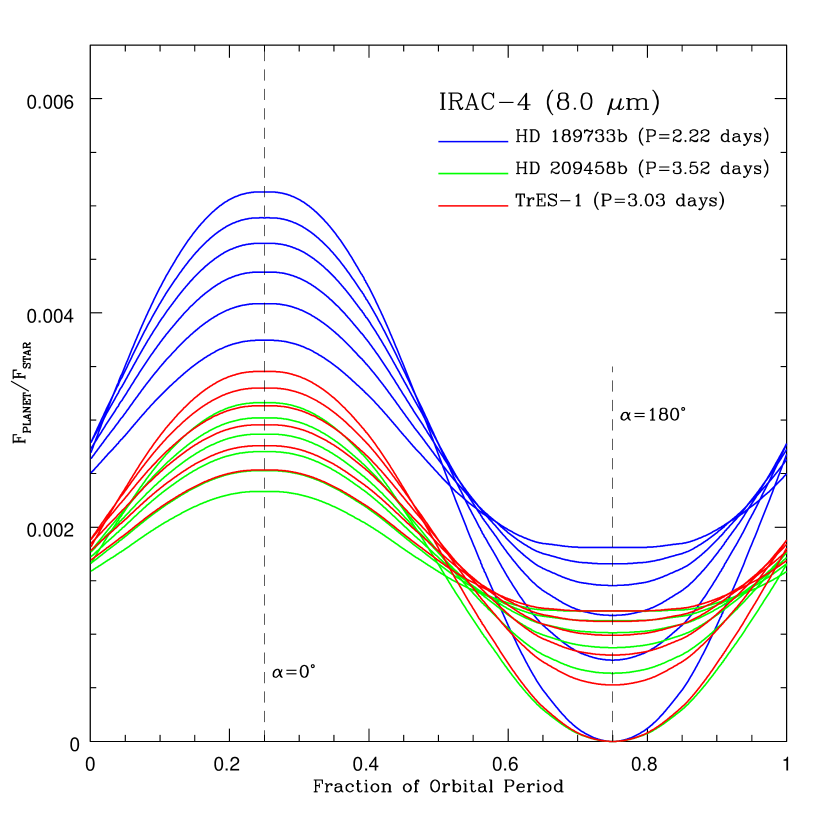
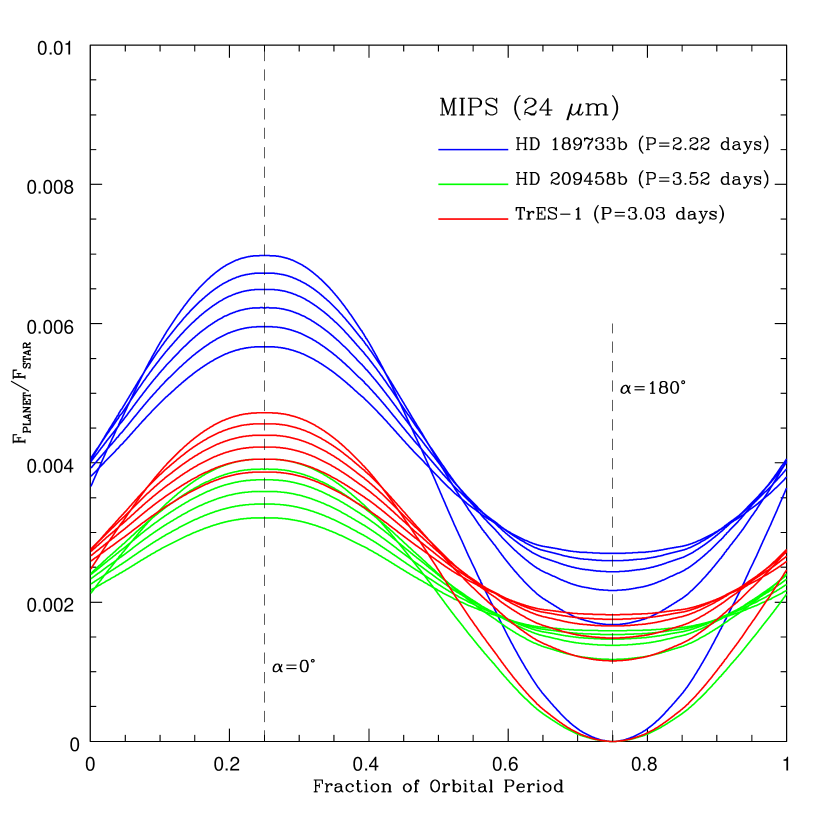
Given these atmospheric profiles, we turn next to the corresponding planet/star flux ratios in the Sptizer bands as a function of orbital phase. Figures 5, 6, 7, 8, and 9 portray the light curves in the IRAC-1 (3.6 m ), IRAC-2 (4.5 m ), IRAC-3 (5.8 m ), IRAC-4 (8.0 m ), and MIPS (24 m ) bands for HD189733b, HD209458b, and TrES-1. For simplicity, we have assumed orbital inclinations of 90∘ for all three EGPs and we do not excise the tens of minutes during which the planet is actually occulted and the ratio would drop to zero. To construct our models, we have used the latest EGP radii for HD189733b (Bakos et al. 2006) and HD209458b (Knutson et al. 2006), both of which have trended down since discovery. For each EGP, the secondary eclipse begins near , which due to the flatness of the curves near has the same planet/star ratios as at (superior conjunction). Figures 5 through 9 provide the entire orbital evolution of the contrast ratios of all three transiting planets, not just the values during secondary eclipse. The plots are versus orbit phase, or fraction of an orbital period, and the individual periods are given in Table Theory for the Secondary Eclipse Fluxes, Spectra, Atmospheres, and Light Curves of Transiting Extrasolar Giant Planets and on the figures. As expected, the highest contrast ratios at secondary eclipse are for the Pn = 0.0 models, which also manifest the largest temporal variation. In addition, for a given Pn, the highest values are for HD189733b, and in the four IRAC bands those for TrES-1 and HD209458b are similar. For the MIPS band, the TrES-1 values exceed those for HD209458b by 20-30%. For Pn = 0.0, the variation with phase about the orbit mean for all five bands is about a factor of two, while that for Pn = 0.5 is 5-10%. There is temporal variation even for the Pn =0.5 models because the profiles on the day and night sides are different, despite comparable total IR reradiation, and because the dayside optical albedos are non-zero.
As Figs. 5 through 9 indicate, the planet/star flux ratios in the IRAC bands vary with Pn by about 30-60%, depending upon object and band, but only by about 20-30% in the 24-m MIPS band. The MIPS band shows less variation with Pn at secondary eclipse because a change of Pn from 0.0 to 0.5 represents a factor of 2 decrease in the heating of the dayside and this translates into a 20% variation in the “emission” temperature. Since 24 microns is on the Rayleigh-Jeans tail, this is also the corresponding flux variation.
Figure 9 shows that the predicted flux ratio in the MIPS band at secondary eclipse varies for HD189733b between 0.55% and 0.7%, while those for TreS-1 and HD209458b vary from 0.4% to 0.47% and 0.3% to 0.4%, respectively. These large values, very different from the low values anticipated in the optical (Fig. 1), have motivated (see also Burrows, Sudarsky, & Hubeny 2003) the ongoing Spitzer observing campaigns.
4. Planet/Star Flux Ratio Spectra as a Function of Phase and Redistribution
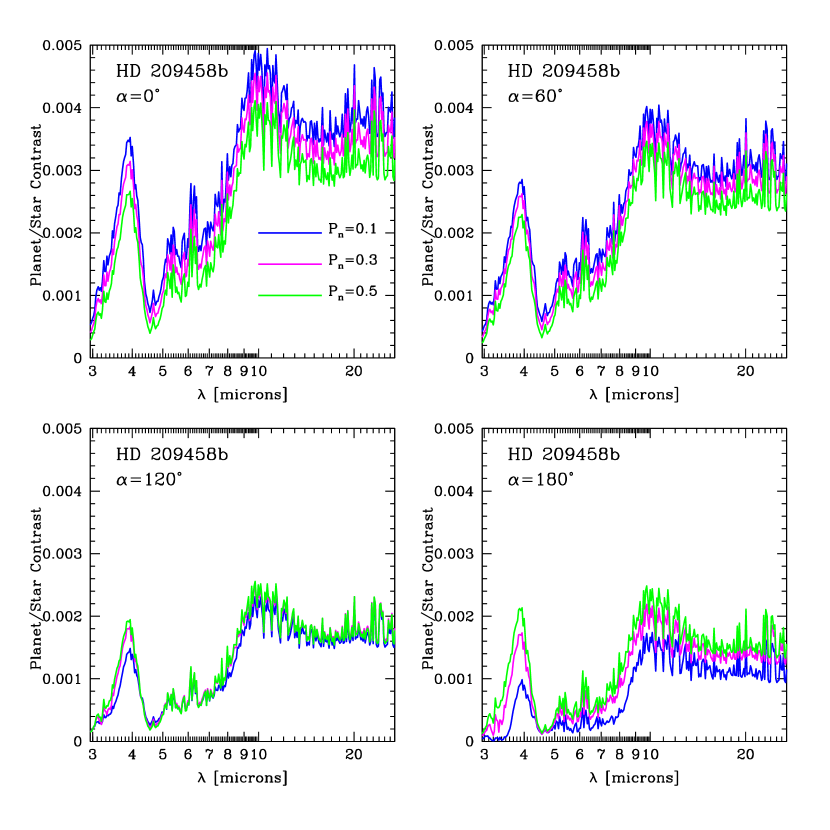
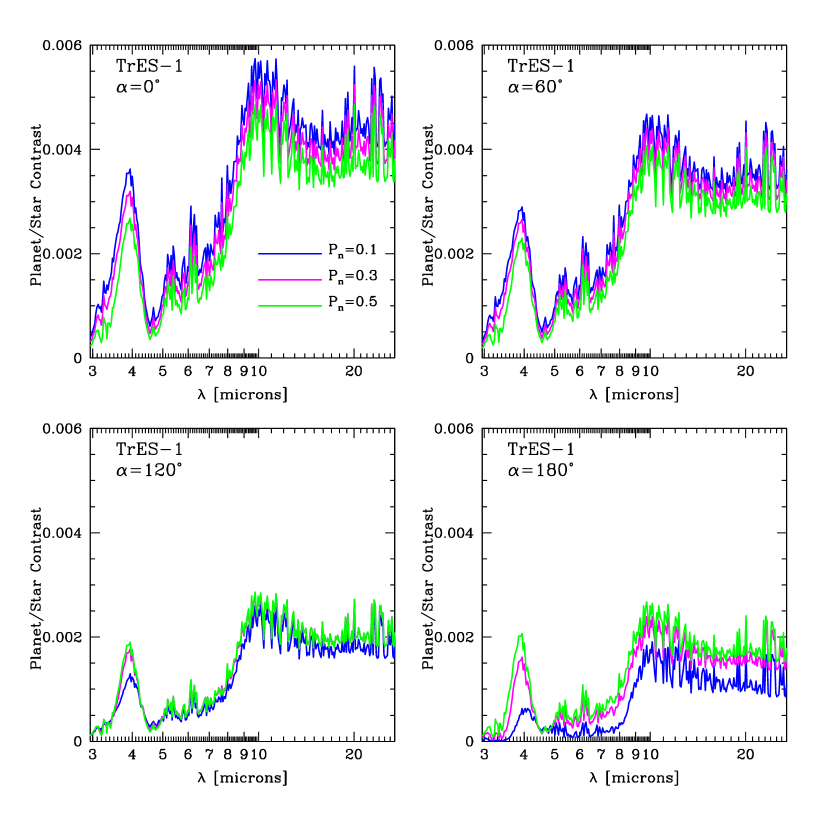
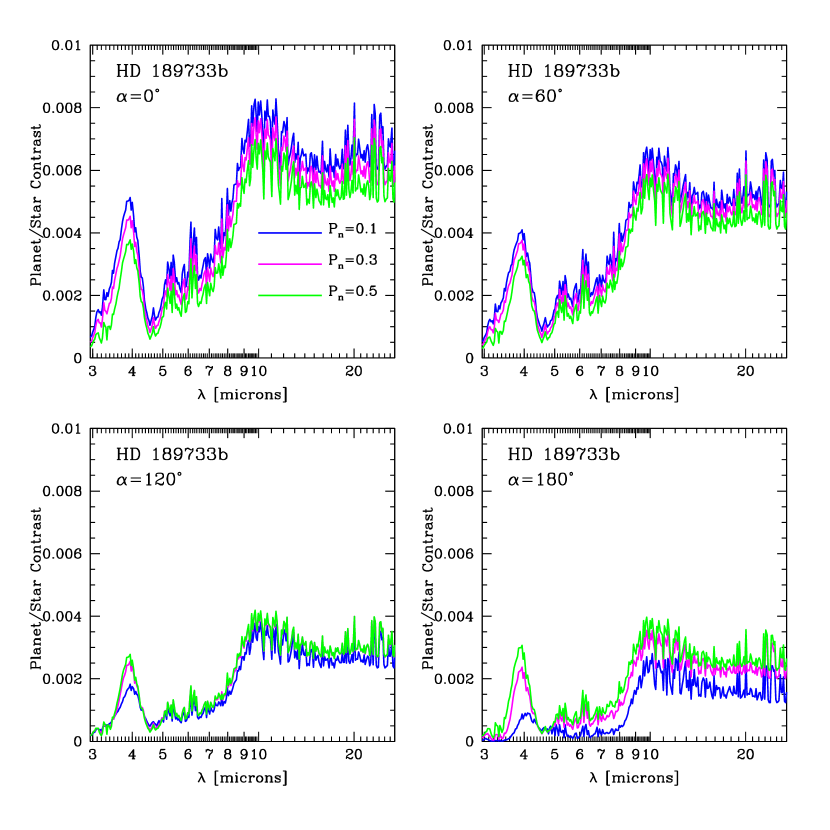
Expanding from the narrower focus on the IRAC and MIPS bands in §3, Figs. 10, 11, and 12 portray the planet/star contrast spectra from 3.0 m to 27 m for a representative subset of Pn values and for HD209458b, TrES-1, and HD189733b, respectively. Shown are these spectra for four different phase angles (0∘, 60∘, 120∘, and 180∘) and for the three Pns. These results are consonant with the band light curves given in Figs. 5 to 9, but render the full spectral dependence on Pn, transiting EGP, and orbital phase. Generically, we find peaks near 4 m and 10 m and steeper slopes from 5 m to 10 m near superior conjunction. For Pn = 0.5, the 4-m peak to 10-m peak flux ratio increases with increasing phase angle away from , but for P it generally decreases. From 14 m to 30 m , the contrast spectra are rather flat, implying that the 16-m IRS peak-up and the 24-m MIPS numbers should be comparable. At 60∘ and 120∘, the models with different Pns, while different, are most similar. Naturally, the spectra at 180∘ are entirely due to the nightside. At a given wavelength, the magnitudes of the phase and temporal variations are similar to those discussed in §3 for those IRAC or MIPS bands that are closest in wavelength. Figures 5 through 12 summarize our theoretical calculations and predictions.
5. Comparison of Theory with Data at Secondary Eclipse and Conclusions
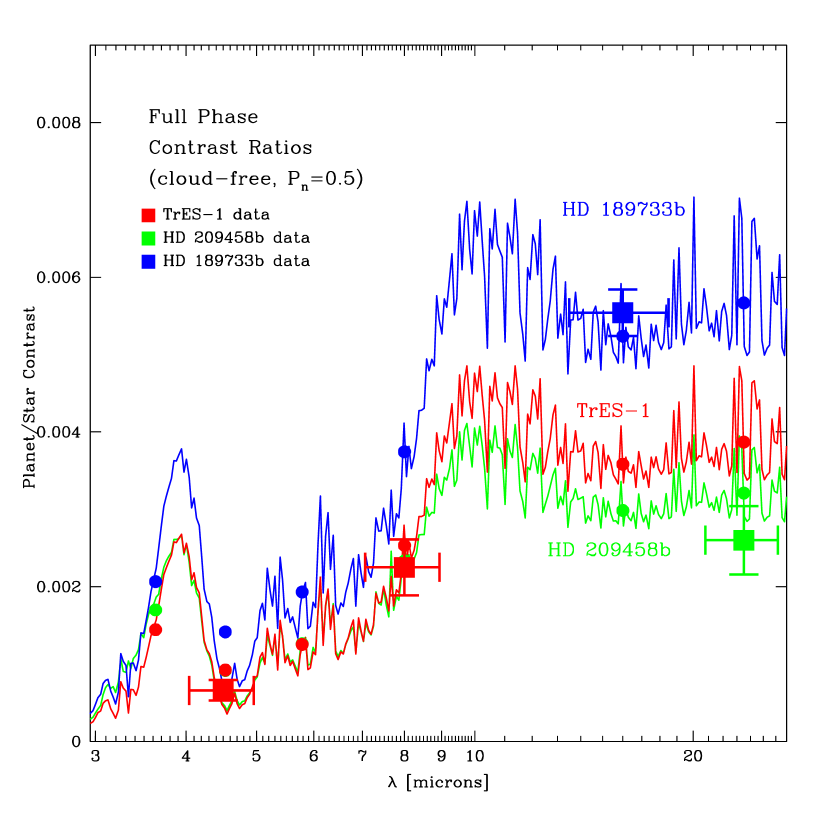
We now turn to specific comparisons between the extant Spitzer data and our theoretical results. Figure 13 portrays the planet/star flux ratios versus wavelength at superior conjunction for Pn = 0.5 (complete redistribution) and the three transiting EGPs: HD189733b (blue), TrES-1 (red), and HD209458b (green). Superposed as large squares with 1- flux error bars are the four secondary eclipse measurements to date (two for TrES-1, one for HD209458b, and one for HD189733b). Also included as round dots in the appropriate color are the band-integrated detected electron ratio predictions for these EGP models, with approximate band widths indicated and no error bars in the flux direction.
A comparison between the measured points and corresponding theoretical points for this Pn = 0.5 model is encouraging, particularly for the TrES-1 data at 4.5 m and 8.0 m , but also for the HD189733b IRS peak-up data point near 16 m . The 24-m point for HD209458b is within about 1-, but slightly below the theory. Since these Pn=0.5 models yield the lowest theoretical values for the contrast ratios among the set from 0.0 to 0.5, for the HD209458b 24-m point this may be the best we can do currently. For the HD189733b point at 16 m , the entire Pn range studied would still be consistent to within the 1- range quoted (see the top left panel of Fig. 12), with perhaps only the Pn = 0.0 model mildly discounted, rendering problematic for this EGP the constraint on the degree of heat redistribution from this one point alone. As Fig. 6 suggests, values of Pn of 0.0, 0.1, 0.2, and 0.3 do not fit the TrES-1 data point at 4.5 m to at least 2-, while values of Pn of 0.0 and 0.1 do not fit the TrES-1 data point at 8.0 m to the 2- level. The other values of Pn can not be excluded. Hence, we conclude that while some heat redistribution by winds to the nightside is definitely indicated for TrES-1 and HD209458b, the degree of redistribution is harder to constrain, with a slight bias towards the larger values of Pn.
The steep slope from 4.5 m to 8.0 m is best explained by the rise to a peak near 10 m , which in our models is a natural consequence of the relative strength and positions of water bands longward of 5.5 m (Fig. 11). Note that without a large water abundance, none of the data nor their ratios would make collective sense. This was the conclusion of Burrows, Hubeny, & Sudarsky (2005), which we reconfirm here. Furthermore, the presence of the 4.67 m band of CO is indicated by the depth of the 4.5-m feature of TrES-1, but due to the fact that this IRAC-2 band measurement perforce sums over steeply rising fluxes in regions of the spectrum that bracket the 4.67 m feature, and the fact that with reasonable abundances the band is saturated, almost nothing can be said about the CO abundance (Burrows, Hubeny, & Sudarsky 2005). We predict a rise from IRAC-2 to IRAC-1 for all our models, indicative of the peak we generically see just shortward of 4.0 m . We also predict a slight peak around 10 m , and a plateau from 14 m to 30 m . The peak near 10 m might be discernible for HD189733b using the full capability of Spitzer/IRS. The predicted plateau seems suggested by the comparison between theory and data for the HD189733b 16-m and HD209458b MIPS points, taken together, but mixing objects (as we have been forced to do with only four data points) is not very satisfying.
We have calculated a Pn = 0.5 model for HD209458b with solar metallicity and, contrary to the conclusion of Fortney et al. (2005), we find that the band contrast ratios are within 5% of those with solar abundances. This is because, without clouds, the Bond albedos are very low (5%). Since changing the metallicity does not change the total stellar light intercepted by the planet for a given planet radius, the characteristic atmospheric temperatures are similar. What is more, we find that the profiles are also similar, with the result that the fluxes and contrast ratios are little altered. We have not been able to trace the origin of the difference between our results for higher metallicities and those of Fortney et al. (2005). However, we interpret the very weak metallicity dependence of the contrast ratios at secondary eclipse for EGP models without clouds that we find theoretically to indicate that the metallicity may well be supersolar and large. However, by the same token, we conclude that the metallicity can not easily be constrained nor measured by secondary eclipse data alone. Cloud models, which we expect may be relevant for HD209458b alone among the three EGPs (Fortney et al. 2003; Sudarsky, Burrows, & Hubeny 2003), may well change this conclusion and variations in the C/O ratio, while we do not see any need at this time to invoke them to fit the four Spitzer data points, are still of interest (Seager et al. 2005).
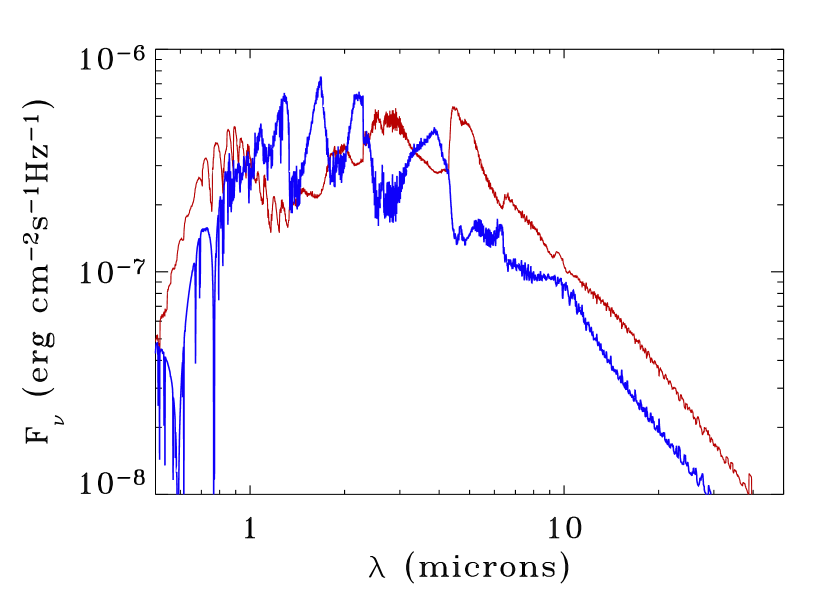
One way to significantly alter the planet/star contrast ratios is to introduce at altitude a strong absorber in the optical and near-UV, where the incident stellar flux can be large. In this way, the upper atmosphere is heated. The associated reradiated optical flux is also greater and the profile manifests a “stratospheric” inversion (Hubeny, Burrows, & Sudarsky 2003). Since the mid-IR fluxes originate higher up in the atmosphere than where 1, the associated brightness temperatures from 4 m to 30 m are also enhanced. The increase in the emergent fluxes in the optical and mid-IR leads to a corresponding suppression in the near-IR (1-4 m ). This potential mechanism for altering our baseline predictions in the Spitzer bands and for suppressing flux in the near-IR, particularly in the , , and bands, should be borne in mind. Figure 14, constructed from a theoretical model found in Hubeny, Burrows, & Sudarsky (2003), depicts an extreme version of this effect for Pn = 0 models of OGLE-TR56b with (red curve) and without (blue curve) TiO and VO in its upper atmosphere. In fact, we expect that TiO and VO are both flushed out of the upper atmosphere by the coldtrap effect, but suppressing this effect allows us to make the general point. Note that the bumps near 10 m and 4 m seen in our fiducial models (Figs. 10 – 12 and Fig. 13) can be altered, shifted (4 m ), or muted (10 m ) by this upper-atmosphere absorption effect, so if we fail to see these features as predicted interesting stratospheric or upper-atmosphere chemistry might be implied. Conversely, the presence of these bumps will put useful limits on such upper-atmosphere absorbers.
As mentioned in §1, we employ the latest measurements of the transit radii of each of the three EGPs in determining the planet/star contrast levels. However, these radii, being transit radii that probe along the chord of the planet in the optical (Burrows, Sudarsky, & Hubbard 2003), are not strictly the appropriate radii to use in determining the planet/star contrast ratios. They are close, but the total stellar energy intercepted by the planet depends upon wavelength and is different in the near-IR water bands, where the transit radius should be slightly larger than in the optical (for HD209458b, by 2-3%; Fortney et al. 2003). Furthermore, planetary emission is from a radius that is not corrected for by the “transit radius effect.” For HD20948b, this radius difference can be 8-10% (Burrows, Sudarsky, & Hubbard 2003), while for TrES-1 and HD189733b, due to the lower atmospheric temperatures and higher gravities the effect is smaller (5%). The upshot is that the predicted flux ratios for HD209458b could be smaller by as much as 15%, bringing the 24-m MIPS point better in line with our prediction, but introducing further ambiguities into predictions at all wavelengths until the radius issue is resolved. No one doing theoretical secondary eclipse calculations has yet corrected for these subtle radius effects. Moreover, even the measured transit radii retain a residual ambiguity due to the systematic uncertainty in the stellar radius, which could easily be 5-10%. Knutson et al. (2006) argue that measurements of the star, constraints of stellar evolution theory (Cody & Sasselov 2002), and the detailed fits to the HST/STIS transit measurements together yield a transit radius for HD209458b with an error of only 2%. Perhaps, but our same concerns apply to TrES-1 and HD189733b. In sum, ambiguities in the appropriate radii to employ in comparing secondary eclipse data with theory remain and slightly compromise their interpretation.
However, that the data and theory we have developed here correspond as well as they do is gratifying. In fact, the theory does a good job fitting the four secondary eclipse data points (Fig. 13), whatever the ambiguities. In addition, there is evidence for redistribtuion to the nightside, particularly for TrES-1 and HD209458b, (though its specific magnitude remains to be determined), and the presence of H2O and of CO is strongly indicated. Moreover, we find that the metallicity dependence of cloud-free models is quite mild, but that ambiguities in the radii remain to slightly compromise the interpretation of the data. Due to the greater sensitivity in the IRAC bands to variations in Pn (Figs. 5 - 8), such data have greater potential to determine the degree(s) of redistribution. Data off secondary eclipse at other phase angles, and particularly in IRAC-4 (Figs. 10 - 12), would further constrain the models, but the most propitious phase angles in this regard are larger than 90∘ and, hence, will prove very difficult to measure. However, JWST, with its two to three orders-of-magnitude greater sensitivity in the mid-IR, will be able to measure a large fraction of the planetary light curves. In the shorter term, data, or even upper limits, at the 14 other anticipated Spitzer band points are anxiously awaited.
References
- Allard et al. (2003) Allard, F., Baraffe, I., Chabrier, G., Barman, T.S., & Hauschildt, P.H. 2003, in “Scientific Frontiers in Research on Extrasolar Planets,” ASP Conf. Series vol. 28 (PASP v.294), eds. D. Deming & S. Seager, p. 483
- Bakos et al. (2006) Bakos, G. Á. et al. 2006, submitted to ApJ, (astro-ph/0603291)
- Barman, Hauschildt, & Allard (2005) Barman, T.S., Hauschildt, P.H., & Allard, F. 2005, ApJ, 632, 1132
- Burkert et al. (2005) Burkert, A., Lin, D.N.C., Bodenheimer, P., Jones, C., & Yorke, H. 2005, ApJ, 618, 512
- Burrows et al. (2000) Burrows, A., Guillot, T., Hubbard, W. B., Marley, M. S., Saumon, D., Lunine, J. I., & Sudarsky, D. 2000, ApJ, 534, 97
- Burrows, Sudarsky, & Hubbard (2003) Burrows, A., Sudarsky, & Hubbard, W.B. 2003, ApJ, 594, 545 (BSH)
- Burrows, Sudarsky, & Hubeny (2003) Burrows, A., Sudarsky, D., & Hubeny, I. 2003, published in the proceedings of the 14th Annual Astrophysics Conference in Maryland “The Search for Other Worlds,” eds. S. Holt and D. Deming, (AIP Conference Proceedings), held in College Park, MD, October 13-14, 2003, p. 143.
- Burrows, Sudarsky, & Hubeny (2004) Burrows, A., Sudarsky, D., & Hubeny, I. 2004, ApJ, 609, 407
- Burrows et al. (2004) Burrows, A., Hubeny, I., Hubbard, W.B., Sudarsky, D., & Fortney, J.J. 2004 ApJ, 610, L53
- Burrows (2005) Burrows, A. 2005, Nature, 433, 261
- Burrows et al. (2005) Burrows, A., Hubeny, I., & Sudarsky, D., 2005 ApJ, 625, L135
- Charbonneau et al. (2000) Charbonneau, D., Brown, T. M., Latham, D. W., & Mayor, M. 2000, ApJ, 529, L45
- Charbonneau et al. (2002) Charbonneau, D., Brown, T. M., Noyes, R. W., & Gilliland, R. L. 2002, ApJ, 568, 377
- Charbonneau et al. (2005) Charbonneau, D. et al. 2005, ApJ, 626, 523
- Charbonneau et al. (2006) Charbonneau, D. Brown, T.M., Burrows, A., & Laughlin, G. 2006, to be published in “Protostars and Planets V,” ed. B. Reipurth and D. Jewitt (University of Arizona Press), astro-ph/0603376
- Cho et al. (2003) Cho, J. Y-K., Menou, K., Hansen, B. M. S., & Seager, S. 2003, ApJ, 587, L117
- Cody & Sasselov (2002) Cody, A. M. & Sasselov, D. D. 2002, ApJ, 569, 451
- Cooper & Showman (2005) Cooper, C.S. & Showman, A.P. 2005, ApJ, 629, L45 (astro-ph/0502476)
- Deming et al. (2005) Deming, D., Seager, S., Richardson, L.J., & Harrington, J., 2005, Nature, 434, 740
- Deming et al. (2006) Deming, D., Harrington, J., Seager, S., Richardson, L.R. 2006, submitted to ApJ
- Fortney et al. (2003) Fortney, J.J., Sudarsky, D., Hubeny, I., Cooper, C.S., Hubbard, W.B., Burrows, A., & Lunine, J.I. 2003, ApJ, 589, 615
- Fortney et al. (2005) Fortney, J.J., Marley, M.S., Lodders, K., Saumon, D., Freedman, R.S. 2005, ApJ, 627, L69
- Guillot & Showman (2002) Guillot, T. & Showman, A. P. 2002, A&A, 385, 156
- Hubeny, Burrows, & Sudarsky (2003) Hubeny, I., Burrows, A., & Sudarsky, D. 2003, ApJ, 594, 1011
- Iro, Bézard, & Guillot (2005) Iro, N., Bézard, B., & Guillot, T. 2005, A&A, 436, 719
- Knutson et al. (2006) Knutson, H., Charbonneau, D., Noyes, R.W., Brown, T.M., Gilliland, R.L. 2006, submitted to ApJ, astro-ph/0603542
- Kurucz (1994) Kurucz, R. 1994, Kurucz CD-ROM No. 19, (Cambridge: Smithsonian Astrophysical Observatory)
- Menou et al. (2002) Menou, K, Cho, J. Y-K., Hansen, B. M. S., & Seager, S. 2003, ApJ, 587, L113.
- Richardson, Deming, & Seager (2003) Richardson, L.J., Deming, D., & Seager, S. 2003, ApJ, 597, 581
- Rowe et al. (2006) Rowe, J.F., Matthews, J.M., Seager, S., Kuschnig, R., Guenther, D.B., Moffat, A.F.J., Rucinski, S.M., Sasselov, D., Walker, G.A.H., & Weiss, W.W. 2006, accepted to ApJ, 645 (astro-ph/0603410)
- Seager et al. (2005) Seager, S., Richardson, L.J., Hansen, B.M.S., Menou, K., Cho, J.Y.-K., & Deming, D. 2005, ApJ, 632, 1122
- Showman & Guillot (2002) Showman, A. P. & Guillot, T. 2002, A&A, 385, 166
- Sudarsky et al. (2000) Sudarsky, D., Burrows, A., & Pinto, P. 2000, ApJ, 538, 885
- Sudarsky, Burrows, & Hubeny (2003) Sudarsky, D., Burrows, A., & Hubeny, I. 2003, ApJ, 588, 1121
- Sudarsky, Burrows, Hubeny, & Li (2005) Sudarsky, D., Burrows, A., Hubeny, I., & Li, A. 2005, ApJ, 627, 520 (see http://zenith.as.arizona.edu/~burrows/phase/lightcurve.php)
- Trauger et al. (2000) Trauger, J. et al. 2000, BAAS, 197, # 49.07, 1486
- Trauger, Hull, and Redding (2001) Trauger, J., Hull, A.B., & Redding, D.A. 2001, BAAS, 199, # 86.04, 1431
- Vidal-Madjar et al. (2003) Vidal-Madjar, A., Lecavelier des Etangs, A., Désert, J.-M., Ballester, G.E., Ferlet, R., Hébrand, G., & Mayor, M. 2003, Nature, 422, 143
- Williams et al. (2006) Williams, P.K.G., Charbonneau, D., Cooper, C.S., Showman, A.P., Fortney, J.J., submitted to ApJ, astro-ph/0601092
| EGP | Star | M∗ (M⊙) | R∗ (R⊙) | (AU) | P (days) | Mp (M) | Rp (RJ) | Log10 (cgs) | [Fe/H] |
|---|---|---|---|---|---|---|---|---|---|
| HD209458b | G0V | 1.05 | 1.1 | 0.045 | 3.524 | 0.69 | 1.32 | 2.99 | 0.01 |
| HD189733b | K2V | 0.82 | 0.75 | 0.031 | 2.22 | 1.15 | 1.154 | 3.25 | -0.03 |
| TrES-1 | K0V | 0.87 | 0.86 | 0.0393 | 3.03 | 0.76 | 1.08 | 3.21 | 0.0 |
References. — R(Jupiter’s radius) = km; see J. Schneider’s Extrasolar Planet Encyclopaedia at http://www.obspm.fr/encycl/encycl.html and the Carnegie/California compilation at http://exoplanets.org