Gas-phase CO in protoplanetary disks: A challenge for turbulent mixing
Abstract
This is the first paper in a series where we study the influence of turbulent diffusion and advective transport on the chemical evolution of protoplanetary disks, using a 2D flared disk model and a 2D mixing gas-grain chemical code with surface reactions. A first interesting result concerns the abundance of gas-phase CO in the outer regions of protoplanetary disks. In this Letter we argue that the gas-phase CO concentration in the disk regions, where the temperature is lower than K, can be significantly enhanced due to the combined effect of vertical and radial mixing. This finding has a potential implication for the current observational data on the DM Tau disk chemistry.
1 Introduction
The angular momentum redistribution and associated global mass transport phenomena (advection, turbulent diffusion) constitute an inherent factor of protoplanetary disk evolution (e.g., Morfill & Völk, 1984; Clarke & Pringle, 1988; Johansen & Klahr, 2005). There are many observational facts indicative of both large-scale and small-scale radial mixing, e.g, the presence of crystalline dust in comets (Bockelée-Morvan et al., 2002; Wooden et al., 2005) and protoplanetary disks (Gail, 2001; van Boekel et al., 2004). Radial mixing has also been invoked to explain the distribution of water ice in the Solar Nebula (Cyr et al., 1998), deuteration in the Solar Nebula (Hersant et al., 2001), and isotopic abundances in meteorites (Boss, 2004).
Because of the complexity of the transport problem, disk chemistry has been often treated without considering dynamics or only with inward advection (e.g., Bauer et al., 1997; Willacy et al., 1998; Aikawa & Herbst, 1999; Markwick et al., 2002). By now, there are only three papers where the turbulent transport in protoplanetary disks is treated in conjunction with the time-dependent chemistry. Ilgner et al. (2004) have considered vertical turbulent diffusion and radial advection in the inner part of a protoplanetary disk (in the 1+1D approximation) to study the effect of mixing on sulfur chemistry. Ilgner & Nelson (2006) studied the impact of vertical diffusive turbulent transport on the fractional ionization in the inner part of a protoplanetary disk. Willacy et al. (2006) considered the influence of vertical turbulent diffusion on the chemical evolution of the outer disk. They have shown that vertical diffusion greatly affects the column densities of many species and may have an effect detectable in millimeter and sub-millimeter observations.
There are molecular line observations of the outer parts of protoplanetary disks that cannot easily be explained with chemical models for static disks. One of the puzzles is the abundant gas-phase CO in the DM Tau outer disk, where the kinetic temperature is lower than K (Dartois et al., 2003). In the absence of effective desorption mechanisms, CO molecules are supposed to be completely frozen out in the cold midplane. Aikawa & Nomura (2006) suggested that the existence of such cold CO gas can be explained by vertical mixing. In this Letter we show that the solution to the enhanced gas-phase CO can be found within the framework of a 2D non-static (dynamical) chemical disk model, even though the abundance predicted in the current study is still lower than observed. We demonstrate that in order to assess the importance of turbulent transport processes, in general, one has to consider vertical and radial mixing simultaneously.
2 Disk model
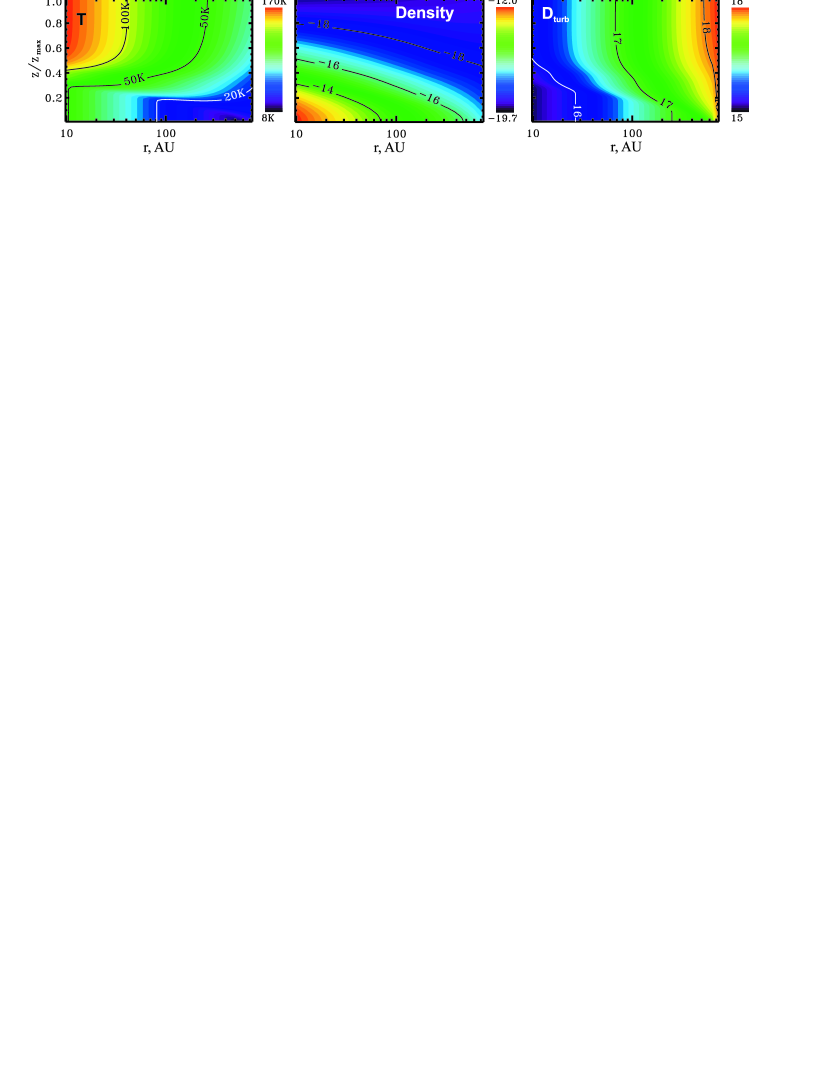
The disk physical and chemical model will be comprehensively described elsewhere (Semenov et al., in preparation). Briefly, we adopt the disk structure (i.e. density and temperature) from a steady-state irradiated disk model developed by D’Alessio et al. (1998, 1999). The disk has a radius of 800 AU, an accretion rate yr-1, a viscosity parameter , and a mass of . This value is comparable to the inferred DM Tau disk mass of 0.05 (Dutrey et al., 1997). The temperature and density structure of the model disk is shown in Fig. 1 (left and middle panels). The vertical coordinate in this and other figures is measured in units of the relative height above the disk plane, so that . The disk semi-thickness is the height at a constant pressure dyn cm-2. The ratio is 0.9 at 100 AU and 1.5 at 800 AU.
The disk is illuminated by UV radiation from a central star with an intensity of at AU and by interstellar UV radiation (1D penetration, Draine, 1978; Bergin et al., 2003). The dust grains are assumed to be uniform m spherical particles in the chemical model. This assumption is formally inconsistent with the grain size distribution used in the disk model. However, the relevant parameter for our chemical model is the total dust surface area (per unit volume). It differs from the dust surface area in the disk model by no more than a factor of 2. The self- and mutual-shielding of CO and H2 is computed as in Lee et al. (1996). Three other energy sources are cosmic rays, short-living radionuclides, and stellar X-rays.
The X-ray ionization rate is computed according to Glassgold et al. (1997) with parameters for their high depletion case and the luminosity value erg cm-2 s-1 (Glassgold et al., 2005). A gas-grain chemical model with surface reactions from Semenov et al. (2005) is utilized. The gas-phase reaction rates are taken from the UMIST 95 database (Millar et al., 1997), with some rates updated according to recent measurements. Cosmic-ray induced desorption, X-ray induced desorption, thermal desorption, and photodesorption are taken into account. Applying the reduction techniques described in Wiebe et al. (2003) to a static model with molecular (TMC1-like) initial abundances, we isolated a network consisting of 263 species and 1139 reactions. The disk chemical structure, modeled with this network, has been compared with predictions of the full network for a static model and for models with vertical and radial diffusion. This comparison has shown that the reduced network allows to follow the evolution of CO, H2CO, and other interesting molecules with an accuracy of a factor of . In this Letter we utilize this reduced network.
In addition to time-dependent chemistry, we consider radial and vertical turbulent mixing using the approach of Xie et al. (1995), in which turbulence is treated as if it were a diffusion process. The diffusion coefficient is estimated as
| (1) |
where is the viscosity, is the sound speed, is the scale height, and is the efficiency of turbulent transport (see e.g. Shakura & Sunyaev, 1973; Brandenburg & Sokoloff, 2002; Schräpler & Henning, 2004; Johansen & Klahr, 2005). If the efficiency parameter is close to unity (as assumed in this study), the typical value of in disks at 100 AU should be about cm2 s-1 (Fig. 1, right panel). Note that the vertical mixing timescale in this case can be estimated as , which gives years for AU. Advection due to global gas motions is not taken into account.
The equations of chemical kinetics are integrated simultaneously with the diffusion terms in the Eulerian description, using a fully implicit 2D integration scheme. Radial mixing is in general less of an effect on the disk chemistry than vertical mixing, while full 2D mixing acts as a combination of both processes. The latter fact justifies the use of approximate, fast operator-splitting integration schemes, in which radial and vertical mixing processes are treated separately, in addition to time-dependent chemistry (e.g., Keller & Gail, 2004). All the equations are solved on a non-uniform staggered grid consisting of 30 radial points (from 10 to 800 AU) and 65 vertical points. This resolution was found to be optimal for mixing problems in a protoplanetary accretion disk. The evolutionary time span is 5 Myr.
3 Results and Discussion
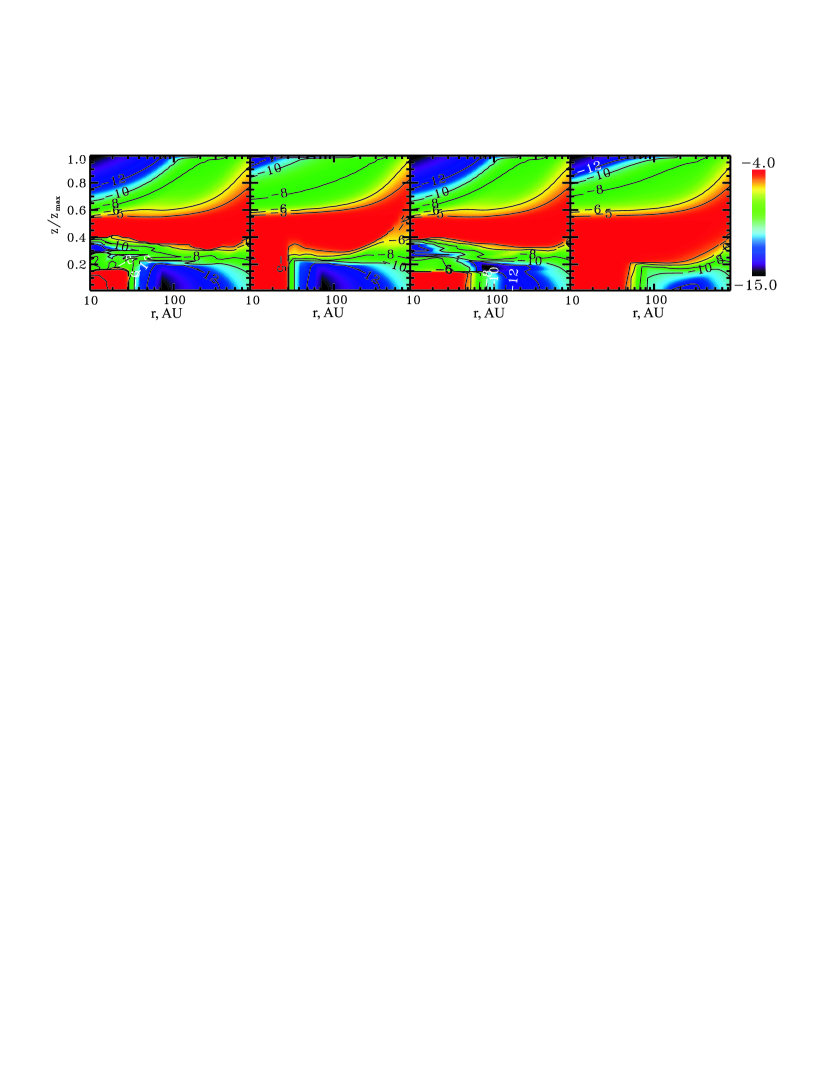
Our main set of results consists of four runs (Fig. 2), with the static chemical model (no transport processes are taken into account), with vertical mixing only, with radial mixing only, and, finally, with simultaneous mixing in both directions.
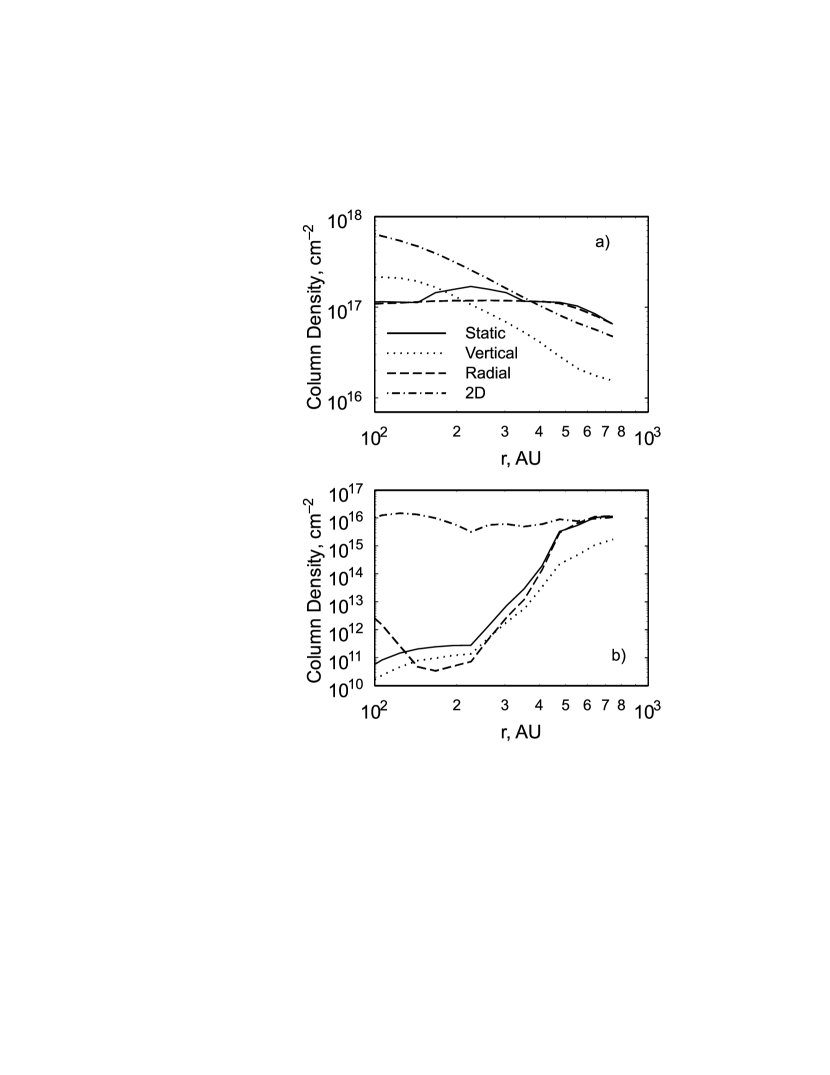
The well-known “sandwich-like” structure typical of protoplanetary disks is evident in all plots. The location of the warm molecular CO layer is defined by photodissociation from above and freeze-out from below. It is natural to expect that this feature is especially sensitive to vertical mixing since the abundance gradient in the vertical direction is very steep. However, neither of the considered transport processes drastically changes its abundances in the upper disk, which is further illustrated in Fig. 3. Total column densities, shown in the top panel of Fig. 3, differ by less than an order of magnitude in all four models.
This situation is different in the cold disk midplane, where CO molecules are essentially frozen out onto dust grains within a few years. After this rapid phase of the CO depletion, slow surface reactions control its chemical evolution, leading to the formation of more complex (organic) molecules (Awad et al., 2005). Consequently, the CO chemistry does not reach an equilibrium state even after 5 Myr of the evolution in the disk midplane. The characteristic timescale of turbulent diffusion in the disk is about years, and thus mixing should modify the CO concentration mostly in the disk midplane.
Indeed, the CO gas-phase abundances are substantially enhanced due to turbulent diffusion in the outer midplane region, where AU and (compare left and right panels in Fig. 2). This region is the coldest disk part where the temperature is mostly below the freezing point of K for CO, and can be as low as 8 K (Fig. 1, left panel). Therefore, it is not a surprise that in the static model the final relative CO abundance for the outer midplane of the DM Tau disk does not exceed and is typically much lower.
Neither vertical, nor radial mixing alone can change the situation in the DM Tau disk model. In contrast, 2D-mixing makes the “hole” in the CO concentration less prominent in the coldest region of the disk, and the entire zone of heavy CO depletion is smaller than in the static case. The average CO abundance is close to and the upper boundary of the strong CO depletion is located at a smaller height, , compared to of about 0.3 for the non-mixing case. Changes in column densities through the cold midplane are also significant. In Fig. 3 (bottom panel) we show contributions to the CO column density from the region where K. At AU, the model with only vertical mixing shows lower CO column density compared to the static model due to more effective conversion CO to H2CO on grain surfaces. In the model with radial mixing, the CO column density is only enhanced at AU, while in the 2D model it is higher than in other models by a few orders of magnitude up to AU, mainly due to outward transport of CO in radial direction.
What is the reason for the high midplane mixing efficiency in the 2D model? It is usually assumed that the vertical mixing is more effective than the radial mixing. This is correct for the disk as a whole. But close to the midplane there is no vertical abundance gradient, so that vertical mixing does not occur in this region. Therefore, vertical mixing is unable to remove the midplane depletion region at around 100 AU, while being able to smear out the elevated depletion area located at AU (Fig. 2, second panel). The radial temperature (and abundance) gradient is steeper in the midplane, so the mixing there occurs predominantly in radial direction. In the model with only the radial mixing, gas-phase CO is transported from the inner disk toward the outer midplane extending the region of abundant CO from the initial radius of about 50 AU to more than 100 AU and beyond.
The appearance of the maps in coordinates should not be misinterpreted. The region of low CO abundance at , which extends over almost the entire disk, in fact, bends up at higher radii, following the disk flaring. So, the linear distance that has to be traveled by species being mixed is much greater in this region than closer to the midplane. Therefore, this region cannot be destroyed by the radial mixing alone, and the vertical mixing is needed to smoothen the CO distribution. The net outcome of this interplay between temperature gradients, disk geometry, and chemistry is that both mixing effects are needed to produce the high gas-phase abundance all over the outer midplane region. The radial mixing brings gas-phase CO from the warm inner part of the disk and from its outer part, where the freezing timescale is somewhat longer, which causes somewhat higher midplane gas-phase CO abundances. So, it is actually the radial mixing that causes enhanced gas-phase CO in the very midplane. The vertical mixing lifts CO above the midplane and helps to fill in gaps in the CO distribution, evident in 1D mixing models. Thus, turbulent mixing is capable to replenish the CO gas in the low temperature disk regions, competing successfully with the opposite process of CO freeze-out.
There seems to be an observational evidence toward this effect. Recently, Dartois et al. (2003) have found a reservoir of abundant CO gas in the outer disk midplane. According to their data, this region of nearly constant low temperature of K is located at AU and (see also Fig. 1, left panel). This is the region where turbulent mixing tends to increase the gas-phase CO concentration.
Even though the midplane CO abundance is increased by orders of magnitude in the 2D model, it is still not high enough. Specifically, column density of cold 12CO at K is cm-2 everywhere in the disk, which is too low to account for observations. In the 2D model (but not in other models!) significant amount of CO is located in the region where the temperature is slightly above the 20 K threshold. If we set the limiting temperature to be 25 K, the 12CO column density raises to cm-2 in the 2D model everywhere in the outer part of the disk ( AU), while in other models it reaches the similar level only at AU, still being less than cm-2 at smaller radii (Fig. 3). The region with K contributes about 1/4 of the total LTE optical depth for 13CO in the 2D model. It must be noted that this temperature threshold is higher than the observed CO temperature of K (Dartois et al., 2003). But in any case, this result clearly indicates that further investigation of 2D (3D) mixing and advective transport with different disk models and/or chemical reaction sets is worthwhile.
Note that it is quite difficult to suggest other robust non-thermal mechanism for such an enhancement in the outer, cold and dark disk midplane, since free-floating CO molecules should stick there to the grain surfaces with nearly probability upon an encounter with a grain and never come back (Bisschop et al., 2006).
Dominik et al. (2005) have proposed a chemical model in which icy mantles are desorbed by the interstellar far UV radiation, forming a layer of gas-phase water above the disk midplane. However, deeper inside the disk the density increases so rapidly that the penetration of even hard-energy FUV photons become next to impossible. The interstellar UV radiation, penetrating the disk from its boundaries, does not propagate deep enough, either, to allow productive desorption of CO at AU, so only the outermost disk part around 700–800 AU is affected.
Another possible explanation would be substantial grain growth, leading to a dramatic decrease of the disk shielding and thus rapid CO mantle photodesorption. However, there is no observational evidence (yet) for considerable grain growth in the case of DM Tau. In addition, we should note that an overall decrease of the disk opacity makes heating by irradiation more efficient and thus decreases the mass reservoir of the very cold gas at K.
References
- Aikawa & Nomura (2006) Aikawa, Y. & Nomura, H. 2006, ApJ, 642, 1152
- Aikawa & Herbst (1999) Aikawa, Y. & Herbst, E. 1999, A&A, 351, 233
- Awad et al. (2005) Awad, Z., Chigai, T., Kimura, Y., Shalabiea, O. M., & Yamamoto, T. 2005, ApJ, 626, 262
- Bauer et al. (1997) Bauer, I., Finocchi, F., Duschl, W. J., Gail, H.-P., & Schloeder, J. P. 1997, A&A, 317, 273
- Bergin et al. (2003) Bergin, E., Calvet, N., D’Alessio, P., & Herczeg, G. J. 2003, ApJ, 591, L159
- Bisschop et al. (2006) Bisschop, S. E., Fraser, H. J., Oberg, K. I., van Dishoeck, E. F., & Schlemmer, S. 2006, A&A, in press (astro-ph/0601082)
- Bockelée-Morvan et al. (2002) Bockelée-Morvan, D., Gautier, D., Hersant, F., Huré, J.-M., & Robert, F. 2002, A&A, 384, 1107
- Boss (2004) Boss, A. 2004, ApJ, 616, 1265
- Brandenburg & Sokoloff (2002) Brandenburg, A., & Sokoloff, D. 2002, Geophysical and Astrophysical Fluid Dynamics, 96, 319
- Ciesla & Cuzzi (2006) Ciesla, F. J., & Cuzzi, J. N. 2006, Icarus, in press (astro-ph/0511372)
- Clarke & Pringle (1988) Clarke, C. J. & Prinlge, J. E. 1988, MNRAS, 235, 365
- Cyr et al. (1998) Cyr, K. E., Sears, W. D., & Lunine, J. I. 1998, Icarus, 135, 537
- D’Alessio et al. (1998) D’Alessio, P., Cantó, J., Calvet, N., Lizano, S. 1998, ApJ, 500, 411
- D’Alessio et al. (1999) D’Alessio, P., Calvet, N., Hartmann, L., Lizano, S., Cantó, J. 1999, ApJ, 527, 893
- Dartois et al. (2003) Dartois, E., Dutrey, A., & Guilloteau, S. 2003, A&A, 399, 773
- Dominik et al. (2005) Dominik, C., Ceccarelli, C., Hollenbach, D., & Kaufman, M. 2005, ApJ, 635, L85
- Dutrey et al. (1997) Dutrey, A., Guilloteau, S., & Guelin, M. 1997, A&A, 317, 55
- Draine (1978) Draine, B.T. 1978 ApJS, 36, 595
- Gail (2001) Gail, H.-P. 2001, A&A, 378, 192
- Glassgold et al. (1997) Glassgold, A. E., Najita, J., & Igea, J. 1997, ApJ, 485, 920
- Glassgold et al. (2005) Glassgold, A. E., Feigelson, E. D., Montmerle, T., & Wolk, S. 2005, ASP Conf. Ser. 341: Chondrites and the Protoplanetary Disk, 341, 165
- Hersant et al. (2001) Hersant F., Gautier D., & Húre J.-M. 2001, ApJ, 554, 391
- Ilgner et al. (2004) Ilgner, M., Henning, Th., Markwick, A. J., & Millar, T. J. 2004, A&A, 415, 643
- Ilgner & Nelson (2006) Ilgner, M. & Nelson, R. P. 2006, A&A, 445, 223
- Johansen & Klahr (2005) Johansen, A. & Klahr, H. 2005, ApJ, 634, 1353
- Keller & Gail (2004) Keller, Ch. & Gail, H.-P. 2004, A&A, 415, 1177
- Lee et al. (1996) Lee, H.–H., Herbst, E., Pineau des Forêts, G., Roueff, E., & Le Bourlot, J. 1996, A&A, 311, 690
- Markwick et al. (2002) Markwick, A. J., Ilgner, M., Millar, T. J., & Henning, Th. 2002, A&A, 385, 632
- Millar et al. (1997) Millar, T. J., Farquhar, P. R. A., & Willacy, K. 1997, A&AS, 121, 139
- Morfill & Völk (1984) Morfill, G. E. & Völk, H. J. 1984, ApJ, 287, 371
- Schräpler & Henning (2004) Schräpler, R. & Henning, Th. 2004, ApJ, 614, 960
- Semenov et al. (2005) Semenov, D., Pavlyuchenkov, Y., Schreyer, K., Henning, Th., Dullemond, C., & Bacmann, A. 2005, ApJ, 621, 853
- Shakura & Sunyaev (1973) Shakura, N. I., & Sunyaev, R. A. 1973, A&A, 24, 337
- Simon et al. (2000) Simon, M., Dutrey, A., & Guilloteau, S. 2000, ApJ, 545, 1034
- van Boekel et al. (2004) van Boekel, R., Min, M., Leinert, Ch., Waters, L. B. F. M. et al. 2004, Nature, 432, 479
- Wiebe et al. (2003) Wiebe, D., Semenov, D., & Henning, Th. 2003, A&A, 399, 197
- Willacy et al. (1998) Willacy, K., Klahr, H. H., Millar, T. J., & Henning, Th. 1998, A&A, 338, 995
- Willacy et al. (2006) Willacy, K., Langer, W., Allen, M., & Bryden, G. 2006, ApJ, in press
- Wooden et al. (2005) Wooden, D. H., Harker, D. E., & Brearley, A. J. 2005, ASP Conf. Ser. 341: Chondrites and the Protoplanetary Disk, 341, 774
- Xie et al. (1995) Xie, T., Allen, M., & Langer, W. D. 1995, ApJ, 440, 674